Rejoignez notre page de fans
- Vues:
- 2065
- Note:
- Publié:
- 2018.06.18 10:55
- Mise à jour:
- 2023.03.29 13:48
-
Besoin d'un robot ou d'un indicateur basé sur ce code ? Commandez-le sur Freelance Aller sur Freelance
A trading system based on the signales of indicator ATR_Normalize_Histogram The signal is formed when a bar is closing if the indicator has crossed the overbought/oversold level and got into the relevant extreme zone:
For the generated EA to operate correctly, the compiledATR_Normalize_Histogram.ex5 indicator file must be in the <terminal_data_directory>\MQL5\Indicators folder.
Note that library file TradeAlgorithms.mqh is designed for using EAs with the brokers that offer a nonzero spread and a possibility to set Stop Loss and Take Profit simultaneously with opening a position. You can download the other versions of this library at Trade Algorithms.
The EA default input parameters were used in tests below. Stop Loss and Take Profit were not used in testing.

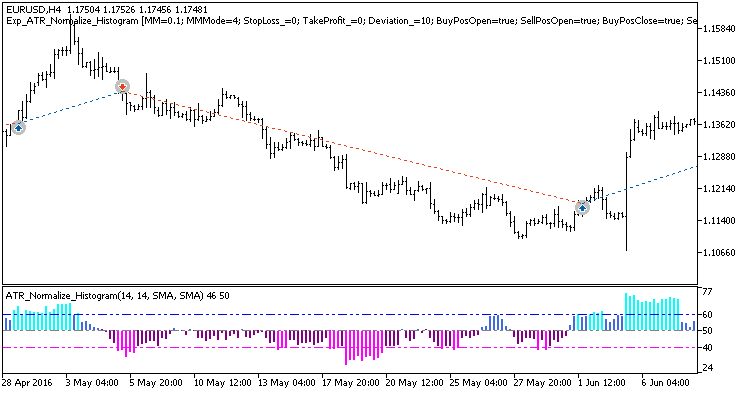
Fig. 1. Example trades on the chart
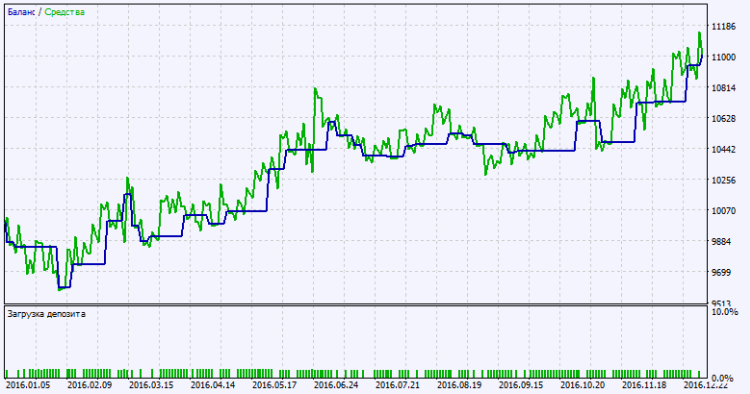
Testing results EURUSD H4 over the year 2016:

Fig. 2. Testing results chart
Traduit du russe par MetaQuotes Ltd.
Code original : https://www.mql5.com/ru/code/20830
 ATR_Normalize_Histogram_HTF
Indicator ATR_Normalize_Histogram with the timeframe selection option available in input parameters, alerting when the overbought/oversold zones are broken through.
 ATR_Normalize_Histogram
A typical oscillator using Average True Range in form of a multicolor histogram.
 AnchoredMomentum_x10
Indicator AnchoredMomentum_x10 shows the location of indicator AnchoredMomentum from ten different timeframes.
 InvertCandle_Plus
The inverted chart of the current financial instrument, displaying Ask and Bid price levels.
