Rejoignez notre page de fans
- Vues:
- 3076
- Note:
- Publié:
- 2017.01.18 09:22
- Mise à jour:
- 2023.03.29 13:47
-
Besoin d'un robot ou d'un indicateur basé sur ce code ? Commandez-le sur Freelance Aller sur Freelance
Real author:
J.B
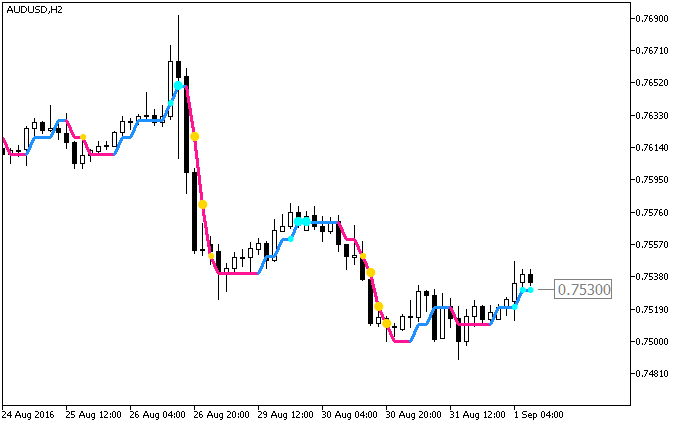
The vaMA indicator with the ability to replace averaging. It displays the most recent value as a price label with the possibility to round the channel levels up to a required number of digits. Additionally, it indicates the trend strength by colored dots based on the standard deviation algorithm. The number of digits to round is set in the input variable Digit:
input uint Digit=3; //Number of digits to round to
If the standard deviation of the ColorXvaMA indicator is between the dK1 and dK2 parameter values, then a small colored dot appears on the moving average. Its color corresponds to the current trend direction.
input double dK1=1.5;  // Square-law filter coefficient 1
input double dK2=2.5;  // Square-law filter coefficient 2
If the standard deviation becomes higher than the dK2 input parameter value, then the dot size increases. Thus, we get 3 levels of trend strength indication.
- Weak — no dots;
- Medium — small colored dots;
- Strong — big colored dots.
The indicator uses the classes of SmoothAlgorithms.mqh library (copy it to <terminal_data_folder>\MQL5\Include). The use of the classes was thoroughly described in the article "Averaging Price Series for Intermediate Calculations Without Using Additional Buffers".

Fig1. The ColorXvaMA_Digit_StDev indicator
Traduit du russe par MetaQuotes Ltd.
Code original : https://www.mql5.com/ru/code/16340
 SyncChart
Synchronization of the bars displayed on all open charts of the terminal.
 Histogram Bid and Ask prices
The statistical distribution of Bid and Ask prices on the chart as a histogram.
 Exp_ColorXvaMA_Digit
The Exp_ColorXvaMA_Digit Expert Advisor is based on the ColorXvaMA_Digit indicator color change.
 XvaMA_HTF
The XvaMA indicator with the timeframe selection option available in the input parameters.