Leonid Basis / Perfil
- Información
|
12+ años
experiencia
|
232
productos
|
74
versiones demo
|
|
0
trabajos
|
0
señales
|
0
suscriptores
|
This indicator works on any financial instruments and time periods. The indicator contains only one parameter: nBars - number of bars for histogram's value calculation. If a Green pole rises from a Red pole above the zero line then a Long position may be opened. If a Red pole rises from a Green pole under the zero line then a Short position may be opened. The height of the each pole represents the Power of an Up/Down movement. The transition from Red to Green (and vice versa) shows change of
Buy Wait Sell Trigger is very easy to read and use. The one and only indicator's line (color Aqua) can be equal to a zero-line or plus/minus one-line. The zero line is characterizing the flat trend. It means that you should wait. The V-shaped impulse indicates the entrance to the opposite direction. The U-shaped impulse indicates entry orders in the same direction. If the indicator line resizes on the plus one-line, you may go Long. If the indicator line resizes on the minus one-line, you may go
The price is moving between two curve tunnel lines in a trend. The two lines of a tunnel represent support and resistance. In an uptrend, for instance, a trade might be entered at the support of the trend line (shown by the red line in the chart) and exited at resistance of the upper tunnel line (shown by the blue line). Tunnel show trend direction for any timeframe (if you have enough bars on the chart for higher timeframes). Trend, or price tunnel, can be up, down or sideways. If the current
Trading Machine is an Expert Advisor (Robot) for any financial instrument on the MetaTrader 4 platform. All input parameters are optimized for EURUSD M1 . Of course, you are able to optimize these parameters for any currency pairs and timeframe. The main input parameters are A, B, C, D, and E , which can be any positive numbers. These are input parameters (weight coefficients) of the one layer neural network. The EA checks for a new trend and opens a position accordingly. If a trend changes its
eaVeryActive is an Expert Advisor (Robot) for any financial instrument on the MT4 platform. All input parameters were optimized and used on EURUSD, M15 . Of course you are able to optimized those parameters for any currency pairs and time frames. The main input parameters are a, b, c, d, e, f, g and h , which can be any numbers in the range from 1 to 9 - input parameters (weight coefficients) of the one layer neural network. This robot will open as many position as you want by input parameter
The term Overbought describes a period of time where there has been a significant and consistent upward move in price over a period of time without much pullback. The term Oversold describes a period of time where there has been a significant and consistent downward move in price over a period of time without much pullback. Because price cannot move in one direction forever, price will turn around at some point. This indicator will show a Magenta arrow in case of Overbought condition and Aqua
This is a Multiple Time Frames and Multiple Currency Pairs Indicator ( Score Board ) that shows Support and Resistance Levels from all TFs for 15 currency pairs by your choice. Support terminology refers to prices on a chart that tend to act as a floor by preventing the price of an asset from being pushed downward and can be a good buying opportunity because this is generally the area where market participants see good value and start to push prices higher again. Resistance terminology refers to
The Stochastic Oscillator is a momentum indicator that uses support and resistance levels. The term "stochastic" refers to the point of a current price in relation to its price range over a period of time. You can use a New Stochastic in the same way as classical one: Overbought and Oversold areas to make a Buy or Sell orders. This new indicator shows all variety of Fibonacci Levels (from 23.6 to 76.4) which can be used as Overbought and Oversold levels as well as points to close an open
Accelerator_EA is an Expert Advisor using a trend strategy based on the indicator AC-Complete (www.mql5.com/en/market/product/24613). "Acceleration/Deceleration Technical Indicator (AC) measures acceleration and deceleration of the current driving force. This indicator will change direction before any changes in the driving force, which, it its turn, will change its direction before the price. If you realize that Acceleration/Deceleration is a signal of an earlier warning, it gives you evident
MACD (Moving Average Convergence/Divergence) is a classical trading indicator used in technical analysis from late 1970s. It is supposed to reveal changes in the strength, direction, momentum, and duration of a trend currencies price (also stocks, commodities etc). The New MACD indicator is an advanced model of the standard MACD indicator. You may use the New MACD absolutely the same way as classical. The main difference is that New MACD is working faster (in case of similar input parameters)
Acceleration/Deceleration Technical Indicator (AC) measures acceleration and deceleration of the current driving force. This indicator will change direction before any changes in the driving force, which, it its turn, will change its direction before the price. If you realize that Acceleration/Deceleration is a signal of an earlier warning, it gives you evident advantages. But, a classical AC indicator does not include any input parameter. In the source file we can see that this indicator are
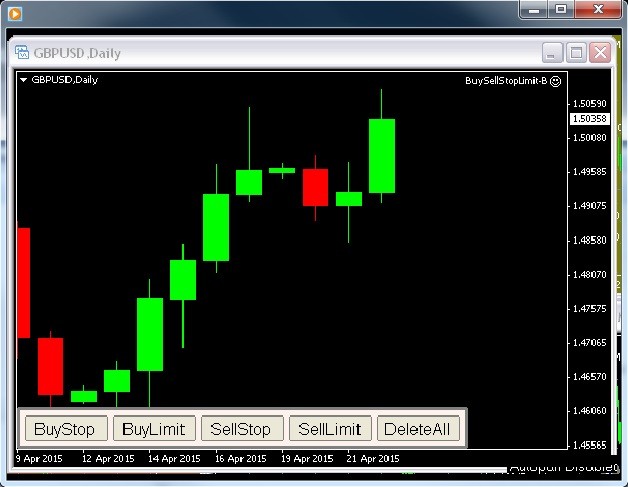
This EA opens any combination of Pending Orders (Buy Stop, Sell Stop, Buy Limit and Sell Limit) at any particular Time (Hour and Minutes) and closes all existing pending orders in case you do not need them. Input Parameters Before placing all pending orders, the input window is opened allowing you to modify all input parameters: nHour: at what Hour you want to open any Pending Orders. nMinotes: at what Minute of Hour you want to open any Pending Orders. DeleteAllPendings : if true , then all
This indicator will show Buy (color Aqua) or Sell (color Magenta) arrow at the moment when a Long or a Short local trend (local to the current TimeFrame) is expected. The huge advantage is that the indicator does not have any input parameters. So, you will not waste your time and will not struggle to change them for different TimeFrames and currency pairs. This indicator is universal, but it will work better on H1 and lower TFs
This indicator is constantly calculating the probability of a trend. The result of those calculations is shown in the upper left corner of the chart. It is shown in a green color text if the trend is expecting to go Up, in a red text if the trend is expending to go Down, and in a white text if "no trend" is calculated. It can show cross lines in color of your choice or you can delete those cross lines by setting Cross color to "None". This indicator can show a radar vector in color of your
This is an example of how the MetaTrader terminals's Strategy Tester can help to find good input parameters for an old and widely known MACD Sample Expert Advisor, which is available in the Navigator window (tab: Expert Advisors). Input parameters Indicator MACD: fast - fast Period; slow - Slow Period; sign - Signal Period; appPrice - PRICE_CLOSE=0; PRICE_OPEN=1; PRICE_HIGH=2; PRICE_LOW=3; PRICE_MEDIAN=4; PRICE_TYPICAL=5; PRICE_WEIGHTED=6; MACDOpenLevel ; MACDCloseLevel ; Indicator Moving
If you would like to trade reversals and retracements, this indicator is for you. The huge advantage is that the indicator does not have input parameters. So, you will not waste your time and will not struggle to change them for different timeframes and symbols. This indicator is universal. The green triangle represents a possibility to go long. The red triangle represents a possibility to go short. The yellow dash represents a "non-trading" situation. This indicator could be used on M1, M5
This indicator is based on a classical Commodity Channel Index (CCI) indicator and shows a digital values of CCI from two higher (than current) Time Frames. If, for example, you will put it on the M1 TF it will show a digital values of the CCI from M5 (TF1) and M15 (TF2). As everybody knows, the CCI is using +100 (LevelUp) and -100 (LevelDn) boundaries. You have the possibility to change those numbers according to your strategy. When a line graph of the CCI will go higher than LevelUp then a


