• Información general
  • Comentarios
  • Discusión

Relative Trend Index

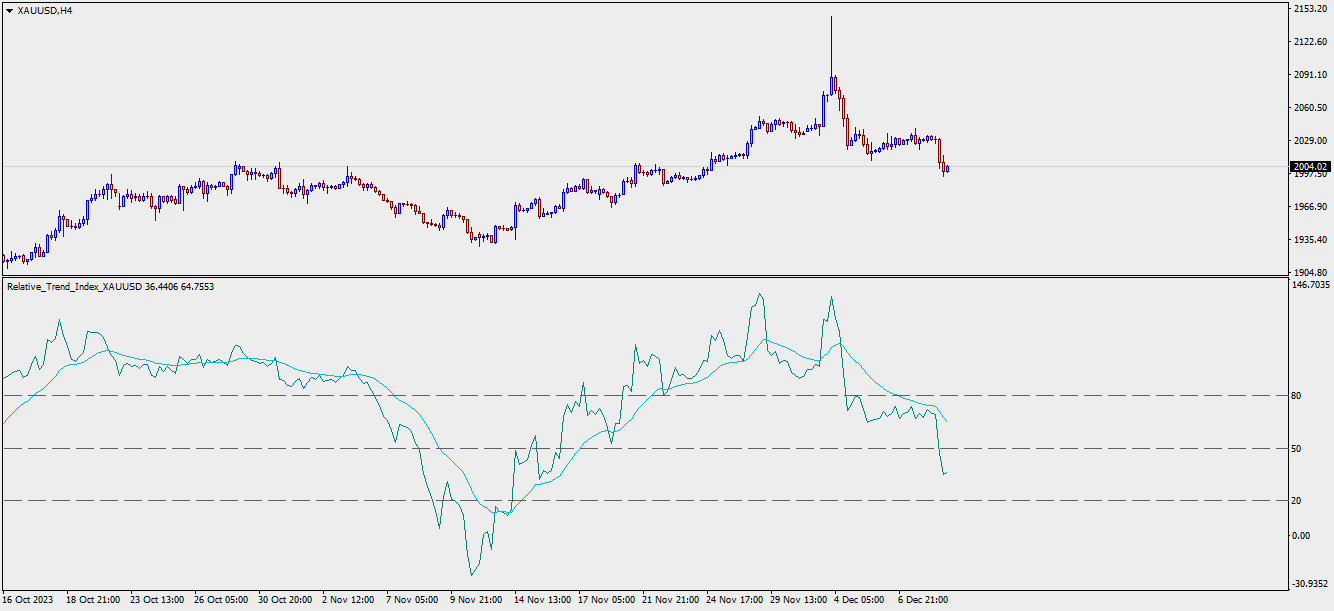
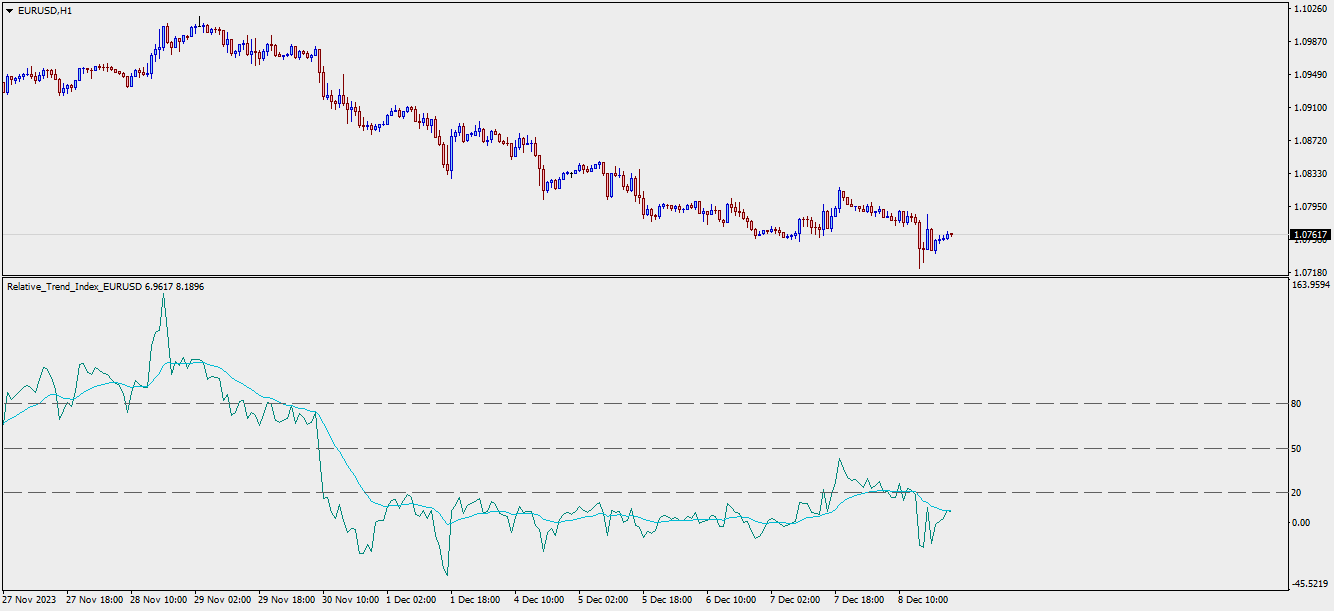
El indicador se traduce de otro lenguaje de programación a MQL. RTI es un poderoso peaje para identificar la tendencia de la tabla de una manera oscilación.

aquí algunas notas del programador original:

Visión general
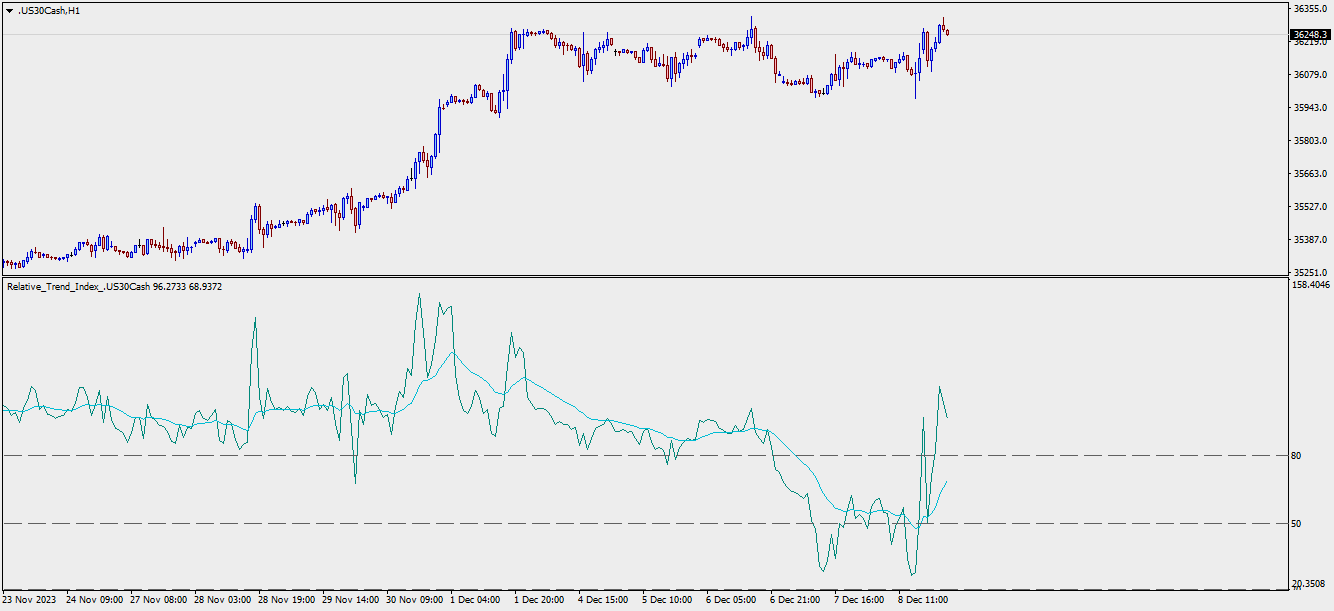
El Relative Trend Index (RTI) desarrollado por Zeiierman es una innovadora herramienta de análisis técnico diseñada para medir la fuerza y la dirección de la tendencia del mercado. A diferencia de algunos indicadores tradicionales, el RTI cuenta con una capacidad distintiva para adaptarse y responder a la volatilidad del mercado, al tiempo que minimiza los efectos de las pequeñas fluctuaciones del mercado a corto plazo.

El Índice de Tendencia Relativa combina características de seguimiento de tendencias y de inversión de medias, junto con un enfoque personalizable e intuitivo de la fuerza de la tendencia, y su sensibilidad a la acción de los precios hace que este indicador destaque.

Ventajas de utilizar este RTI en lugar del RSI
El Índice de Fuerza Relativa (RSI) y el Índice de Tendencia Relativa (RTI) son dos potentes indicadores técnicos, cada uno con sus propios puntos fuertes.
Sin embargo, existen diferencias clave que hacen que el RTI sea posiblemente más sofisticado y preciso, especialmente cuando se trata de identificar tendencias y zonas de sobrecompra/sobreventa (OB/OS).
Productos recomendados
The indicator is the advanced form of the MetaTrader 4 standard Fibonacci tool. It is unique and very reasonable for serious Fibonacci traders. Key Features Drawing of Fibonacci retracement and expansion levels in a few seconds by using hotkeys. Auto adjusting of retracement levels once the market makes new highs/lows. Ability to edit/remove any retracement & expansion levels on chart. Auto snap to exact high and low of bars while plotting on chart. Getting very clear charts even though many ret
Std Channels
Muhammed Emin Ugur
Std Channels The Std Channels Indicator is a technical indicator that uses standard deviation to create five channels around a price chart. The channels are used to identify support and resistance levels, as well as trends and reversals. The indicator is calculated by first calculating the standard deviation of the price data over a specified period of time. The channels are then created by adding and subtracting the standard deviation from the price data. The five channels are as follows: Upper
Esta herramienta de software está diseñada para agilizar el proceso de creación de líneas de tendencia horizontales y rectángulos en cinco colores personalizables a su elección. Dibujar líneas de tendencia horizontales precisas en MT5 puede ser un desafío, pero con este indicador, puede crearlas sin esfuerzo en los colores que se adapten a sus preferencias. Además, nuestra herramienta proporciona una visualización clara de los niveles de precios asociados con las líneas horizontales que dib
1 of 10 for 69$ . Next Price is 89$ SMC Unmitigated Finding is a indicator for find unmitigated supply and demand in previous legs of price Settings Zigzag Settings ZZDepth - by Default is 12. ZZDeviation - by Default is 5. ZZBackStep - by Default is 3. Rectangle Settings SupportColor-  color for Support line.  ResistanceColor  -  color for Resistance line. Settings Num of Show -  Number of Support & Resistance Show.
Индикатор ищет подобную ценовую структуру, сравнивая с последней ценовой структурой. Размер паттерна (грубо говоря количество переломов зигзага) настраивается (всегда меньше на 1, чем введено - нулевой перелом не считается). Все найденные совпадения отмечаются прямоугольником. Так же к паттернам существует быстрая навигация с помощью кнопочек "Next patt" и "Prev patt". В индикатор вшиты два индикатора типа ЗигЗа г : стандартный зигзаг и пользовательский , моей разработки. Параметры настройки ста
A top-quality implementation of the famous  Zig Zag  indicator, which needs no introduction. It is completely coming from original algorithm.  After you have this indicator, you will no need any more indicator for opposite direction of trend. Trading direction of TREND Very easy to understand and set  It implements a multi-timeframe dashboard Buy and Sell signals on same chart  Working M5-M15-M30-H1-H4 and D1  After the purchase, please contact me for to learn how to use it. 
The Sensitive Volume indicator is an indicator designed to generate trading signals. The purpose of this indicator is to generate signals from the highest probability of trading. Using a number of price movements and a set of indicator properties to generate these signals.  Easy to use, simple and understandable to the user. With alert features, user signals can be reached quickly.  Visually the user can easily recognize the signals. This indicator will not repaint. Parameters Trend_Period - p
Scanner and Dashboard for Money Flow Index for MT4 The Money Flow Index (MFI) is a technical oscillator that uses price and volume data for identifying overbought or oversold signals in an asset. It can also be used to spot divergences which warn of a trend change in price. The oscillator moves between 0 and 100. Advantages of the Scanner: - Full Alert Options. - Multi Timefrare  - Works for all instruments including Currencies, Indices, Commodities, Cryptocurrencies and Stocks. - Fully customis
Very special indicator of Joe Dinapoli which is a derivative from traditional MACD indicator. It shows the precise price, at which MACD will show line crossing and trend shifting. Also, this level is known one period ahead of time.You can constantly reassess your current position by looking at this studying a variety of timeframes. When you are in a trade, you have a feel for how much time you have for the trade to go your way by looking at the distance between the MACD Predictor line and the
The trend beads indicator is software that does not include trend indicators such as moving average, Bollinger bands. This indicator works entirely with price and bar movements. The purpose of the indicator is to calculate the most likely trends. To assist the user in determining trend trends. The user determines the trend direction with the colors on the screen. You can use this indicator alone as a trend indicator. Or with other indicators suitable for your strategy. Trade Rules Rising trend
The Fibonacci Target indicator is an indicator that uses the Low, High and Fibonacci levels. This indicator has the ability to predict the target. It tries to determine the target that the graph will go on average and draws a target region. The indicator also serves as an oscillator. It can be used as a trend oscillator after making the necessary settings. This indicator is helpful to your strategy. There is no signal generating capability. Parameters TargetPeriod - Target line period setting
MYEwo
Ahmet Metin Yilmaz
The MyEwo indicator is a tool that helps you to find the short maturity direction in your chart. Default input values are frequently used values in this indicator. You can find and use your own values according to your own trend detection and pairs you will trade. My advice is to use a moving average in order to understand the long maturity trend on your main graph (200 and higher may be appropriate). The M5 graphics will be simplify Scalping style Trade transactions that you will use . You can
Teknolojide ki yüksek gelişim, üretim, e ticaret, lojistik vb tüm sektörlerde kullanıma başlandığı gibi artık finansal piyasalarda da “ yapay zeka ve algoritma” kullanılmaya başlandı. Smart Algoritma indikatörü; kaynak kodu içinde yer alan algoritma ve yapay zekası ile hiçbir analize ihtiyaç duyulmadan gün içi bütün forex enstrümanları için size buy ve sell sinyalleri yanında hedef kanal (gün içi en yüksek ve en düşük seviyeler) verir. İndikatör texti aşağıda ki bölümlerden oluşur ve herkesin a
Introduction to Smart Renko The main characteristics of Renko Charting concern price movement. To give you some idea on its working principle, Renko chart is constructed by placing a brick over or below when the price make the movement beyond a predefined range, called brick height. Therefore, naturally one can see clear price movement with less noise than other charting type. Renko charting can provide much clearer trend direction and it helps to identify important support and resistance level
The Multi Channel Trend indicator was developed to help you determine the trend direction by drawing channels on the graphical screen. It draws all channels that can be trending autonomously. It helps you determine the direction of your trend. This indicator makes it easy for you to implement your strategies. The indicator has Down trend lines and Up trend lines. You can determine the price direction according to the multiplicity of the trend lines. For example , if the Down trend lines start to
Ticks To Levels
Mikhail Kontsevoy
This indicator counts ticks and graphically displays the price levels, on which the greatest number of them was detected. Thus, it sufficiently accurately determines the levels of support and resistance. The indicator will be useful for traders who trade breakout or scalping strategies. Features Technical analysis provides several ways for finding levels of support and resistance. Ticks to Levels provides another, fairly accurate, way of determining these levels empirically. The criterion for
Very special indicator of Joe Dinapoli which is a derivative  of a Detrended Oscillator. Through a set of parametric equations, a predicting oscillator is created that forecasts, one period ahead of time, overbought and oversold conditions. The resulting predictor values are expressed as bands on the bar chart, both above and below the market. It may be mistaken as a Bollinger Band but has no resemblance to it whatsoever. The Predictor bands may be used in a variety of ways to aid in entering an
The Stochastic Alerts indicator is an advanced model of the standard stochastic indicator. This indicator is different from the standard indicator 2 level warning feature has been added. For example, the user will be able to receive warnings at levels above 80 and below 20. It can change the levels you wish. For example 60 and 40 can do. This depends on the user's discretion. you can turn the alerts on or off as desired. Parameters Kperiod - Standard stochastic kperiod setting Dperiod - Stan
Flag Pattern indicator is an indicator designed to find flag patterns. Bullish and bear find flag patterns. It finds these patterns by its own algorithm. The display is easy to use and simple. Features Bullish and bear find flag patterns. Draw patterns on the graphic screen. invalid flag patterns. alert the user with the alert feature. Flag patterns have the ability to change colors. Parameters MinSplashHeight -  Min. height of splash setting MaxBarsDuration -  Max bars before crossing setting
The indicator is the advanced form of the MetaTrader 4 standard Fibonacci tool. It is unique and very reasonable for serious Fibonacci traders. Key Features Drawing of Fibonacci retracement and expansion levels in a few seconds by using hotkeys. Auto adjusting of retracement levels once the market makes new highs/lows. Ability to edit/remove any retracement & expansion levels on chart. Auto snap to exact high and low of bars while plotting on chart. Getting very clear charts even though man
FiboZag
Andriy Sydoruk
Indicator FiboZag - transfer the indicator to the chart and the Fibonacci levels will be built automatically on the last ZigZag turn. The main advantage lies in the correct construction of Fibonacci levels and markup of price levels. Simple, visual and effective use. The indicator is not redrawn and does not lag. Works on all currency pairs and on all timeframes.
Introduction to X3 Chart Pattern Scanner X3 Cherart Pattern Scanner is the non-repainting and non-lagging indicator detecting X3 chart patterns including Harmonic pattern, Elliott Wave pattern, X3 patterns, and Japanese Candlestick patterns. Historical patterns match with signal patterns. Hence, you can readily develop the solid trading strategy in your chart. More importantly, this superb pattern scanner can detect the optimal pattern of its kind. In addition, you can switch on and off individu
Auto Levels
Yaroslav Varankin
Auto Level this tool is able to determine the levels of support and resistance. search and display when the price has broken through the level and when it pushed off from it. the indicator can be useful if you use resistance support levels in your trading. or the highs and lows of the price, then it will greatly simplify your work and help you more quickly and more accurately determine the rebound or breakdown of the current trend or tendencies level. blue line bottom uptrend red line on top dow
-   Real price is 90$   - 50% Discount ( It is 45$ now ) Contact me for instruction, any questions! Introduction V Bottoms and Tops are popular   chart patterns   among traders due to their potential for identifying trend reversals. These patterns are characterized by sharp and sudden price movements, creating a V-shaped or inverted V-shaped formation on the   chart . By recognizing these patterns, traders can anticipate potential shifts in market direction and position themselves according
LinearRegressionDecomposition ( LRD ) Linear Regression Decomposition has been calculated using a very complex method. Basically, by examining the retractions of the price movements of the instruments on the Metatrader platform, it is aimed to decompose these movements linearly. The indicator is shown on the graph with two separate lines. The red line is our main indicator and handles the price divergence. The blue line filters the red signal. For example, for a buy signal to occur: the red
ICT Core Content Concepts turned into indicator plus all previous tools known from the  Position Smart Indicator . This makes it the Full PSI Private Version ( read more ) restricted up to now but available only after the Mentorship Core Content was made public on   YouTube. You will find many price action study tools like: Central Bank Dealing Range - CBDR Asian Range FLOUT Profiles and SD targets on the CBRD, Asian Range and Flout both on the   wicks   and on the   bodies Seek & Destroy Profil
Introducing our advanced MQL4 Indicator, a groundbreaking tool for identifying support and resistance zones with unmatched precision. Elevate your trading strategy with a host of features, including a dual-color upper and lower box system that allows for easy visual recognition of market trends. Key Features: Dual-Color Box for the Support and Resistance Zones Customize your analysis with dual-color box. The upper and lower boxes offer distinct colors, providing a clear visual representation o
Scanner and Dashboard for Cycle Sniper ATR Fibo Channels Indicator As users know indicator draws Fibonacci Channels and arrows according to the user's settings. With CS ATR Fibo Channels Scanner, you will have the ability to watch the market. - Multi Timeframe - Multi Instrument Enter your parameters to watch (as explained in Cycle Sniper ATR Fibo Channels Indicator )  - If you cho0se "Arrows by ATR Levels" , you will receive the potential reversal arrrows. - If you choose "Arrows by M
Nice Stable Arrow
Muhammed Emin Ugur
Nice Stable Arrow   indicator is designed for signal trading. This indicator generates trend signals. It uses many algorithms and indicators to generate this signal. It tries to generate a signal from the points with the highest trend potential. This indicator is a complete trading product. This indicator does not need any additional indicators. The indicator certainly does not repaint. The point at which the signal is given does not change. Signals are sent at the beginning of new candle
Trend Guess
Harun Celik
3 (2)
The ”Trend Guess” is a complex software that does not involve the MACD, RSI or moving averages. It adapts itself to current market conditions using complicated algorithms based on price action and out custom indicators. The indicator will gives you trading signals Buy or Sell stop loss levels indicated in the popup alert window and graphically. You have to do is to press buy or sell button whenever you get a signal Important Rules Identify a current long term trend. Example – if you trade on a
Los compradores de este producto también adquieren
Gann Made Easy
Oleg Rodin
4.93 (68)
Gann Made Easy es un sistema de comercio de Forex profesional y fácil de usar que se basa en los mejores principios de comercio utilizando la teoría del Sr. W. D. Gann. El indicador proporciona señales precisas de COMPRA y VENTA, incluidos los niveles de Stop Loss y Take Profit. Puede comerciar incluso sobre la marcha utilizando notificaciones PUSH. ¡Por favor, póngase en contacto conmigo después de la compra! ¡Compartiré mis consejos comerciales con usted y excelentes indicadores de bonificació
ACTUALMENTE 26% DE DESCUENTO ¡La mejor solución para cualquier operador novato o experto! Este indicador es una herramienta única, de alta calidad y asequible porque hemos incorporado una serie de características propias y una nueva fórmula. ¡Con sólo UN gráfico puede leer la Fuerza de la Divisa para 28 pares de Divisas! Imagínese cómo mejorará su operativa porque podrá señalar el punto exacto de activación de una nueva tendencia o de una oportunidad de scalping. Manual del usuario: haga
Atomic Analyst
Issam Kassas
5 (3)
En primer lugar, vale la pena enfatizar que este Indicador de Trading no repinta, no redibuja y no se retrasa, lo que lo hace ideal tanto para el trading manual como para el automatizado. Manual del usuario: configuraciones, entradas y estrategia. El Analista Atómico es un Indicador de Acción del Precio PA que utiliza la fuerza y el impulso del precio para encontrar una mejor ventaja en el mercado. Equipado con filtros avanzados que ayudan a eliminar ruidos y señales falsas, y aumentan el poten
Advanced Supply Demand
Bernhard Schweigert
4.92 (311)
¡Actualmente con 33% de descuento! ¡La mejor solución para cualquier tráder principiante o experto! Este indicador es una herramienta comercial única, de alta calidad y asequible, porque incorpora una serie de características patentadas y una nueva fórmula. Con esta actualización, podrá mostrar zonas de doble marco temporal. No solo podrá mostrar un marco temporal más alto, sino también mostrar ambos, el marco temporal del gráfico MÁS el marco temporal más alto: MOSTRANDO ZONAS ANIDADAS. A todos
TPSpro RFI Levels
Roman Podpora
4.87 (15)
Reversal First Impulse levels (RFI)    INSTRUCTIONS        RUS       -       ENG              R ecommended to use with an indicator   -   TREND PRO -  Version MT5 A key element in trading is zones or levels from which decisions to buy or sell a trading instrument are made. Despite attempts by major players to conceal their presence in the market, they inevitably leave traces. Our task was to learn how to identify these traces and interpret them correctly. Main functions: Displaying active zones
TrendMaestro
Stefano Frisetti
5 (2)
note: this indicator is for METATRADER4, if you want the version for METATRADER5 this is the link:  https://www.mql5.com/it/market/product/108106 TRENDMAESTRO ver 2.4 TRENDMAESTRO recognizes a new TREND in the bud, he never makes mistakes. The certainty of identifying a new TREND is priceless. DESCRIPTION TRENDMAESTRO identifies a new TREND in the bud, this indicator examines the volatility, volumes and momentum to identify the moment in which there is an explosion of one or more of these data a
Trend Punch
Mohamed Hassan
5 (4)
Manual guide:   Click here Starting price of  $88  for the first 25 copies only ( 3  left)! -- Next price is  $176 .  This indicator is unstoppable when combined with our other indicator called  Support & Resistance . After purchase, send us a message and you could get  it  for  FREE as a BONUS!  Introducing Trend Punch , the revolutionary forex trend indicator that will transform the way you trade! Trend Punch is uniquely designed to provide precise buy and sell arrows during strong
Scalper Inside PRO
Alexey Minkov
4.75 (57)
An exclusive indicator that utilizes an innovative algorithm to swiftly and accurately determine the market trend. The indicator automatically calculates opening, closing, and profit levels, providing detailed trading statistics. With these features, you can choose the most appropriate trading instrument for the current market conditions. Additionally, you can easily integrate your own arrow indicators into Scalper Inside Pro to quickly evaluate their statistics and profitability. Scalper Inside
TPSproTREND PrO
Roman Podpora
4.78 (18)
TPSpro TRENDPRO  - is a trend indicator that automatically analyzes the market and provides information about the trend and each of its changes, as well as giving signals for entering trades without redrawing! The indicator uses each candle, analyzing them separately. referring to different impulses - up or down impulse. Exact entry points into transactions for currencies, crypto, metals, stocks, indices!  -  Version MT5               DETAILED DESCRIPTION                R ecommended to use with
¡Descubra el secreto para el comercio de Forex exitoso con nuestro indicador MT4 personalizado! ¿Alguna vez se ha preguntado cómo lograr el éxito en el mercado de Forex, obteniendo ganancias constantemente al tiempo que minimiza el riesgo? ¡Aquí está la respuesta que ha estado buscando! Permítanos presentar nuestro indicador MT4 patentado que revolucionará su enfoque para el comercio. Versatilidad única Nuestro indicador está especialmente diseñado para usuarios que prefieren las formacio
Break and Retest
Mohamed Hassan
4.33 (12)
New update to V.4 where  Break & Retest automatically draws the take profit & stop loss levels and you also have more signals per day! ‍You can visually backtest Break & Retest to see how it behaved in the past!     Manual guide:   Click here $65  for only 1  copy left! Next price is $120 .  This Indicator only places quality trades when the market is really in your favor with a clear break and retest. Patience is key with this price action strategy! If you want more alert s
Conviértase en un Breaker Trader y obtenga beneficios de los cambios en la estructura del mercado a medida que se invierte el precio. El indicador de ruptura de bloque de órdenes identifica cuándo una tendencia o movimiento de precio se acerca al agotamiento y está listo para revertirse. Le alerta sobre cambios en la estructura del mercado que generalmente ocurren cuando una reversión o un retroceso importante están a punto de suceder. El indicador utiliza un cálculo patentado que identific
¡Actualmente 20% OFF ! ¡La mejor solución para cualquier novato o trader experto! Este software funciona con 28 pares de divisas. Se basa en 2 de nuestros principales indicadores (Advanced Currency Strength 28 y Advanced Currency Impulse). Proporciona una gran visión general de todo el mercado de divisas. Muestra los valores de Advanced Currency Strength, la velocidad de movimiento de las divisas y las señales para 28 pares de divisas en todos los (9) marcos temporales. Imagine cómo mejorar
Ante todo, vale la pena enfatizar que esta Herramienta de Trading es un Indicador No Repintado, No Redibujado y No Retrasado, lo que la hace ideal para el trading profesional. Curso en línea, manual del usuario y demostración. El Indicador de Conceptos de Acción del Precio Inteligente es una herramienta muy potente tanto para traders nuevos como experimentados. Combina más de 20 indicadores útiles en uno solo, combinando ideas avanzadas de trading como el Análisis del Trader del Círculo Interio
Currency Strength Wizard es un indicador muy poderoso que le proporciona una solución todo en uno para operar con éxito. El indicador calcula el poder de este o aquel par de divisas utilizando los datos de todas las monedas en múltiples marcos de tiempo. Estos datos se representan en forma de índice de moneda fácil de usar y líneas eléctricas de moneda que puede usar para ver el poder de esta o aquella moneda. Todo lo que necesita es adjuntar el indicador al gráfico que desea operar y el indicad
Por supuesto, aquí tienes la traducción al español: Presentamos el Indicador de Astronomía para MT4: Tu Compañero Celestial Definitivo en el Trading ¿Estás listo para elevar tu experiencia de trading a alturas celestiales? No busques más allá de nuestro revolucionario Indicador de Astronomía para MT4. Esta innovadora herramienta trasciende los indicadores de trading tradicionales, aprovechando el poder de algoritmos complejos para proporcionarte una visión astronómica sin igual y cálculos de pre
Trend Screener
STE S.S.COMPANY
4.83 (88)
Indicador de tendencia, solución única e innovadora para el comercio y filtrado de tendencias con todas las funciones de tendencias importantes integradas en una sola herramienta. Es un indicador 100% sin repintar de marcos temporales y monedas múltiples que se puede usar en todos los símbolos/instrumentos: divisas, materias primas, criptomonedas, índices y acciones. Trend Screener es un indicador de seguimiento de tendencia eficiente que proporciona señales de tendencia de flecha con puntos en
TrendDecoder Premium
Christophe Pa Trouillas
5 (4)
Identifique los rangos y los próximos movimientos probables   |  Obtenga las señales más tempranas y la fuerza de las Tendencias   |  Obtener salidas claras antes de reversión   |  Detecte los niveles de Fibo que el precio pondrá a prueba Indicador no repintado y no retardado - ideal para la trading manual y automatizada - adecuado para todos los activos y todas las unidades temporales Oferta por tiempo limitado >>   50% OFF Después de la compra, póngase en contacto con mi canal  para conocer lo
FX Volume
Daniel Stein
4.6 (35)
Obtenga su actualización diaria del mercado con detalles y capturas de pantalla a través de nuestro Morning Briefing aquí en mql5 y en Telegram ! FX Volume es el PRIMER y ÚNICO indicador de volumen que proporciona una visión REAL del sentimiento del mercado desde el punto de vista de un bróker. Proporciona una visión impresionante de cómo los participantes institucionales del mercado, como los brokers, están posicionados en el mercado Forex, mucho más rápido que los informes COT. Ver esta info
ICT, SMC, SMART MONEY CONCEPTS, SMART MONEY, Smart Money Concept, Support and Resistance, Trend Analysis, Price Action, Market Structure, Order Blocks, BOS/CHoCH,   Breaker Blocks ,  Momentum Shift,   Supply&Demand Zone/Order Blocks , Strong Imbalance, HH/LL/HL/LH,    Fair Value Gap, FVG,  Premium  &   Discount   Zones, Fibonacci Retracement, OTE, Buy Side Liquidity, Sell Side Liquidity, BSL/SSL Taken, Equal Highs & Lows, MTF Dashboard, Multiple Time Frame, BigBar, HTF OB, HTF Market Structure, 
ACTUALMENTE 31% DE DESCUENTO Este indicador es una herramienta de transacción única, de alta calidad y asequible porque hemos incorporado una serie de características propias y una fórmula secreta. Con solo un gráfico, da Alertas para los 28 pares de divisas. ¡Imagina cómo mejorarás porque puedes identificar el punto de activación exacto de una nueva tendencia u oportunidad de crecimiento! Basado en nuevos algoritmos subyacentes , hace que sea aún más fácil identificar y confirmar operaciones po
Scalper Vault
Oleg Rodin
5 (28)
Scalper Vault es un sistema profesional de reventa que le brinda todo lo que necesita para una reventa exitosa. Este indicador es un sistema comercial completo que puede ser utilizado por operadores de divisas y opciones binarias. El marco de tiempo recomendado es M5. El sistema le proporciona señales de flecha precisas en la dirección de la tendencia. También le proporciona señales superiores e inferiores y niveles de mercado de Gann. Los indicadores proporcionan todo tipo de alertas, incluidas
Dragon Multi Indicator MT4
Mansour Babasafary
5 (4)
3 Indicators in 1 indicator Strategy based on price action Made specifically for the best forex currency pairs Can be used in the best time frame of the market at a very reasonable price This indicator is basically 3 different indicatos . But we have combined these 3 indicators in 1 indicator so that you can use 3 indicators at the lowest price. All three strategies are based on price action. But based on different trends. Long term, medium term and short term Attributes : No repaintin
Legacy of Gann
Pavel Zamoshnikov
4.83 (12)
The indicator very accurately determines the levels of the possible end of the trend and profit fixing. The method of determining levels is based on the ideas of W.D.Gann, using an algorithm developed by his follower Kirill Borovsky. Extremely high reliability of reaching levels (according to K. Borovsky  - 80-90%) Indispensable for any trading strategy – every trader needs to determine the exit point from the market! Precisely determines targets on any timeframes and any instruments (forex, met
El indicador de reversión de ADR le muestra de un vistazo dónde se cotiza actualmente el precio en relación con su rango diario promedio normal. Recibirá alertas instantáneas a través de una ventana emergente, correo electrónico o push cuando el precio exceda su rango promedio y los niveles por encima de su elección para que pueda saltar rápidamente a retrocesos y reversiones. El indicador dibuja líneas horizontales en el gráfico en los extremos del rango promedio diario y también extensiones p
Auto Order Block with break of structure based on ICT and Smart Money Concepts Futures Break of Structure ( BoS )             Order block ( OB )            Higher time frame Order block / Point of Interest ( POI )    shown on current chart           Fair value Gap ( FVG ) / Imbalance   ,  MTF      ( Multi Time Frame )    Volume Imbalance     ,  MTF          vIMB Gap’s Equal High / Low’s     ,  MTF             EQH / EQL Liquidity               Current Day High / Low           HOD /
Dibuja automáticamente los niveles de soporte y resistencia MÁS los gaps de las velas de propulsión en su gráfico, para que pueda ver hacia dónde es probable que el precio se dirija a continuación y/o potencialmente retroceda. Este indicador está diseñado para ser utilizado como parte de la metodología de negociación de posiciones que se enseña en mi sitio web (The Market Structure Trader) y muestra información clave para la orientación y entradas potenciales. Hay 2 características PRINCIPA
Sacrament
owais_saadeh
4.91 (11)
Sacrament mt4- This is an indicator that includes the best basic forex indicators, without redrawing. Based on this data, a signal for sale or purchase is formed. It does not disappear anywhere after the signal, which gives us the opportunity to see the results on the history. It can be used on any currency pair, crypto metals, stocks It is best used on an hourly chart, but other periods are also acceptable. The best results for the period H1,H4,daily If customers have any questions, I w
Introduciendo       Indicador Quantum Trend Sniper   , el innovador indicador MQL5 que está transformando la forma en que identificas y negocias los cambios de tendencia. Desarrollado por un equipo de comerciantes experimentados con experiencia comercial de más de 13 años,       Indicador de francotirador de tendencia cuántica       está diseñado para impulsar su viaje comercial a nuevas alturas con su forma innovadora de identificar cambios de tendencia con una precisión extremadamente alta.
Day Trader Master es un sistema de comercio completo para comerciantes de día. El sistema consta de dos indicadores. Un indicador es una señal de flecha para comprar y vender. Es el indicador de flecha que obtienes. Le proporcionaré el segundo indicador de forma gratuita. El segundo indicador es un indicador de tendencia especialmente diseñado para usarse junto con estas flechas. INDICADORES ¡NO REPETIR Y NO TARDE! El uso de este sistema es muy sencillo. Solo necesita seguir las señales de flech
Otros productos de este autor
Market Steps MT4
Mahdi Ebrahimzadeh
5 (1)
El indicador Market Steps está diseñado y construido sobre la base de las correlaciones de tiempo/precio de Gann y optimizado por las reglas específicas de Price Action para el mercado de divisas. Utiliza los conceptos de flujo de órdenes del mercado para predecir las zonas de precios potenciales para un alto volumen de órdenes.  El Indicador de Niveles puede ser usado para operar por sí mismo o como una combinación para filtrar señales erróneas de otras Estrategias/Indicadores. Todo operador
Indicador convertido de otra plataforma que fue codificado por LuxAlgo. He añadido Moving Average tipo diferente también variedad de datos de origen. En la versión original la media móvil es SMA y la fuente de datos del mercado se reunió sólo desde el cierre de las velas.  En esta versión se puede seleccionar muchos tipos de medias móviles y también la fuente de datos como alta/baja/HL2/HLC/HLC2/.. . aquí hay algunos detalles del desarrollador original: El indicador Range Detector tiene
Indicator is converted from another programming language code by programmer " sbtnc ". MQL version is simplified to be more useful by less settings complexity.  There is some clues from programmer about indicator: The indicator tracks and reports the percentage of occurrence of daily tops and bottoms by the time of the day.  At certain times during the trading day, the market reverses and marks the high or low of the day. Tops and bottoms are vital when entering a trade, as they will decide if y
FREE
este código publicado originalmente por LuxAlgo de otro lenguaje de programación.  Tiene capacidades aceptables de Predicción de Tendencia que pueden ser utilizadas para muchos propósitos comerciales. aquí hay alguna descripción del generador de código: Este indicador se basa en los suavizadores de Nadaraya-Watson publicados anteriormente. Aquí hemos creado un indicador de envolvente basado en Kernel Smoothing con alertas integradas de cruces entre el precio y las extremidades de la envolve
MACD Bands
Mahdi Ebrahimzadeh
Producto se convierte de otra plataforma y original creado por TradeMaster Lite. Indicador básicamente utiliza el concepto de MACD, pero refuerza sus capacidades de diferentes tipos de técnicas de promediación. Es de gran alcance para la tendencia y la inversión de la identificación.  Aquí hay algunos detalles del propietario original: Presentamos un indicador MACD personalizable, con las siguientes características: Multi-marco de tiempo Bandas de desviación para detectar volatilidad inusua
Market Steps MT5
Mahdi Ebrahimzadeh
El indicador Market Steps está diseñado y construido sobre la base de las correlaciones de tiempo/precio de Gann y optimizado por las reglas específicas de Price Action para el mercado de divisas. Utiliza los conceptos de flujo de órdenes del mercado para predecir las zonas de precios potenciales para un alto volumen de órdenes.  El Indicador de Niveles puede ser usado para operar por sí mismo o como una combinación para filtrar señales erróneas de otras Estrategias/Indicadores. Todo operador
Filtro:
No hay comentarios
Respuesta al comentario