Angle Regression Line MT4
- Indikatoren
- Vladimir Gotsulenko
- Version: 1.40
- Aktualisiert: 31 Mai 2017
- Aktivierungen: 10
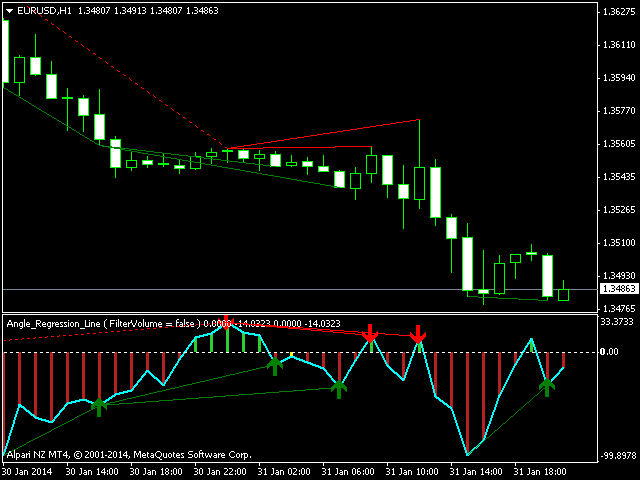
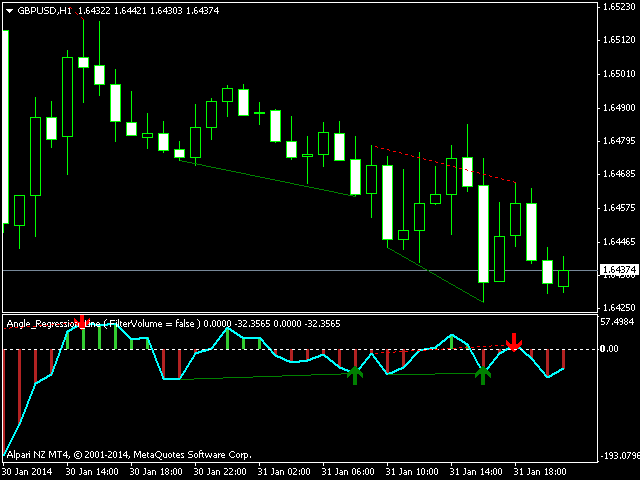
The indicator allows determining the strength and direction of the trend precisely. The histogram displayed in a separate window shows changes of the slope of the regression line. A signal for entering a deal is crossing the zero line and/or a divergence. The indicator is also useful for wave analysis.
Input Parameters:
- Period - period of calculation, 10 on default;
- Angle threshold - slope at which a flat is displayed, 6.0 on default (within the range from -6.0 to 6.0);
- Filter by volume - volume filter (divergence signals are not provided in case the volume is below average for the last 50 bars), true by default;
- Display divergence alert - enables notifications about divergence, true by default;
- Arrows displacement - shift of array of divergence signal, default is 5.0;
- Display cross zero alert - enables zero line crossover alert, true by default;
- Draw indicator trend lines - enables indicator trend lines in divergence; true by default;
- Draw price trend lines - enables displaying the trend lines on the price chart during divergence, true by default;
- Line bull divergence color - line color of bullish divergence, green by default;
- Line bear divergence color - line color of bearish divergence, red by default.
Currency pair - any. Timeframe - any.


I like this Indicator and use it since quite some time.