Handelsroboter und Indikatoren für den MetaTrader 4 - 43
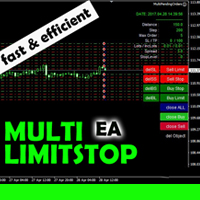
This EA is designed for automatic placing of pending orders (sell limit, buy limit, sell stop, buy stop) including Stop Loss & Take Profit levels (editable) with only one button click.
This EA can make order multi pending level / pending orders grid. So, with this EA placing pending orders will be faster, more accurate and more efficient.
Main Purposes Automation Pending orders grid style trading. Automation of the process of placing the Pending Orders: fast accurate efficient Automation of

Torakiki takes advantage from the only sure thing about Forex: price will move. It works 24/7 opening at any time two baskets, one in buy and one in sell. While the one that happened to be in the right direction keeps collecting profits, the other basket opens a grid with a clever recovery mechanism which closes positions one after the other as they reach their individual take profit in those usual bounces back you have even in the strongest trend formation, keeping track of the total profit
FREE
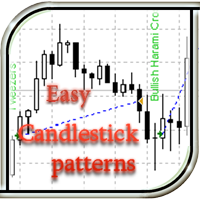
This EA recognizes candlestick patterns, opens trades depending on the last candlestick pattern, and also displays its name (when the ShowInfo option is enabled) directly on the chart of the currency pair. There are also additional indicators whose parameters are adjustable (for example, ADX volatility indicator, dynamic stop loss parameter, trailing stop). The EA can determine both simple models consisting of 1 candlestick, and complex ones from 2 to 5 candles. The simple version of this advise
FREE
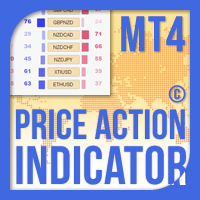
Der Price Action Indicator MT4 berechnet den Saldo der Kauf-/Verkaufskraft jedes Symbols/Instruments basierend auf reinen Price Action-Daten der angegebenen (standardmäßig 8) vergangenen Kerzen. Auf diese Weise erhalten Sie die bestmögliche Marktstimmung, indem Sie die Preisbewegung von 32 Symbolen/Instrumenten überwachen, die auf dem Indikatorfeld verfügbar sind. Ein Kauf-/Verkaufsstärke-Niveau von über 60% ergibt ein recht solides Niveau für den Kauf/Verkauf des spezifischen Symbols (bei Verw

The purpose of this new version of the MT4 standard indicator provided in your platform is to display in a sub-window multiple timeframes of the same indicator. See the example shown in the picture below. But the display isn’t like a simple MTF indicator. This is the real display of the indicator on its timeframe. Here's the options available in the FFx indicator: Select the timeframes to be displayed (M1 to Monthly) Define the width (number of bars) for each timeframe box Alert pop up/sound/ema
FREE

Do you like scalping? Th is indicator displays information about the latest price quotes received from the broker. [ Installation Guide | Update Guide | Troubleshooting | FAQ | All Products ]
Identify tick trends easily A blue row means the price has increased A red row means the price has decreased Customizable colors and font sizes Display your desired amount of rows The indicator is non-repainting
Parameters Rows: amount of rows with data to display in the chart Font size: font size of th
FREE

Moving Average Dashboard Bars ago is a unique multi currency, multi time frame dashboard. The dashboard is very simple. You select two moving averages, the instruments and timeframes The Moving Average Dashboard Bars ago then shows how how many bars ago the moving averages made a bullish or bearish crossover. It also shows you in real time when there is a bullish or a bearish crossover. The indicator plots in a subwindow. The Moving Average Dashboard Bars ago can be beneficial if you are trading
FREE

This is a forex supporting tool for all manual traders.
You can close positions immediately at once on the MT4 Terminal by a single click. CLOSE SELL: You can close SHORT positions of the target currency pair (same as the chart you’re using this EA). CLOSE BUY: Same as above but LONG positions will be closed. CLOSE ALL: All opened positions will be closed (no matter of currency pairs). You can select the closing method from CLOSE ALL or CLOSE ONE BY ONE. You can choose the positions to be close
FREE

25% off. Original price: $40 (Ends in May 15th) RSI Scanner is a multi symbol multi timeframe RSI dashboard that monitors Relative Strength Index indicator for price entering and exiting overbought and oversold in up to 28 symbols and 9 timeframes.
Download Demo here (Scans only M1 and M5) Settings description here MT5 version here
RSI Scanner features: Signals RSI entering and exiting the overbought and oversold zones. Monitors 28 customizable instruments and 9 timeframes at the same
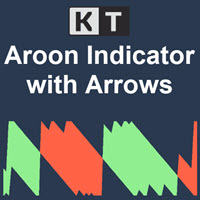
KT Aroon oscillator is the modified version of the original Aroon oscillator initially developed by Tushar Chande in 1995. It measures the time interval between the ongoing highs and lows and uses this deduction to calculate the market trend's direction and strength. It works on the notion that the price will form new highs consecutively during an uptrend, and during a downtrend, new lows will be formed. Buy Signal: When Aroon Up line cross above the Aroon Down line.
Sell Signal: When Aroon Do
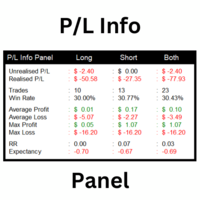
This utility shows various types of information on chart, controlled by many filters and option for each of them. If you want any custom feature or want to remove something from this product for your personal use. Please send me a personal message, I'll be happy to do so for you. Inputs and features explained: BG Color - Background color of the Dashboard
Text Color - Color of text info on the Dashboard
Border Color - Color of Border of the Dashboard Set Color on +/- Text - True/False o
FREE
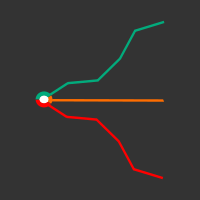
The Spread Ratio indicator allows you to view the ratio between the value of one instrument and another in order to operate with spread trading techniques.
In the image we can see an example of the Spread Ratio indicator on the Brent Oil and Crude Oil instruments. As we see from the image, the Spread Ratio indicator shows the trend of the ratio between these two instruments, allowing us to grasp the misalignments and realignments of the prices.
It is also possible to combine the Spread Rati

Broken Trends is an indicator for scalpers and intraday traders. The indicator selects and displays trend levels on the chart in the real time mode. The indicator reacts to price momentum: it starts searching for the trends as soon as the momentum amplitude exceeds the threshold set in a special parameter. The indicator can also play a sound when the price crosses the current trend line. In normal mode, the indicator shows only one (last found) upward and one downward trend, but there is an adva
FREE

MATrend indicator makes the directional trend of the current market easily recognizable. Settings: MA Period : The amount of candles taken into consideration for the calculation of the moving average; MA Method : The method used for the calculation of the moving average. Selectable methods are: Simple averaging;
Exponential averaging;
Smoothed averaging;
Linear-weighed averaging; Usage: The color of the indcator will change based on the slope of the MA. Green : The indicator has a bullish
FREE
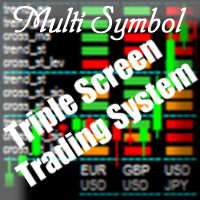
Purpose The indicator is intended for manual multi-currency trading based on the Triple Screen Strategy. It works with any symbols located in the Market Watch window of the MT4: currencies, metals, indexes, etc. The number of instruments can be limited by capacity of the МТ4's parameters. But if desired, you can create several windows with various set of instruments and parameters.
Operation Principle The indicator uses the modified Triple Screen Strategy for determining trend direction in the
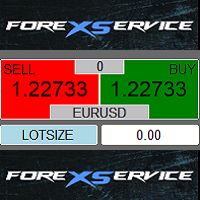
One Click Trader is a tool designed for MetaTrader 4 platform, which enables you to take your trading to the next level. It enables you to open, manage and close your trades in simple an efficient way by just one click of your mouse button. Up arrow minimizes the OCT panel Down arrow maximizes the OCT panel Right arrow displays the next panel with additional features Left arrow hides the panel with additional features Red SELL button enables you to open short market orders Red SELL STOP button e

This scanner shows the trend values of the well known indicator Parabolic SAR for up to 30 instruments and 8 time frames. You can get alerts via MT4, Email and Push-Notification as soon as the direction of the trend changes.
Important Information How you can maximize the potential of the scanner, please read here: www.mql5.com/en/blogs/post/718074
You have many possibilities to use the scanner. Here are two examples: With this scanner you can trade a top-down approach easily. If two higher t
Grid robot that maintains every open position opened by the trader. The buttons on the screen are used for opening the initial trade. The yellow labels display the price of total breakeven for each grid. The light blue labels display the level of total take profit for orders of each grid. The take profit is virtual. With each subsequent opened order the take profit of the grid is adjusted to get the total profit in the sum of the profit of the initial order, regardless of the size of all lots in

This is one of my first indicators. Slightly improved. The indicator is based on point and figure chart, but their period is equal to ATR indicator values. Parameters: ATRPeriod - ATR period for calculation of steps. XOPips - manual pararmetr, ATR ignoring. Note: The indicator uses closes price, thus it is recommended to consider completed bars. There is a more visual, with the display of lines on the chart and alerts, paid version of XOatrline
FREE

Mit dem SR Dashboard erhalten Sie ein mächtiges Werkzeug zur Kontrolle von einigen der wichtigsten Informationen im Trading. Stellen Sie sich ein Setup ganz nach ihrer Strategie zusammen und lassen sich informieren, sobald dieses Setup gültig ist. Vergeben Sie verschiedene Punkte auf ausgewählte Bedingungen. Wählen Sie aus Trend, Average Daily Range, Moving Averages, Pivot (Daily, Weekly, Monthly), Highs und Lows sowie Candlestick-Pattern. Hinweis: Dieser Indikator kann nicht im Strategietester

Ideenhändler (EURUSD M30)
Idea Trader ist ein vollautomatischer, professioneller Handelsroboter. Speziell für den Devisenmarkt EURUSD M30 entwickelt.
Dieser EA muss keine Parameter konfigurieren. Bereit, an EURUSD M30 zu arbeiten. Sie müssen sich nur noch für die Wahl des Loses entscheiden.
Dieser EA verfügt über einen intelligenten Algorithmus, der den Trend erkennt und Marktgeräusche herausfiltert. Der Experte erstellt Orders in Trendrichtung.
Input- und Output-Orders werden durch e
FREE
Dieser EA stellt verlorene Trades mithilfe eines sequentiellen und kontrollierten Martingals wieder her: Er platziert aufeinanderfolgende Trades mit zunehmender Losgröße, bis der ursprüngliche Trade wiederhergestellt ist, plus einem kleinen Gewinn. Es bietet ein komplettes, problemloses Handels-Framework, von der Verwaltung der ersten Trades bis zur Wiederherstellung. Bitte beachten Sie, dass der EA ein Martingal implementiert, was bedeutet, dass er Bilanzverluste hinzunehmen hat, die später wie
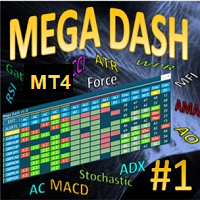
Create Unlimited Dashboards Each dashboard can be upto 28 Symbols x 24 Indicators. Mix and match from 23 leading indicators and all timeframes, to create unlimited unique dashboards. Create Group Alerts to be alerted when your chosen indicators are all aligned.
32 customizable trading strategy alerts (Trend, Breakout, Overbought, Oversold, Thresholds, Saucers etc). Scalper, Day or Long Term Trader? Mega Dash has you covered, design your dashboard to suit your trading style. Mega Dash is proba
POSITION SIZE CALCULATOR EASY As the name suggests it is the most easy-to-use position size calculator available on the market. this indicator calculates the lot size within a fraction of a second and the best part is that it is very flexible and easy to use. you can use money or percentage to calculate the lot size. you can use equity or balance to calculate the lot size.
FREE
Dieser EA verwandelt Ihre verlorenen Trades mithilfe der Mittelung in Gewinner. Sobald Ihr anfänglicher Trade in den negativen Bereich übergeht, wird der Wiederherstellungsmechanismus in festgelegten Preisintervallen aufeinanderfolgende Marktaufträge in die gleiche Richtung ausführen und platzieren, die alle mit einem kombinierten Gewinn oder einer annähernden Gewinnschwelle abgeschlossen werden. Dieser Mechanismus ist mit den NFA / FIFO-Regeln kompatibel und wird von US-Brokern akzeptiert. [ B

Point Trend Indicator – Ein Indikator für das obere und untere Niveau des Trends, der die Trendrichtung bestimmen und seine Verstärkung anzeigen kann. Die Trendrichtung wird durch runde Punkte bestimmt; liegen die Punkte über der Nulllinie, ist der Trend bullisch, liegen sie darunter, ist der Trend bärisch. Die Zunahme der Richtungsbewegung wird durch Pfeile angezeigt. Es gibt den einzigen Parameter zur manuellen Anpassung – die Dauer der Trendrichtung.
Möglichkeiten
Funktioniert in allen

Never miss a trend change again! This indicator uses various calculation methods based on price action to detect changes in the direction of the trend. It can be used on high timeframes (from H1 to D1) and is most suitable for H4 and Daily timeframe. This indicator is compatible with all broker symbols (forex, indices, CFD, commodities, crypto…). It is also possible to open the indicator on several charts to follow several symbols at the same time. In addition, you don't have to stand by your P
FREE

Currency Correlation Plus is an expensive version of the indicator. It is equipped with the signal and is more equipped than its cheaper brother. The indicator helps us understand and see a correlation. Second chart makes it easy to analyze and trade multiple currencies. On the chart, you can post multiple pairs. Type in the selected currency pair in the settings and add it to the chart.
If you want to have another tool, see another product: https://www.mql5.com/en/market/product/13392
Inputs
How To Trade
Execute your trades in 3 Easy Steps!
Step 1: Trade Setup Entry Buy in Signal Arrow color DodgerBlue. Entry Sell in Signal Arrow color RED. Success Rate ≥ 75% 100:25 Step 2: Set Stop Loss Stop loss BUY ----> You can set stop loss on Line RECTANGEL color DodgerBlue. Stop loss SELL ----> You can set stop loss on Line RECTANGEL color RED. Step 3: Set Take Profit Take profit BUY on RECTANGEL color RED. Take profit SELL on RECTANGEL color DodgerBlue. Strategy SIMPLE Day trading / Swi
FREE
The "Open grid of pending orders" script is designed to automate the process of creating buy (Buy) and sell (Sell) orders on the MT4 trading platform. It provides the user with the ability to set the distance between orders and the number of orders in this grid. This script allows traders to quickly build a grid of orders that covers a specific price range. The main functions of the script include: Ability to select the direction of orders: Buy (purchase) or Sell (sale). Setting the distan
FREE

The recommended timeframe is H1!
The indicator has two kinds of signal.
This is a signal to open a position from the appearance of an arrow. The price leaves the channel In the first case, the indicator builds arrows based on the constructed channel and Bollinger Bands years.
In another case, the trader can trade if the price just went beyond the channel. If the price is higher than the channel - we sell. If the price is lower than the channel, then you can look for a place to buy.
It ca
FREE

FREE TopClock Indicator: This indicator is an Analog Clock That Shows: Local Time Of Pc or Time Of Broker Server or sessions(Sydney -Tokyo London -NewYork)Time or custom Time( with GMT -Base) this can shows Candle Time Remainer with Spread live. You can run this indicator several times for different times and move it to different places on the chart. If you would like, this indicator can be customized for brokers and their IB based on customer needs. For more information contact us if you
FREE
It is based on Surfing strategy. USES MARTINGALE. The EA catches the moments when the previous candle crosses the moving average indicator and eliminates the false breakouts using the RSI+MA indicator, and at the same time analyzes the trend direction. The EA trades pending orders, which also allows to avoid false movements. If the pending order was not triggered and the chart reversed, then the EA deletes the pending order. If the pending order was not triggered and the chart reversed, then the
FREE

Search for an entry with low risk for trading by Lisek Waves Indicator. Using Lisek Waves Indicator can improve your trading performance. In it’s simplest form, this trading tool make it easy to s earch for an entry with low risk and to manage your trade and risk. Lisek Wave analysis is based on the notion that markets follow specific patterns called waves which are the result of a natural rhythm of crowd psychology that exists in all markets. You can avoid the loss from taking trades that are
FREE

Now there is no need to check volatility on third-party websites in order to determine the average movement rage of a certain currency pair. The Truly Volatility indicator is designed for determining volatility for the specified period and is displayed in a separate window as a histogram and line. If attached to a chart with the Н1 timeframe, the indicator displays the average price movement for each hour (from 0 to 23) based on the history data. On the D1 timeframe it displays the average movem
FREE

Supreme Direction is an indicator based on market volatility , the indicator draws a a two lined channel with 2 colors above and below price , this indicator does not repaint or back-paint and signal is not delayed. how to use : long above purple line , short below golden line. Parameters : channel period ========================================================
FREE

Suitable for multi time frame market direction prediction. Green and red color indicate the buy and sell call respectively. Green indicator is denote buy call and Red indicator denote the sell call. push notification is available to send instant message to you when green or red indicator will be appear. you have to activate the option at the time of mapping this indicator to you chart
FREE

Auf-Ab-Trend – bestimmt den Trend selbst. Die korrekte Erkennung des Trends bestimmt 95 % der Handelseffizienz. Und wenn ein Händler die Trendrichtung immer genau bestimmt, muss er nur auf Korrekturen in Trendrichtung und offene Geschäfte warten. Bei jeder Handelsstrategie müssen Sie den Trend richtig erkennen. Wenn der Trend nicht richtig definiert ist, kann der Händler nicht effektiv in den Markt eintreten und das Handelsergebnis wird höchstwahrscheinlich negativ sein. Der Up Down-Trendindika
Paracel EA is an advanced and fully automated Expert Advisor designed to help traders navigate the complexities of the financial markets. Using a sophisticated strategy based on the Supertrend indicator and another built-in indicator, Paracel EA can analyze market conditions and identify trading opportunities with remarkable precision. The EA is equipped with a range of powerful features, including martingale functions, to help maximize profits and minimize risks. Whether you're a seasoned trad
FREE
Tipu Panel series is set of innovative indicators created to consolidate indicators in form of a panel. As a trader, indicators can easily create a cluster on the chart and distract you from the bigger picture. It can also be overwhelming and visually exhausting. Tipu Panel simplifies this by displaying each indicator in a beautifully boxed panel. You can customize the panel to display indicator signals for multiple time frames and also to quickly switch time frames. There are two types of indic
FREE

Features of this EA Request to donate 10% of Profit to all users in my paypal account @priyankald You can reach me on Telegram at t.me/chittaranjankld for purchage source code only. This Type of EA sold in this market more than 300 USD, But as a genuine programmer I have make it free for all users. Source Code @ 150 USDT . This is fully Automated Trading Robot / Expert Advisor for MT4. This EA can give good performance on EURUSD & GBPUSD etc. The Buy Stop order place at 1 hours high p
FREE

Indicator overview Trend indicator usage Moving averages. Highest quality alerts that need no introduction. It is completely loyal to the original algorithm and uses other useful features.
Easy to trade Carry out all kinds of notifications It's not a new paint and it's not a back paint. Setting Indicator SMA50 in Time frame H1 for any pair currency and Gold Spot. EMA200 in Time frame H1 for any pair currency and more than EMA250 for Gold spot. Using it for maximum benefit Set up notificatio
FREE

Simulator for Risk / Reward ratio calculator We-RiskReward is a MT4 indicator made by the We-Trading team to simulate an order with Risk / Reward calculator.
Horizontal Lines This indicator show you 3 horizontal lines that are: Open line Take Profit line Stop Loss line You can move the lines and you will see R/R and Lots calculation in real time. You can use it to simulate Long and Short positions.
Indicator parameters As input parameters you need to check only the Risk for trade. For e.g. y
FREE

Momentum channel is a simple momentum based system yet with a great degree of accuracy in detecting turning points. The market momentum are defined by Average True Range Channels . When price breaks these channels most times , it is an indication of a shift in market momentum and thus a possible new trend formation. The system can be traded on any time frame and symbol and can also be used to trade commodities and stocks.
INPUT MENU ATR_Period : Average True Range Momentum Period
ATRMultip :
FREE

Der beste Forex-Scanner, den ich je erstellt habe.
Mit einem Klick haben Sie die Kontrolle über alle 28 Geldwechsel.
Mit diesem Indikator haben Sie die vollständige Kontrolle über Ihren Forex-Handel.
Sie können sehen, was an allen 28 Geldbörsen gleichzeitig passiert.
RSI
ATR
GLEITENDER DURCHSCHNITT
STOCHASTISCH
MACD
Dieser Scanner zeigt Ihnen anhand des von Ihnen ausgewählten Indikators an, ob die Märkte bullisch oder bärisch sind.
Sie können die Werte jedes Indi
FREE

Perseus is a free Expert Advisor for GBPJPY . It based on MACD and Bollinger Bands . It has been tested for 10 years of history (from year 2011). Tested by Monte Carlo with 200 simulations too. All trades are cover by StopLoss . Doesn't use Martingale or other dangerous startegies. Perseus using fixed lot size, which you can set in settings. Perseus settings are optimized for the best results . There is no need to change it.
Recommendations Symbol: GBPJPY Timeframe: H1 Deposit: 300 USD B
FREE

The MT4 indicator that we are describing is designed to provide traders with an alert, notification, and email when Fibonacci levels are crossed. The Fibonacci levels are calculated based on the zigzag indicator, which helps to identify potential trend reversals in the market. When the indicator detects that a price has crossed a Fibonacci level, it will trigger an alert and send a notification to the trader's MT4 mobile app. Additionally, the indicator can be configured to send an email to the
FREE

This is a unique tick chart indicator for MetaTrader 4 platform. The software is capable to graphically display the last 100 ticks and in addition to that it displays the current spread, bid / ask and time values in an elegant IceFX style dashboard. The indicator is an efficient tool for traders using M5 or even M1 timeframe.
Indicator parameters: Corner - corner of panel CornerXOffset - horizontal offset from the corner CornerYOffset - vertical offset from the corner ChartType - type of cha
FREE

Ska ZigZag Line indicator determines the overbought and oversold regions within a trend. The indicator determines the overbought region by the candlestick high and the oversold region by the candlestick low in a form of a line. To utilize the full strategy i recommend using "Ska ZigZag Line" together with "Ska ZigZag BuySell". NOTE: This indicator is a line based indicator. HOW TO USE: Sell Signal; Place a sell trade when the Ska ZigZag BuySell indicator arrow appear on top of the Ska ZigZag Lin
FREE
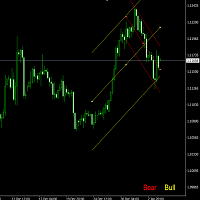
This indicator judges current trend, with Linear regression and the angle. Each parameters setting contents below. Period Period from current
Angle The angle of judging the trend
Width of Lines Width of Linear regression lines* Font size Font size of display text
Lines&Text colour Colour of display lines and test
* This parameter judges that if lines spreads too wide, there is no trend.
FREE

This is a utility to allow you to quickly add and remove Elliot Wave numbers and letters to your charts allowing you to plot the main and sub Elliot waves for easy chart analysis. Please note, this is not an Indicator that adds the characters automatically, it is a utility to manually add them yourself with ease.
Elliot Characters and Buttons on screen: 0,1,2,3,4,5 A,B,C i,ii,iii,iv,v a,b,c Delete Input Parameters: Colors Font Size Font Type This is a free utility for MT4 only Check out
FREE
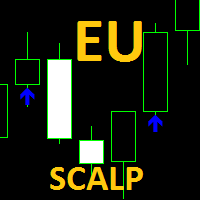
Scalping-Indikator mit Warnungen:
Der EU Scalp Indikator ist eine Kombination aus zwei Arbeitssätzen , der erste ist so voreingestellt , dass er gegen die Richtung der Preisbewegung arbeitet und der zweite arbeitet auf die Richtung der Preisbewegung , basierend auf der Wahrscheinlichkeit von Preisschwankungen oder Ausbrüchen , die bei auftreten wichtige Handelsstufen.
Die Standardeinstellungen sind für das EurUsd-Paar M5 Timeframe optimiert, weitere Einstellungen finden Sie im Abschnitt "Ko
FREE

Channels indicator does not repaint as its based on projecting the falling and raising channels. As a trader you need a path to be able to place your buy and sell trades such as: Supply and Demand , Falling & raising channels. Falling and raising channels can be in any time frame and also can be in all time frames at the same time and the price always flows within these channels. Experienced trades will draw the key levels and channels around the timeframes. But, they will not be able to draw
FREE

The trading strategy bases on MACD signal and confluence of trends on multiple time frames. It supports martingale, smart trade and many options so that you can setup their own trading strategy from the basic one. Look for new idea, improve trading performance by yourself without limitation.
Outstanding Features Martingale trading : turn on/off martingale strategy. When you find out a parameter set which has a small value of maximum continuous loss, you can consider to turn on martingale mode
FREE

This indicator is the basis for an Expert Advisor that can be categorized as "almost Grail". See details below. This indicator displays the projection of the Renko chart on the price chart. This projection is displayed as a stepped line, not as "bricks" (rectangles). See slides 1 and 2. Abbreviated name of the indicator: LRC – L ine of R enko on the price C hart. The principle of its construction is very simple. First, a grid of horizontal lines (levels) is bu
FREE

Have you ever wondered why so many Forex traders get trapped in weak positions on the wrong side of the market? One of the easiest ways the market makers do this, is by using volatility. A currency pair moves suddenly, often on a news release or economic data. Traders jump in, expecting some quick and easy profits, but the move suddenly moves in the opposite direction. This happens in all timeframes, and in all currency pairs. The candle or bar closes, with a wide spread, but then reverses sharp

Forex Trade Manager Grid MT4 helps you to managing orders and achieve the goal. You only need to place first order with Take Profit, run EA and set in params profit (pips) you want to get. EA will be managing your positions, as will gather appointed amount of pips. It’s a strategy for management of manual trades opened on current pair. The strategy adds positions to currently opened trades in a grid management (with chosen distance in pips between trades) - up to 15 trades (or less). First up to
FREE

Indicador "Heikin Ashi Master" para MetaTrader: Transforma tu Análisis con Velas Japonesas Suavizadas El indicador "Heikin Ashi Master" es una herramienta innovadora diseñada para traders que buscan una perspectiva única del mercado a través de las Velas Japonesas. Compatible con MetaTrader, este indicador suaviza la acción del precio, ofreciendo una interpretación simplificada y visualmente atractiva de las tendencias y cambios en el mercado. Características Destacadas: Suavizado de la Acción
FREE
Highly configurable RSI indicator. Features: Highly customizable alert functions (at levels, crosses, direction changes via email, push, sound, popup) Multi timeframe ability Color customization (at levels, crosses, direction changes) Linear interpolation and histogram mode options Works on strategy tester in multi timeframe mode (at weekend without ticks also) Adjustable Levels Parameters:
RSI Timeframe: You can set the current or a higher timeframes for RSI. RSI Bar Shift: you can set
FREE

Currency RSI Scalper -ist ein professioneller Indikator, der auf dem beliebten RSI-Indikator (Relative Strength Index) basiert. Obwohl der stochastische Indikator für ein Intervall des Marktes gut funktioniert, erzeugt er keine profitablen Signale, wenn sich die Marktbedingungen ändern, und erzeugt daher falsche Signale, was zu großen Verlusten führt. Haben Sie jemals über einen adaptiven stochastischen Indikator nachgedacht, der sich an die Marktbedingungen anpasst? Der vorgestellte Indikator i

Kleiner kostenloser Indikator zum Erkennen bestimmter Chartmuster, Schulter-Kopf-Schulter / Rückwärts, Dreifach oben / unten, Tasse, Flaggen und andere ... Ich habe es vor einiger Zeit entworfen, es erkennt Zahlen in m1, m5, m15, m30 und h1.
Ich hoffe, es wird Ihnen nützlich sein, weil ich nicht viel mit diesem Indikator handele, ich habe ein paar andere, die ich versuchen werde, schnell online zu stellen, vielleicht finden Sie es nützlich, gute Handelsfreunde.
FREE
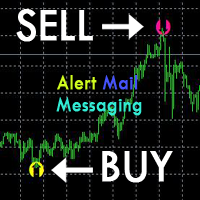
[ZhiBiZZD_MT4] Der Indikator ist für alle Zyklen geeignet und für alle Marktsorten geeignet.
[ZhiBiZZD_MT4] Der Abwärtspfeil ist das Signal von (Verkaufen).
[ZhiBiZZD_MT4] Der Aufwärtspfeil ist das Signal von (Buy).
[ZhiBiZZD_MT4] kann in den Parametern (Alarm, E-Mail senden, Benachrichtigung senden) eingestellt werden, auf (true) gesetzt werden, um sofortige Signale an das Alarmfenster, E-Mail und Instant Messaging zu senden.
Parametereinstellungsbeschreibung:
[alert_NO_OFF]: Dies ist

The indicator has combined 5 popular strategies. Draws an arrow after confirming a signal for the selected strategy. There are signal alerts. Doesn't redraw its values. I recommend watching my advisor - Night Zen EA
5 strategies. The main line crosses the signal line. The main line crosses the signal line in the oversold (for buy) / overbought (for sell) zones. The main line enters the oversold (for sell) / overbought (for buy) zones . The main line comes out of the oversold (for buy ) / ove
FREE

The indicator displays two Moving Average lines on the chart with parameters specified in the settings. It issues a signal in the form of arrows and a sound at the intersection of these Moving Average. In the indicator settings, you can set the period of fast Moving Average ( Fast MA Period ) and slow Moving Average ( Slow MA Period ). And also Shift, Applied Price, Method and Timeframe for two Moving Averages separately. Important:
The main difference from oth
FREE
MT5 Version Available Here: Coming soon...
Telegram Channel & Group : https://t.me/bluedigitsfx
V.I.P Group Access: Send Payment Proof of any of our Paid Products to our Inbox
Recommended Broker: https://eb4.app/BDFXOsprey * The Most User Friendly Symbol Changer on Metatrader ! Features
Change Timeframes in 1 click of a button on 1 chart. Change Between All Currency Pairs in 1 Click of a button on 1 chart. Ability to Turn Boxes to Current Candle Colors. Easily Identify the Trend f
FREE
The IT Moving RSI EA is a cutting-edge tool designed to empower traders with deep insights into market trends and price movements. This expert advisor is a powerful ally for both novice and experienced traders, offering the ability to make well-informed decisions by harnessing the combined power of moving averages and the Relative Strength Index (RSI). Whether you are starting your trading journey or are a seasoned trader, this EA is a must-have addition to your trading arsenal. Join our telegr
FREE
Советник "RSI and MA filter" торгует по индикатору RSI, использует фильтр в качестве двух средних скользящих (быстрая MA выше медленной MA - покупка, продажа - наоборот), по желанию Пользователя применяется мартингейл (количество умножения лота при серии убытков ограничивается), безубыток, трейлинг стоп, инвертирование сигнала. Настройки советника: Индикатор RSI: RSI_Period = 14; используемый период индикатора
RSI_Shift = 1; номер свечи выбранного графика, с которой советник берет сигнал, 0 -о
FREE

Close all open orders, delete all pending orders, and clear the entire account's orders. Please use caution! After clicking the button, the account order will be 0! Help us quickly clear account orders! As it is a free version, only the function of closing all orders is available. If other functions are needed, customization is required! The paid version has more features!
FREE

Donchian通道(唐奇安通道指标)是用于交易突破的最古老、最简单的技术指标之一。 一般来说,唐奇安通道的宽度越宽,市场波动就越大,而唐奇安通道越窄,市场波动性也就越小 。此外,价格走势可以穿过布林带,但你看不到唐奇安通道的这种特征,因为其波段正在测量特定时期的最高价和最低价。 交易实用必备工具指标 波浪自动计算指标,通道趋势交易 完美的趋势-波浪自动计算通道计算 , MT4版本 完美的趋势-波浪自动计算通道计算 , MT5版本 本地跟单复制交易 Easy And Fast Copy , MT4版本 Easy And Fast Copy , MT5版本 本地跟单复制交易 模拟试用 Easy And Fast Copy , MT4 模拟账号运行 Easy And Fast Copy , MT5 模拟账号运行 唐奇安通道指标计算: 唐奇安上阻力线 - 由过去N天的当日最高价的最大值形成。 唐奇安下支撑线 - 由过去N天的当日最低价的最小值形成。 中心线 - (上线 + 下线)/ 2 唐奇安通道信号 唐奇安通道常用作突破指标。它提供了两种主要类型的突破信号,一个是上阻力线或下支撑线
FREE

EXTREME PRICE ACTION DASHBOARD
Make your trades professionally using advanced statistics and price action. Manages 29 pairs simultaneously. It has Buy and Sell buttons, close buy and close sell separately for each pair. Stop Gain and Stop Gain programmable in Pips automatically. Dynamically calculates 5 regions where statistically the most assertive sales and 5 more assertive shopping regions are found. Indicates the total lots, buy balance and sell balance for each pair. Change the graph's
Ist Ihnen bekannt, warum der MetaTrader Market die beste Plattform für den Verkauf von Handelsstrategien und technischer Indikatoren ist? Der Entwickler braucht sich nicht mit Werbung, Programmschutz und Abrechnung mit Kunden zu beschäftigen. Alles ist bereits erledigt.
Sie verpassen Handelsmöglichkeiten:
- Freie Handelsapplikationen
- Über 8.000 Signale zum Kopieren
- Wirtschaftsnachrichten für die Lage an den Finanzmärkte
Registrierung
Einloggen
Wenn Sie kein Benutzerkonto haben, registrieren Sie sich
Erlauben Sie die Verwendung von Cookies, um sich auf der Website MQL5.com anzumelden.
Bitte aktivieren Sie die notwendige Einstellung in Ihrem Browser, da Sie sich sonst nicht einloggen können.