und werden Sie Mitglied unserer Fangruppe
Veröffentliche einen Link auf das Skript, damit die anderen ihn auch nutzen können
Bewerten Sie es im Terminal MetaTrader 5
- Ansichten:
- 771
- Rating:
- Veröffentlicht:
- 2016.03.21 15:27
- Aktualisiert:
- 2016.11.22 07:34
-
Benötigen Sie einen Roboter oder Indikator, der auf diesem Code basiert? Bestellen Sie ihn im Freelance-Bereich Zum Freelance
Urheber: Andrey N. Bolkonsky
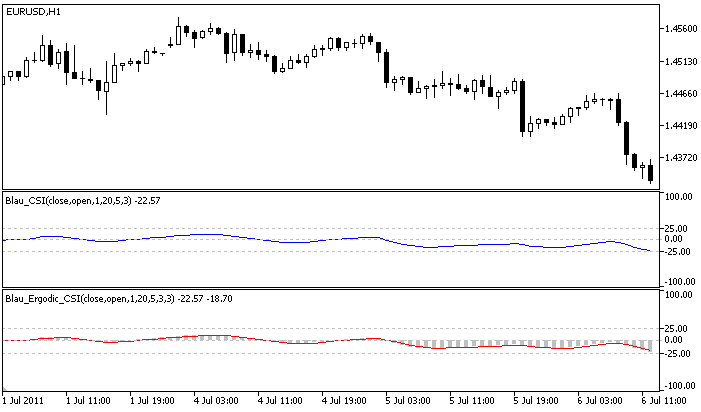
Der Ergodic CSI Oscillator (basiert auf dem Candlestick Index) wird in dem folgenden Buch von William Blau beschrieben "Momentum, Direction, and Divergence: Applying the Latest Momentum Indicators for Technical Analysis".
- Die Datei WilliamBlau.mqh muss in das folgende Verzeichnis kopiert werden: terminal_data_folder\MQL5\Include\
- Die Datei Blau_Ergodic_CSI.mq5 Muss in das folgende Verzeichnis kopiert werden terminal_data_folder\MQL5\Indicators\

Ergodic CSI-Oscillator von William Blau
Berechnung:
Der CSI Oscillator wird wie folgt definiert:
Ergodic_CSI(price1,price2,q,r,s,u) = CSI(price1,price2,q,r,s,u)
SignalLine(price1,price2,q,r,s,u,ul) = EMA( Ergodic_CSI(price1,price2,q,r,s,u) ,ul)
wobei:
- Ergodic_CSI() - Erogic line - Candlestick Index CSI(price1,price2,q,r,s,u);
- SignalLine() - Signal Line - EMA(ul), angewendet auf Ergodic;
- ul - Periode der Signallinie.
- graphic plot #0 - Ergodic Line (Candlestick Index):
- q - Anzahl der Bars die für die Kalkulation des Candlestick Momentums benutzt werden (Standard q=1);
- r - period of the 1st EMA, angewendet auf Candlestick Momentum (by default r=20);
- s - period of the 2nd EMA, angewendet auf result of the 1st smoothing (by default s=5);
- u - period of the 3rd EMA, angewendet auf result of the 2nd smoothing (by default u=3);
- graphic plot #1 - Signallinie:
- ul - period of a Signal Line, EMA(ul) is angewendet auf Ergodic (by default ul=3);
- AppliedPrice1 - Kurstyp (Standard AppliedPrice1=PRICE_CLOSE);
- AppliedPrice2 - Kurstype (Standard AppliedPrice2=PRICE_OPEN).
- q>0;
- r>0, s>0, u>0. Wenn r, s or u = 1 sind, dann wird die Glättung nicht verwendet;
- ul>0. Wenn ul=1 ist, dann sind die Signallinie und die Ergodic-linien identisch;
- Min. rates = (q-1+r+s+u+ul-4+1).
Übersetzt aus dem Russischen von MetaQuotes Ltd.
Originalpublikation: https://www.mql5.com/ru/code/381
 Ergodic CMI-Oscillator Blau_Ergodic_CMI
Ergodic CMI-Oscillator by Willam Blau.
 Candlestick Index Blau_CSI
Candlestick Index (CSI) Indicator von William Blau.
 Composite High/Low Momentum Blau_HLM
Composite High-Low Momentum Indicator von William Blau.
 Directional Trend Index Blau_DTI
Directional Trend Index (DTI) Indicator von William Blau.