适用于MetaTrader 5的EA交易和指标 - 57

Indicator basic idea is buy strong currency and sell weak currency. If A/B currency pair is in an uptrend, it shows if it is due to A strength or B weakness.On these signals one can choose the most optimal pair to trade. You can use Currency Power System for pattern trading as well, among basic patterns which can be used are: cross trend break divergencies So much for theory. I searched for a ready-made indicator (Currency Strength) to support my trade but did not find one. Well. I have to wr

This indicator was developed to support multiple timeframe analysis. In the indicator settings, the user can set the color, width, and style of the horizontal lines for each timeframe. This way, when the horizontal lines are inserted into the chart, they will be plotted with the timeframe settings.
MTF Lines also allows visibility control of another objets like rectangles, trend lines and texts.
This is a product developed by Renato Fiche Junior and available to all MetaTrader 4 and 5 users!

The RealCryptoLevels indicator by downloading the order book of crypt exchanges with maximum depth shows horizontal volumes of popular crypto currencies on the chart, so you can see not only the volumes, but also the levels and them strength (see screenshots), which is very important for successful trading in all strategies from scalping to medium-term trading, because you can see the preferences of buyers and sellers at the moment and their mood for the future. The indicator pulls volume data
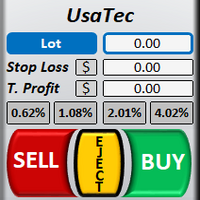
Welcome to TradeX Chart Trading
This utility allows you to send orders quickly and easily. With it you can operate directly from the chart using the shortcut keys SHIFT to buy and CTRL to sell. It is also possible to set Stop Loss and Take Profit, in price or points, directly on the TradeX. Use one of the four risk options (0,5%, 1,0%, 2,0% or 4,0%) to get the pending order volume according to the size of the last closed candlestick and the account balance. Once positioned, it offers Breakeven

UPDATE MAR/20 OBS: Please after purchase contact US via CHAT to suport. This Product is a Market Scanner based on Didi Index Indicator. He can scan all time frames of Symbols in Market Watch, client can customize according the demand, its can scan a single symbol or more than 100.
Manual: Link Driver Link do Manual Video: LINK The Scanner informs 4 kind of signals, all alerts are providing from Didi Index Indicator:
1 - Didi Index - Alert of Buy : Cross up of "Curta" short moving averag

Highly configurable Relative Vigor Index (RVI) indicator.
Features: Highly customizable alert functions (at levels, crosses, direction changes via email, push, sound, popup) Multi timeframe ability ( higher and lower timeframes also) Color customization (at levels, crosses, direction changes) Linear interpolation and histogram mode options Works on strategy tester in multi timeframe mode (at weekend without ticks also) Adjustable Levels Parameters:
RVI Timeframe: You can set the lower/highe
FREE

Midpoint Bands is a channel-like indicator that draws two lines on the chart - an upper band and a lower band, pointing out possible reversal levels.
This is one of the indicators used in the Sapphire Strat Maker - EA Builder.
Sapphire Strat Maker - EA Builder: https://www.mql5.com/en/market/product/113907
The bands are simply calculated like this:
Upper Band = (HighestHigh[N-Periods] + LowestHigh[N-Periods])/2 Lower Band = (LowestLow[N-Periods] + HighestLow[N-Periods])/2
FREE

OneClickClose-Pro EA allow users to easily close all positions at once with multiple options with simple UI.
Options Includes::
1. Close All Positions
2. Close All Buy Positions
3. Close All Sell Positions
4. Close All Position GreaterThan or Equal to Profit
5. Close All Position LessThan or Equal to Profit
6. Close All Position By Symbol
7. Option to Set Deviation
8. Option to Set Maximum Retry (If position close fails)
FREE

Что такое OsMA DA? Индикатор OsMA DA – это осциллятор, который построен на показаниях другого осциллятора – MACD. OsMA DA показывает расхождение между сигнальной линией MACD и его гистограммой. Момент пересечения гистограммы и линии – это нулевая отметка OsMA. Если гистограмма MACD поднимается выше линии, то гистограмма самого OsMA DA поднимается выше нулевой отметки. В обратной ситуации OsMA DA демонстрирует отрицательные значения. OsMA DA более узконаправленный индикатор, чем MACD. OsMA
FREE

This long-term trading system works on 9 pairs and timeframe. The Expert Advisor uses various trading systems, such as trend trading, counter-trend trading and others. The EA has the built-in smart adaptive profit taking filter. The robot has been optimized for each currency and timeframe simultaneously. EA uses economic news. No martingale, grid and other risky strategies. EA uses timeframes:
MetaTrader 4 MetaTrader 5 M5, M15, M30, H1 M2, M3, M4, M5, M6, M10, M12 , M15, M20, M

The underlying strategy of this indicator is based on identifying momentum in the market and attempting to capture the direction of the trend through transitions between bullish and bearish moments. Utilizing bands around the RWMA allows for identifying potential overbought and oversold situations in the market.
1. Calculation of the Range Momentum Index (RMI): The RMI is based on a combination of the Relative Strength Index (RSI) and the Money Flow Index (MFI), both of which are momentum ind
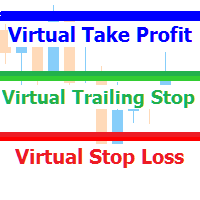
A utility for managing open positions using virtual (invisible to the broker) stops. Virtual stop loss and virtual take profit can be freely moved around the chart. If the price touches the virtual stop line (TP, SL, TS), the EA will close all orders of the same direction on the current chart. Closing orders by virtual take profit is possible only if there is a profit.
With the help of the built-in trading simulator, you can, in the strategy tester, see how the adviser works. Parameters Block

Taka Taka Scalper Pro is a simple expert advisor that can be configured according to moving averages signals, such as triple, double or exponential moving average . Trigger signals are configured when these averages crosses. Besides, there is a important ATR filter to trade only on such volatility. A trend filter can also be configured according to averages. Takeprofit and stoploss are calculated according to ATR multiplier , even for long or short trades. You can also configure a non scalper mo

Time Closer 可以幫助您在指定的時間“每天”關閉所有未平倉單。
主要適用於不想持單過夜, 不想持單在 不同交易時段 , 不想持單在 特定時間內 。
使用非常簡單
用法 1. 下載並拖動 Time Closer 在圖表上 (圖表符號應與您希望平倉的圖表符號相同) 2. 選中“允許自動交易”為“開” 3. 設定參數
輸入參數 Turnon True - 啟動 Time Closer False - 關閉 Time Closer Close All Open Position Time (Server Time) - 設定指定時間 (交易商平台伺服器時間) , 在 指定時間把 所有未平倉單平倉
Time Closer can help you closing all the open position at the specified time "Everyday". Mainly for Day trader that don't want to hold position overnight, or over different session
This EA trades with the trend using several methods to identify and enter a trade. For example, it uses trendlines, Gator and Stochastic indicators to analyze the market. In addition to trading, it can also display trend lines that it trades based on. It has filters for ADX and MA indicators, as well as a sufficient number of settings to be able to optimize on various currency pairs and timeframes.
The EA sets stop loss and take profit for each trade, does not have risky trading methods. It i

Introducing Backtest Simulator , an essential Expert Advisor designed to help you thoroughly test your trading strategies using historical data. Unlike the standard Strategy Tester in MetaTrader 5 , Backtest Simulator provides a user-friendly graphical interface that allows manual control over trades and positions within the Strategy Tester . The Strategy Tester in MetaTrader 5 lacks the capability for manual trade execution , limiting your ability to open orders manually, set pending orders, o

Functional in the Forex market. Functional in the B3 market - Bolsa Brasil Balcão.
Motivation The technical Fibonacci retraction indicator for many is essential and the basis for all market movement forecasts. The name of the tool comes from the Italian mathematician Leonardo de Pisa (13th century).
This DEMO version will work in Meta Trader with Demo and Strategy Tester.
To purchase the Full version that works on a Real account, click on: https://www.mql5.com/en/market/product/38089
FREE

Trend Line Finder will project forward a support and resistance lines using 2 previous highs for resistance and 2 previous lows for support. It will then signal to the trader by alert making the trader more aware that a possible good move is about to happen. This is not a stand-alone trading system but is very useful in finding key areas of support resistance levels where price will usually either rebound from or breakthrough. Its down to the trader to decide what to do with use of other s

Based on two MA line indicators.
Looking at the histogram, if the value is greater than 0, the uptrend will increase, the bigger the value, the stronger the uptrend will be and vice versa, if the value is less than 0, the downtrend will decrease, the smaller the value, the stronger the downtrend . The necessary condition when entering a buy order is that the first histogram is greater than 0 and the current candle is closed, and enter the order when the second histogram appears. The necessary
FREE
Helper utility that does the following important actions: Shows or hides various groups of symbols - Forex, CFD, Futurex, Bonds and all others. Shows or hides symbols that have or do not have trade restrictions. Shows or hides symbols that currently have a trading/quoting session active. Shows or hides symbols that contain the specified words in their names. Closes or deleted all market or pending orders. Closes orders by type - Buy/Sell. Clears stop loss and take profit values. Downloads histor
FREE
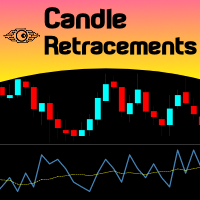
Do you want to know how much, how frequent and at what level a candlestick retraces over the previous one, just drop Candles Retracement over your chart and see it visually! Just choose your desired timeframe and the indicator will show it graphically. As simple as that... In addition you have the option to calibrate a Moving Average over this sub-window chart monitor. This indicator could be used to study candle retracements levels so you can comfortably expect during a trade what to expect fro
FREE

The Buffer Reader will help you to check and export the custom indicators buffers data for your current chart and timeframe. You can select the number of buffer and historical bars to read/export. The data can be exported in a CSV format and the files will be stored in the folder: \MQL5\Files .
How it works Put the number of buffers to read in the Buffers_Total input parameter. Put the number of rows to display in the Rows_Total. Choose the CSV separator in the parameter. Copy the correct na
FREE
Robust trading panel for use on any symbol (including RangeBars or Renko custom symbols). The tool can be placed anywhere on the chart and offers the following array of features: One-click instant order entry. Pending order entry using horizontal lines on the chart Pending order entry using keys in Entry price (E/P) and optional Stop Loss (S/L) and/or Take Profit (T/P) A choice between fixed trading volume or risk-based volume calculation based on the available account equity, entry price, and t
Equity monitor
This is a simple means change informer. I wrote it for myself, maybe someone will need it...
1. Displays the change in funds for the day. Every day, when the terminal is first launched, it remembers the current funds and monitors changes throughout the day.
2. The first day of the month, well remembers the money and, within months, to monitor changes.
3. Well, it displays the profit of the open position.
To work, you need to create 4 global variables: gvarEqityDay ,
FREE

Only Exponential Moving Average at Close Price is used in standard Bears Power limiting the possibilities of that indicator to some extent. Bears Power Mod enables you to select from four Moving Averages and seven applied prices, thus greatly expanding the indicator's functionality.
FREE

EA to prevent inactivity violations on prop firms.
This EA will scout for your most recent trade and if it is older than the number of days defined, will enter a micro lot position size 0.01 on the pair defined. It is recommended to use a tight spread pair like EURUSD. This EA will not act as long as you have at least one trade in the last X days (defined on config).
This EA will not place other trades or modify existing position.
FREE

You've probably heard that different brokers give different results? But what is the main problem when brokers have approximately the same trading conditions for spreads and commissions,you have the same ping.. but the results of trading on real accounts are very different. What's the matter?
There are situations when even good advisors give bad results and the point here may not be in the adviser, but in the broker and you can draw the wrong conclusion about the adviser without getting a goo

[Translated with ChatGPT] 请随意免费下载,如果你喜欢的话,我这里有一个剃头经理: https://www.mql5.com/en/market/product/101312
【欢迎提出可实施的改进建议。这个自动交易程序将永远保持免费。】
时间框架:5分钟以上(1分钟时间框架的蜡烛很短,无法设置止损)
货币:多种
设置:
手数:自动交易程序的交易量
持仓时间:5分钟时间段内持有的时间为900,000毫秒,或等于3个蜡烛
自动交易程序应观察多远:回望10个蜡烛,这是用户可选的,它决定自动交易程序观察多远以确定检测到的十字星是否发生在极端位置(具有最高高点或最低低点)
较短阴影的比例:你希望十字星的短尾有多长
较长阴影的比例:你希望较长尾巴有多长
(通过调整这些设置,你可以影响自动交易程序的盈利能力,例如,如果增加持有仓位的持续时间,在良好的市场反转中,利润可能相当可观。阴影/尾巴会影响交易的频率,如果设置较宽松,将进行更多交易,但十字星的质量也会受到影响。)
自动交易程序概述
正如名字所示,Doji Style是一款
FREE

Script for Metatrader 5. One click to Delete the background grid and object, all objects on the chart such as Trend lines you have drawn or created by another program arrows text Fibonacci lines removes the background grid making a clearer clean chart horizontal and vertical lines
Easy for clearing a chart or when opening new charts. Please leave a review on how its working.
FREE

Standard PVSR is based on Pivot Points.
Steps to Setup the Indicator: Install the Custom Indicator; Set all the Lines Color, Width and Styles; Set visualization to All Timeframe; and DONE
It can be used for: All Pairs: Forex, Cryptocurrencies, Metals, Stocks, Indices etc. All Timeframe All Brokers All type of Trading Style like Scalping, Swing, Intraday, Short-Term, Long-Term etc. Multiple Chart
-->> For any Type of Support, Guidance, Setup Issue, EA Optimization, Input Setup etc.
FREE

Highly configurable Demarker indicator.
Features: Highly customizable alert functions (at levels, crosses, direction changes via email, push, sound, popup) Multi timeframe ability Color customization (at levels, crosses, direction changes) Linear interpolation and histogram mode options Works on strategy tester in multi timeframe mode (at weekend without ticks also) Adjustable Levels Parameters:
Demarker Timeframe: You can set the lower/higher timeframes for Demarker. Demarker Bar Shift: Y
FREE

This utility is used to visually choose an indicator for trailing stop and select its parameters. The Expert Advisor modifies the Stop Loss order position opened for the instrument of the current chart based on indicator values. Uses indicators Parabolic SAR , NRTR (Nick Rypock Trailing Reverse) , Moving Average or linear regression channel. The indicators are added to or removed from the chart using the 'show' checkbox.
The following options are available: Parabolic - trailing stop based on t
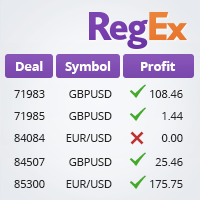
The TradeHistoryParsing is a utility for working with the trade history obtained from the MetaTrader 5 terminal. The product is based on the " RegularExpressions in MQL5 " library. It allows to quickly get the required data on your trading history. The filtering results are displayed as a table, a summary of mathematical statistics is provided below the table.
Working with the tool Export the trade report as an html file and place it into the "sandbox". After that, when launching the EA, speci
FREE

This was an old idea that now became reality. We've been often asked how is the win rate of our trading systems. Well, the win rate is a statistical variable which depends on the R:R ratio plus any edge that can be obtained by filtering and execution. Given this Expert Advisor tries to identify the predominant trend and execute trades properly, You are given the choice to set the Win Rate You like most and when running a back test You can check how It will be respected in the results metrics. As
FREE

To download MT4 version please click here . This is the exact conversion from TradingView: "RSI versus SMA" By "JayRogers". This indicator lets you read the buffers for all Lines on chart. Note: This is an indicator, Not an expert. Meaning It does not take trades. If you want the EA please contact via message. You can easily use the indicator to understand the logic behind trades that the TradingView strategy takes. The strategy is profitable if this indicator is applied to the right symbol at
FREE

Advanced ideas of the popular MACD indicator: It detects and displays classic and reverse divergences (two methods of detecting divergences). It uses different color to highlight an uptrend and a downtrend. Two methods of determining a trend: а) MACD crosses the 0 level (classic signal); б) MACD crosses its own average (early signal). This is a multi-timeframe indicator: it can display MACD data from other timeframes. Two methods of drawing: classic histogram and line. It generates sound and vis

BeST_Hull Single MA Strategy is an Metatrader Indicator based on the famous indicator Hull Mov.Average . This indicator can display the Single HMA Strategy of just 1 Hull MAvg. It uses added internal filters locating the most likely Entries while it can be used as a standalone system or as an add-on to other ones.
Generally the Hull Moving Average (HMA - developed by Alan Hull) is a directional trend indicator . It captures the current state of the market and uses recent price action to determi

Market Grid View is a utility to replace the original 'Market Watch' window. It was designed to be fast and give the user the ability to navigate over all symbols with just a click, while watch the price change or last trade value. To use it, configure your "Market Watch" window with all the symbols you want to monitor, and you can close it. Then insert the indicator in the graph. The parameters window need to be configured: Columns: the number of columns you want to be drawn ShowInfo: the type
FREE

背景
本产品是基于 周期论 而开发出的实用看盘工具。 当您需要使用 多周期图表 来分析 一个品种 时,手动添加不同周期的图表并且应用模板的时间是个非常大的成本。 这一款产品可以帮助您快捷新增一个或多个交易品种的多个周期的图表,并且 统一应用同一种模板 ,新增后可将图表拖拉至副屏,适用于多屏分析。 使用方法
在需要添加的交易品种图表上应用此脚本,在弹出的面板输入您需要添加图表的数量和应用模板名称即可。 第一行填写需要添加图表的数量,新增图表的周期默认顺序为:M5, M15, M30, H1, H4, D1。 第二行填写您需要应用模板的名称,您可以使用系统自带的模板,也可以使用您自定义的模板,但是名称需同步,包括英文大小写。 点击 这里 查看快捷切换多屏图表的工具,可配合此产品一起使用。 点击 这里 查看基于周期论的指标产品,可配合此产品一起使用。 如果您有任何问题或需要帮助,请通过私信与我联系。
注意! 我的所有产品只能在这里购买,即官方 MQL5 网站。 谨防骗子!
FREE

High and Low
The indicator marks bars with a simple trend definition“ each subsequent high above/below the previous one and each subsequent low above/below the previous one ”. Charles Dow
Formula:
Max – The current maximum Min – The current minimum MaxK – Maximum per period MinK – Minimum per period
Min>MinK & Max>=MaxK – Symbol on top Max<MaxK & Min<=MinK – The symbol on the bottom
Input parameter:
Number of bars in the calculated history Period for current timeframe The distance
FREE

Smart Trend Line Alert , available for MT5 is a unique professional Trend Line, Support Line and Resistance Line Touch and Break out Alert with awesome Alert History feature, designed to help traders easily manage many charts and symbols without staring at the monitor.
Features Candle Break Out Alert, Price Touch Alert and Time Line Alert; 1 click for converting any drawn line into an alert line (Trend line and Horizontal line or Trend Line By Angle); Alerts History able to re-open closed char
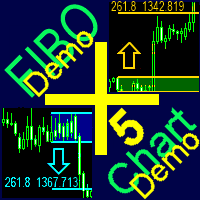
A ready-made trading system based on automatic plotting and tracking of Fibonacci levels for buying and selling any symbol on any timeframe. Demo version - calculation of the last 290 bars is not performed.
Advantages Determines the trend direction (14 indicators) Displays the trend strength and the values of indicators comprising the trend direction Plotting horizontal levels, support and resistance lines, channels Selection of the Fibonacci levels calculation type (6 different methods) Alert
FREE
This script downloads economic news data, required for Economic news calendar with history indicator. It downloads data from fxstreet.com to Common folder of MT5 in CSV format. How to use it (watch video below on how to test demo version): Add http://calendar.fxstreet.com/eventdate / to Allowed URLs section in MT5 settings Download and Install script and indicator from mql5.com Open chart with required currency pair Find script in Navigator panel and drag&drop it to the chart. Find correspond
FREE

简介:
TradeCopy是一款高效,易用的跟单系统,通过简单的设置(可参考下方截图),即可以实现 MT5之间互相跟单 、 MT5与MT4之间互相跟单 。 需要注意的是,如果想要实现MT4与MT5之间互相跟单,还需要购买Tradecopy的MT4版本,MT4上运行MT4版本,MT5上运行MT5版本。 跟单的时候需要让MT4、MT5运行在同一台电脑上,如果不懂怎么在一个电脑上运行多个MT5客户端的朋友,可以私信我,非常乐意教你。 使用视频介绍 需要测试效果的朋友可以下载免费的可以用于模拟帐号交易的版本 : MT4模拟账号测试版本地址: Trade Copy MT4 Demo Free MT5模拟账号测试版本地址: Trade Copy MT5 Demo Free 特点: 1、可实 MT5之间互相跟单 、 MT5与MT4之间互相跟单 。 2、发射端和接收端为同一个文件,使用时只需要在参数中设置成发射端或者接收端,非常方便。 3、跟单方式多, 可以按结余、净值、手数比例或者固定手数跟单 。 4、可以设置反向跟单。 5、币种不同名字,可以进行转换。 6、 1次购买获得20个激活码 ,

BeST_Hull MAs Directional Strategy is a Metatrader Indicator based on the corresponding Hull Moving Average.It timely locates the most likely points for Entering the Market as well as the most suitable Exit points and can be used either as a standalone Trading System or as an add-on to any Trading System for finding/confirming the most appropriate Entry or Exit points. This indicator does use only the directional slope and its turning points of Hull MAs to locate the Entry/Exit points while it

********* 60% discount. you can buy this amazing EA at $280 now. (the price before the discount was $700). *********
Ultimate Trader MT5 is a completely automated trading robot that has been designed and created based on our best strategies in forex trading. All trades are protected by stop loss. the EA uses one same stop-loss for all the trades in one circle so the risk is limited with a safe lot size. The EA contains a special DrawDown control function. Users can use a fixed lot or au
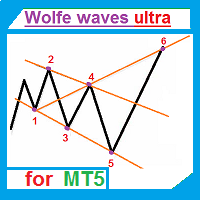
The indicator automatically draws Wolfe waves. The indicator uses Wolfe waves found in three timeframes. This indicator is especially accurate because it waits for a breakout in the wave direction before signaling the trade. Recommended timeframe: М1.
Indicator features Amazingly easy to trade. The indicator is able to recognize all the patterns of Wolfe waves in the specified period interval. It is a check of potential points 1,2,3,4,5 on every top, not only the tops of the zigzag. Finds the

指标为专业的数据统计,持仓订单,历史订单分析->>>>>> <本版本为中文本->英文版请移驾>
交易实用必备工具指标 波浪自动计算指标,通道趋势交易 完美的趋势-波浪自动计算通道计算 , MT4版本 完美的趋势-波浪自动计算通道计算 , MT5版本 本地跟单复制交易 Easy And Fast Copy , MT4版本 Easy And Fast Copy , MT5版本 本地跟单复制交易 模拟试用 Easy And Fast Copy , MT4 模拟账号运行 Easy And Fast Copy , MT5 模拟账号运行 强烈推荐趋势指标, 波浪的标准自动计算 和 波浪的标准自动计算MT5版本
合作QQ:556024" 合作wechat:556024" 合作email:556024@qq.com" 专业EA指标定制编写.
FREE

This Doji indicator/ trading bot, developed by Profectus.AI, is a cutting-edge system harnessing the power of scalping. This pro bono product showcases our expertise and offers a competitive edge in financial markets.
CHAT WITH US! ===============================
YouTube ️ https://youtube.com/@profectusai
️ Instagram ️ https://www.instagram.com/profectusai
Telegram Trading Channel ️ https://t.me/ +ZFrbkNGIVLM2YjJk (Telegram)
WhatsApp ️ https://wa.me/message/C7PZY
FREE

A professional tool for trading - the divergence indicator between the OsMA and the price, which allows you to receive a signal about a trend reversal in a timely manner or catch price pullback movements (depending on the settings). The indicator settings allow you to adjust the strength of the divergence due to the angle of the OsMA peaks and the percentage change in price, which makes it possible to fine-tune the signal strength. The indicator code is optimized and is tested very quickly as
FREE

EA交易演示 :VPS IP:117.50.106.17 登陆帐户:Taolishen 密码:qq2356692354 关于作者 没有EA参与的交易,都存在着巨大的风险。因为恐惧或贪婪,会让我们失去最佳的交易位置。但是,假如EA没有判断能力,这个EA将可能会让我们面临着更大的风险。 我们需要一个拥有判断能力的EA来配合我们的交易。 关于EA Taolishen 是一个拥有多种交易策略的EA,同时也是资深的交易员的忠实交易伴侣。 1 EA拥有一系列的交易策略和思路,完全可以满足无人工参与的全部交易。 2 EA具备一系列的交易参数设定,我们通过修改,就可以实现自定义的交易策略和思路,所有的交易策略和方式方法我们都可以清楚明白了。 3 EA的可变性:EA在交易过程中,我们可以随时通过修改参数数值,改变EA的交易方式方法,使由EA改变成为交易伴侣。 制定策略 1 可以自定义策略:如趋势,网格,趋势马丁,趋势网格等等。 2 可以设定各种指标如:MA,MACD,KDJ,Bolling等等一种或多种指标组合,作为EA的交易参照。 3 可以自定义划趋势线,平衡线等等作为EA的交易参照。 4 可以设定交
FREE
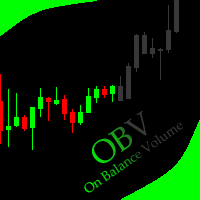
This indicator allows to hide OBV (on all MT5 timeframes) from a date define by the user with a vertical line (Alone) or a panel (with "Hidden Candles"). Indicator Inputs: Apply To Information on "On Balance Volume" indicator is available here: https://www.metatrader4.com/en/trading-platform/help/analytics/tech_indicators/on_balance_volume ************************************************************* Hey traders!! Give me your feeds! We are a community here and we have the same objective....
FREE

This expert advisor joins 18 strategies on crosses and changes, each of them identify a gap on specific custom sessions and try to close the gap. All the parameters are in the code so you can select only the size used for each strategies the base magic number: the real magic numbers used strating from base+1 to base+18. You can specify also the "Suffix" parameters, a special char following the name of the cross in some brokers (eg: EURUSD. EURUSD# EURUSDm) You can also activate/deactivate eve
FREE

If you are looking for a safe ea to start trading BTCUSD this is your ea
BITCOIN MT5. It is an Ea that seeks the best window of opportunity to enter the market.
If the entry is wrong, the system exits by stop lost and take profit.
The system detects the best moment to enter the BTCUSD and at that moment places a market order with its stop loss and its take profit.
Once the order is placed, the exit is only by stop lost or by take profit.
There is only one order at a time reducing the r
DYJ Follow Me 是一跟随任意DYJ指示器虚拟交易记录进行真实开仓和关仓的EA。 它能显示跟单信号源指示器名称,显示指示器状态;当前仅仅是 DYJ SignalSourceOfWPR MT5 ,后续会扩展更多指示器。 它能接收指示器实时趋势方向 它能接收指示器最新入场时间 它能接收指示器最新入场价格
它能显示多个货币对的利润按钮,并且在按钮上还显示了仓位总数 显示多个货币对挂单数量的按钮,您能随时删除某个货币对挂单,也能删除全部货币对挂单
您能根据利润大小,随时点击按钮关闭某个货币对的总利润或全部货币对利润
您可以设置每次1单,每单固定手数0.01 等或者1手或者更高或者跟随指示器交易量。 设置动态利润追踪。 设置封顶目标利润。 关仓时自动删除挂单。 同时显示多个货币对的每个利润和总体利润。 设置总体亏损百分比强制关仓。 INPUT InpSignalOrigin = "WPR"; -- 1. DYJ_T3:DYJ T3MA. 2. WPR: WPR indicator. 3. ALG: Alligator indicator. In

Only Exponential Moving Average at Close Price is used in standard Bulls Power limiting the possibilities of that indicator to some extent. Bulls Power Mod enables you to select from four Moving Averages and seven applied prices, thus greatly expanding the indicator's functionality.
FREE

Indicator that show candlestick bars with an different sampling method than time fixed. Real time data is sourced to the indicator and it may be used as substitute of the default graph. Each bar is formed when a predefined volume of assets was dealt, showing in the graph the OHLC of this clustering. The amount of bars is proportional to the amount of negotiations instead of a sample in a fixed amount of time. If the broker doesn't show the real volume of the trades, this indicator won't work. Th
FREE

Dynamic Indicator --> YKL_DinDX Dynamic Indicator that creates a Band based on the distance from moving average specified by the user. The indicator considers the period entered by the user in order to calculate the average distance from moving average, creating an upper band and a lower band. This indicator is utilized by EA YKL_Scalper, version 2.0 or superior.
FREE
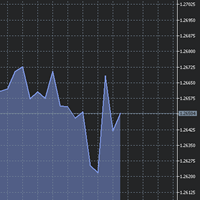
The utility Filled Area Chart adds to the standard set of price presentations. It is a brand new, nice price chart. You will certainly like it if you want to feel yourself a trader born under the Bloomber lucky star.
The Properties allow to set the colors and other things: Color preset - choose a preset or set to "Custom" and set your own colors using the properties below.
Custom area color - color of the area below the price line. Works only with Color preset = Custom.
Custom chart color -
FREE

"Moving Ratio Candle" is used to check the distance of a candle to a theoretical pressure point. Furthermore, we have two points of interest, the first for the mean and the second for the median. This indicator uses the shape of bars and the line that crosses the bar from left to right is based on the calculation of the closing price for both sides. The rest follows a more standard calculation. The same could be done as a line, but I want to know the behavior of this indicator in relation to the
FREE

MT4 Version Wave Trend MT5 Wave Trend is an oscillator, which helps identifing in a extremely accurate manner market reversals. The Oscillator being obove the overbought level and a cross down of the fast into the slow MA usually indicates a good SELL signal. If the oscillators is below the oversold level and the fast MA crosses over the slower MA usually highlights a good BUY signal. The Wave Trend indicator can be also used when divergences appear against the price, indicating the current move

TradeCopier is an application for automated copying of trades for different accounts in MetaTrader 5 terminal with flexible rules of filtering and modification. With TradeCopier, copying, filtering and transformation of trades are realized and processed via the server . It means that copying trades is possible within one or several computers. How can you boost your trading results with TradeCopier? Your convenience and speed Average speed of copying: 100 ms Working with MetaTrader 5 Working with
FREE

ICT Kill zone and Macros Indicator mark and display the following zone times on the chart: Kill zones Kill zone Forex Asian
London Open New York Open London Close Central Bank Dealing range
Kill zone Indices Asian London Open New York AM New York Lunch New York PM Power Hour
Macros London 1 London 2 New York Am 1 New York AM 2 New York Lunch New York PM 1 New York PM 2
Silver bullet London Open New York AM New York PM
Sessions Asian London New York
Chart The display of Kill zone ,

*Used by MeditionSeed EA. Meditation is a practice in which an individual uses a technique – such as mindfulness, or focusing the mind on a particular object, thought, or activity – to train attention and awareness, and achieve a mentally clear and emotionally calm and stable state.[1][2][3][4][web 1][web 2] Plant a Meditation Seed to have wonderful future.
FREE

The RSI (Relative Strength Index) scanner is a powerful technical analysis tool designed to help traders and investors identify potential trading opportunities in the forex, stocks, and cryptocurrency markets. RSI is a popular momentum oscillator that measures the speed and change of price movements and helps determine overbought or oversold conditions in an asset. The scanner takes advantage of this indicator to streamline the process of finding trading signals and opportunities. The RSI value
FREE

This Renko is: Live : constantly updated on the market prices Dynamic : updating on each new ATR value Backtestable : Generating the chart during backtest, allowing Real Ticks Accuracy and Time Period Accuracy Guppy Built-in : GMMA with 12 EMA built-in This is what you are looking for! RENKO A Renko chart is a type of chart, developed by the Japanese, that is built using price movement rather than both price and standardized time intervals like most charts are. It is thought to be named a
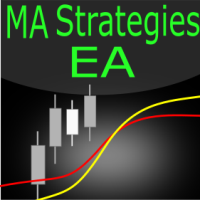
MA strategies EA is a moving average cross EA that can support multiple MA cross strategies that involve two or three moving averages. Purchasing this EA can save you the time taken to automate your existing MA strategy through coding a custom EA and it also helps you discover profitable moving average strategies as its fully compatible with the strategy tester and all settings are editable. The EA supports both scalping, short term and long term strategies. The various supported settings are ex

The simple strategy used to get funding "Fundednext" My EA for My Project.. 2 signal entry methods for Breakout or Reversal PDH-PDL... New Version 1.2 update entry Lots Base on % of Account We recommend doing a backtest first on your demo account before using it on a real account...
By default, the settings we use for teams apply to the GOLD,GU,EU,Nas100US pairs...
For BreakOut OpenPosition = true For Reversal OpenPosition = false Include Reset All Variable For New Day Youtube Tutorial Her
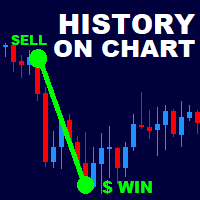
History On Chart is an indicator that shows the "trail" of all trades made in a specific period of time. It shows the entry and exit point with their respective dates and prices. It also shows the type of trades and the cash result. Open trades are also displayed, but only the entry point. The indicator is free and fully customizable. If you have any questions please contact us. Enjoy!
This is a free indicator, but it took hours to develop. If you want to pay me a coffee, I appreciate a lot
FREE

Non-proprietary study of Joe Dinapoli used for trend analysis. The indicator gives trend signals when the fast line penetrates the slow line. These signals remain intact until another penetration occurs. The signal is confirmed at the close of the period. It is applicable for all timeframes. Parameters Fast EMA: period of the fast moving average. Slow EMA: period of the slow moving average. Signal EMA: period of the signal line. ************************************
FREE
MetaTrader 市场 - 在您的交易程序端可以直接使用为交易者提供的自动交易和技术指标。
MQL5.community 支付系统 提供给MQL5.com 网站所有已注册用户用于MetaTrade服务方面的事务。您可以使用WebMoney,PayPal 或银行卡进行存取款。
您错过了交易机会:
- 免费交易应用程序
- 8,000+信号可供复制
- 探索金融市场的经济新闻
注册
登录