适用于MetaTrader 5的EA交易和指标 - 35

The MetaCOT 2 CFTC ToolBox Demo is a special version of the fully functional MetaCOT 2 CFTC ToolBox MT5 library. The demo version has no restrictions, however, unlike the fully functional version, it outputs data with a delay. The library provides access to the CFTC (U.S. Commodity Futures Trading Commission) reports straight from the MetaTrader terminal. The library includes all indicators that are based on these reports. With this library you do not need to purchase each MetaCOT indicator sepa
FREE

En esta versión, las alertas están funcionando y en la versión que publicó, la zona muerta de atr era solo una zona muerta sin atr, por lo que también la convirtió en una zona muerta de atr.
Indicator input parameters input int Fast_MA = 20; // Period of the fast MACD moving average input int Slow_MA = 40; // Period of the slow MACD moving average input int BBPeriod=20; // Bollinger period input double BBDeviation=2.0; // Number of Bollinger deviations input int Sensetiv
FREE

The index makes it easy for traders to know the opening and closing times of global markets :
- Sidney - Tokyo - London - New York
Where it misleads each time zone and enables us to know the times of overlapping the markets when the liquidity is high.
To get more indicators and signals, follow us on the Telegram channel link
https://t.me/tuq98
Or our YouTube channel, which has explanations in Arabic and a technical analysis course
https://www.youtube.com/@SSFX1
FREE

The name Aroon means “ Dawn's Early Light ” in Sanskrit. His creator Tushar Chande chose this name because the indicator is designed to catch the beginning of a new trend. At first sight it seems a little confusing all those jagged lines but after you understand the basics of it, you will find this indicator pretty cool and use it in a variety of ways, i.e.: Trigger, Trend Filtering System, and so on. The Aroon indicator was created in 1995 so it is a "modern" indicator compared to the Jurassic
FREE

Ultimatum Breakout - this trading system uses the strategy of valid breakouts, using multiple custom indicators for eliminating bad signals. The EA uses a very small SL so the account is always protected from equity drawdown with a very low risk-per-trade. The EA is fully adapted: calculates the spread — for pending orders, stop loss, trailing stop, breakeven. It was backtested and optimized using real ticks with 99,9% quality. It has successfully completed stress testing. No Martingale. No arb

This is advanced Multi-Symbol and Multi-Timeframe version of the "Candle Pattern Finder" indicator (search for candlestick patterns based on the book by Gregory L. Morris "Candlesticks charting explained. Timeless techniques for trading stocks and futures" ). The indicator searches for candlestick patterns for ALL symbols of the "Market Watch" window and for ALL standard timeframes from M1 to MN1. When patterns appear on any symbol / timeframe, the indicator gives a signal (text, sound, sending

ScriptBot is a multi-strategy robot developed to be practical and robust, with ScriptBot you are able to create different strategies of your own, install up to 51 indicators of your liking and build your own trigger using simple logic expressions. AVISO: Versão brasileira: mql5.com/pt/market/product/67311 Below we will tell you a little about the structure: Indicators: ScriptBot does not have indicators in its coding, this means that you have full control of which indicators you want to
FREE

有了FNG顾问,你就能做出最适合你和你的交易风格的策略。 我们的大多数策略不使用鞅函数,但如果这是您的首选方法,该选项始终存在。
过滤指标:信封,熊/牛,移动平均线,威廉姆斯百分比范围和ATR
新闻过滤器-在新闻之前关闭交易并在新闻之前停止交易
追踪止损
可选鞅
经纪商隐藏的TP/SL
扩展过滤器
动态批量大小
创建可靠工作的个人交易策略,并将进行有利可图的交易。 如果您了解优化的工作原理并愿意投入一点时间,那么使用FNG Advisor创建自己的个人策略很容易。 对于不知道如何使用MT5优化功能的交易者,不建议使用此专家。
市场总是在变化,所以我们根据过去2-4年的历史数据创建我们的策略,并将提供我们所有的设置文件供您使用。 请在使用前优化设置文件到您的代理. 您应该为您的经纪商优化信号偏移,指标时间表和TP/SL。 我们的个人设置文件是优化使用1分钟的时间框架。 我们在评论部分提供了几个演示集文件。
当您购买我们的专家时,您不仅购买专家顾问,而且您还购买我们当前和未来的集文件。 随着我们添加更多的主要指标,我们将提供尽可能多的
FREE

AIGO is is bundled with two strategies that will help you trade XAUUSD (actually any pair) effectively according to your risk appetite. Test it, believe it. It's really simple!
WHY AIGO? Multi-Strategy -- Choose to trade with one, or ALL strategies included. Endless Possibilities -- You have access to ALL parameters which you can tweak and change according to your risk appetite. You are not limited by hidden mechanics. Multi-Timeframe -- AIGO uses different sets of indicators for entry and e

The Fisher Transform is a technical indicator created by John F. Ehlers that converts prices into a Gaussian normal distribution. The indicator highlights when prices have moved to an extreme, based on recent prices. This may help in spotting turning points in the price of an asset. It also helps show the trend and isolate the price waves within a trend. The Fisher Transform is a technical indicator that normalizes asset prices, thus making turning points in price clearer. Takeaways Turning poi
FREE

The YK-SMART-EMA is an indicator that displays multiple Exponential Moving Average (EMA) lines on a price chart to help analyze price trends. This indicator features five EMA lines: EMA14 (red line): Calculated based on the closing prices of the last 14 candles. EMA30 (blue line): Calculated based on the closing prices of the last 30 candles. EMA50 (green line): Calculated based on the closing prices of the last 50 candles. EMA100 (orange line): Calculated based on the closing prices of the last
FREE

Trade Assistant MetaTrader System — a multi-timeframe system that is based on three standard indicators: Stochastic oscillator , RSI (Relative Strength Index), and CCI (Commodity Channel Index). It displays current trend directions for M1, M5, M15, M30, H1, H4, D1, W1, and MN1 timeframes. When you follow such an indicator you have a clear picture of the trends across all important timeframes. It doesn't matter which timeframe you attach this indicator to.
Input parameters CheckCandl

The TTM Squeeze is a trading strategy developed by John Carter of Trade the Markets that uses the combination of Bollinger Bands and Keltner Channels to identify periods of low volatility, followed by periods of high volatility. The strategy is based on the principle that low volatility periods are typically followed by high volatility periods and is used to identify potential trading opportunities. When the Bollinger Bands move inside the Keltner Channels, it is referred to as a squeeze, and i
FREE

CAP Ichimoku EA Pro MT5 is trade the Ichimoku Kinko Hyo Indicator with complete freedom using a powerful and flexible EA. It using the metatrader basic ichimoku Indicator. It offers many customizable ichimoku trading scenarios and flexible position management settings, plus many useful features like customizable trading sessions, a martingale and inverse martingale mode.
Before buy Pro version? You can buy alternation pro version, our powerfull EA, CAP Strategy Builder EA . This is strate

The Big Mac B MQL5 expert advisor is a based off a Bollinger breakout strategy. The MACD indicator is used to confirm either a buy or sell trend. The MFI indicator to act as a trading range to ensure that the buy or sell is not activated when the price is in an overbought or oversold condition.
Trades will only be entered if the current price is within the trading range of the MFI indicator. Default settings are for the USDJPY on the 5 minute time-frame.
To work with the news server, you must
FREE

The concept is simple: Plotting Price behavior within several periods of time. Some Symbols behave very well during the trading day - with this I mean Intraday trading - and this behavior ends up plotting effectively well with the proposed Exponential Moving Averages in this indicator... Obviously that this behavior could not be seen in all Symbols, but you can give it a try... Just drop this indicator in a chart and you will see for yourself...
This indicator is intended for "Feeling the Trend
FREE

描述 :
“市场结构 HH HL LH LL”指标是分析金融市场价格动态的强大且简单的工具。该指标帮助交易者和投资者识别趋势变化并识别价格时间序列中的重要点。
该指标的关键组成部分:
HH(较高高点):价格收盘高于前一个高点的顶部。 HH 表明上升趋势加强。 HL(较高低点):价格收盘高于前一个低点的最低值。 HL确认了上升趋势的延续。 LH(较低高点):价格收盘低于前一个高点的顶部。 LH 预示着趋势可能逆转。 LL(较低低点):价格收盘低于前一个低点的最低值。 LL 确认下降趋势的开始。
如何使用:
“市场结构HH HL LH LL”指标帮助交易者和投资者确定市场的当前趋势。上升趋势以 HH 和 HL 序列为特征,下降趋势以 LH 和 LL 序列为特征。当趋势发生变化时,它可以作为在市场上开仓或平仓的信号。
使用示例:
假设您持有一只股票的多头头寸,并且指标显示 LH 和 LL 序列,表明下降趋势可能开始。这可能是平仓或设置止损限额的信号。
下图显示了下降趋势的示例以及该趋势被突破的示例。

The MP Andean Oscillator is used to estimate the direction and also the degree of variations of trends. It contains 3 components: Bull component, Bear component and Signal component. A rising Bull component indicates that the market is up-trending while a rising Bear component indicates the presence of down-trending market. Settings: Oscillator period: Specifies the importance of the trends degree of variations measured by the indicator. Signal line per: Moving average period of the Signal line
FREE

Reward Multiplier is a semi-automatic trade manager based on pyramid trading that opens additional orders with the running profit of your trades to maximize return exponentially without increasing the risk.Unlike other similar EAs, this tool shows potential profit/loss and reward to risk ratio before even entering the first trade! Download full version here ( In the mini version. Starting lot is fixed at 0.01 (or minimum allowed lot size ) Guide + tips here MT4 version here You only open the
FREE

VWAP RSJ is an indicator that plots the Hourly, Daily, Weekly and Monthly VWAP Lines.
Large institutional buyers and mutual funds use the VWAP ratio to help move into or out of stocks with as small of a market impact as possible. Therefore, when possible, institutions will try to buy below the VWAP, or sell above it. This way their actions push the price back toward the average, instead of away from it. Based on this information I developed this indicator that combines 4 types of VWAP T
FREE

Exclusive Arrival: Presenting for the First Time . This is your secret weapon for predicting which way the wind will blow with the next market shift. It assists you in developing your trading strategy by predicting the direction of the next candle. Compatible with forex, stocks, and cryptocurrencies on all timeframes, but higher timeframes are recommended. MT4 Version - https://www.mql5.com/en/market/product/108931/ How does it work ? It's pretty neat. The algorithm separates green and red ca

This indicator uses a different approach from the previous version to get it's trendlines. This method is derived from Orchard Forex, and the process of making the indicator is demonstrated in there video https://www.youtube.com/watch?v=mEaiurw56wY&t=1425s .
The basic idea behind this indicator is it draws a tangent line on the highest levels and lowest levels of the bars used for calculation, while ensuring that the lines don't intersect with the bars in review (alittle confusing? I kno
FREE

An analogue of the Stochastic oscillator based on algorithms of singular spectrum analysis (SSA) SSA is an effective method to handle non-stationary time series with unknown internal structure. It is used for determining the main components (trend, seasonal and wave fluctuations), smoothing and noise reduction. The method allows finding previously unknown series periods and make forecasts on the basis of the detected periodic patterns. Indicator signals are identical to signals of the original i
FREE

Что такое CCI индикатор? Стандартный Индикатор CCI (Commodity Channel Index) – это осциллятор, который измеряет силу, стоящую за тем или иным движением цены. Он помогает определить, кто находятся у руля: быки или медведи. Как и многие осцилляторы импульса, CCI работает, сравнивая текущую цену с предыдущими показателями, и на основе этого сравнения он решает, насколько сильное движение цены вверх/вниз.
Как рассчитать CCI? Метод расчета стандартного индикатора представляет собой оригинальн
FREE
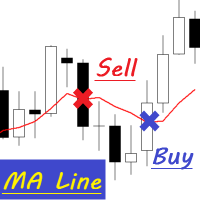
A cross between the candlestick and the moving average line.
MA Line is Expert Advisor which is very simple by working as below: Buy Condition 1. Perivious open candle bellow MA Line 2. Previous close candle above MA Line Sell Condition 1. Perivious open candle above MA Line 2. Previous close candle below MA Line
EA Parameter - Time Filter - Lot - MA Period - MA Method - Stop Loss - Take Profit - Trailing Start - Trailing Step - Trailing Stop - Magic Number
FREE

多货币和多时间框架指标 MACD。 仪表板可以显示传统(真实)MACD 和 MetaTrader 中内置的 MACD。
在面板上,您可以看到指标的当前状态 - MACD 线的移动方向、它们的交点以及带有指标图表的弹出窗口。 在参数中,您可以指定任何所需的交易品种和时间范围。 扫描仪还可以发送有关线相互交叉以及线穿过零电平的通知。 通过单击单元格,将打开给定的符号和句点。
因此,您可以轻松扫描所有时间范围的所有货币对和交易品种,以找到 MACD 主线和信号线或零水平的交叉点。
显示/隐藏仪表板的热键默认为“D”。 默认情况下,启用/禁用弹出图表的热键为“C”。 用于切换图表“1”和“2”上的箭头的热键。 MACD(移动平均收敛/发散)指标(或“振荡指标”)是根据历史价格数据(最常见的是收盘价)计算得出的三个时间序列的集合。 这三个系列是:MACD 系列本身、“信号”或“平均”系列以及“背离”系列(两者之间的区别)。 MACD 系列是价格系列的“快速”(短期)指数移动平均线 (EMA) 和“慢速”(较长周期)EMA 之间的差异。 平均数系列是 MACD 系列本身的 EMA。
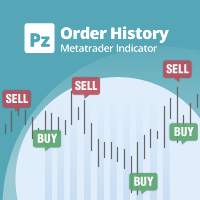
显示任何实时图表的交易/订单历史的通用指标,非常类似于策略测试器的可视化模式。它允许您检查任何特定交易品种的真实交易历史,以用于教育、改进、逆向工程或诊断目的。它可以与主密码和投资者密码一起成功使用。
[ 安装指南 | 更新指南 | 故障排除 | 常见问题 | 所有产品 ]
一些主要特点是:
方向分析
每笔交易的损益标签
可定制的颜色和尺寸 利润因子的计算 按工作日和一天中的时间划分的交易活动细分
输入参数 购买箭头:购买箭头的颜色
卖出箭头:卖出箭头的颜色
买入箭头大小:买入和卖出箭头的大小
Close Buy: 买单的关闭颜色
Close Sell:卖出订单的关闭颜色
关闭箭头大小:关闭订单箭头的大小
获胜交易线:显示盈利交易的线颜色
亏损交易线:显示亏损交易的线条颜色
买入线样式:长交易线样式
卖出线样式:短线交易线样式
买入线宽:显示多头交易的线的大小
卖线宽度:显示空头交易的线的大小
赢得贸易标签:盈利贸易标签的颜色
丢失贸易标签:丢失贸易标签的颜色
字体大小:图表标签的字体大小
支持 我很乐意提供免费产品,但鉴于我的时
FREE

The fractal indicator shows the latest support and resistance levels. If the price breaks through the level and is fixed, the indicator draws a rhombus of yellow or crimson color signaling a possible continuation of the movement towards the breakdown.
Indicator Settings:
- BarCount: sets the minimum number of bars required to build a fractal.
It is better to use the indicator in conjunction with other indicators.
FREE

(谷歌翻译) 该指标基于 Worden Brothers, Inc 开发的原始“ Time Segmented Volume (TSV) ”。 但是,我为此添加了一些额外的功能。 可以选择要应用的价格,而不是仅使用原始默认收盘价。 您还可以选择使用哪种交易量加权,包括基于真实范围的伪交易量,或根本不使用交易量加权。 (谷歌翻譯) 該指標基於 Worden Brothers, Inc 開發的原始“ Time Segmented Volume (TSV) ”。 但是,我為此添加了一些額外的功能。 可以選擇要應用的價格,而不是僅使用原始默認收盤價。 您還可以選擇使用哪種交易量加權,包括基於真實範圍的偽交易量,或根本不使用交易量加權。 (Original text) This indicator is based on the original “ Time Segmented Volume (TSV) ” developed by Worden Brothers, Inc . However, I added an extra few features to this one. One ca
FREE

High of the Day and Low of the day Time and Price Fractal Studies is an indicator that will help you identify certain patterns that tend to repeat themseleves at certail times of the day or at certain prices.
It is used to study Daily Highs ad Lows in relation to time and price.
You will get to answer certail questions like:
At what time of day does this market usually turn around. At what price does the market turn. Is it at round numbers etc
FREE
Counterattack EA is a fully automatic Grid Expert Advisor for Trend Scalping Trading on XAUUSD timeframe M1 but also in others.
Recommendations The Expert is programmed to work on XAUUSD M1, but you can use all others timeframes also. An ECN broker is always recommended A low latency VPS is always recommended. The recommended Leverage is 1:100 or more. The recommended capital is 10000 ($/cent) per 0.01 Lots or more. For higher Lots please test by yourself Please test Demo before you
FREE
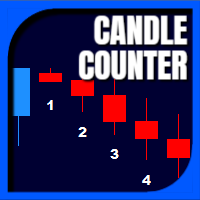
Candle Counter is a simple indicator that list the amout of candles in the day according to the current chart timeframe. It is specially useful for those teaching others how to trade, as it can draw attention to a specific candle of the day. Configuration:
Reverse mode - if on, the actual candle is the first one.
Position - Above or below the candles.
Vertical distance - Vertical distance from the candles in pipets/points.
Size - Font size. If you need help please don't hesitate to contact
FREE

The Keltner Channel is a volatility-based technical indicator composed of three separate lines. The middle line is an exponential moving average (EMA) of the price. Additional lines are placed above and below the EMA. The upper band is typically set two times the Average True Range (ATR) above the EMA, and the lower band is typically set two times the ATR below the EMA. The bands expand and contract as volatility (measured by ATR) expands and contracts. Since most price action will be encompasse
FREE

Drawdown Monitor EA Risk management made easy. Balance and equity monitoring, closing positions, deleting orders, notifications by email and/or push on mt5-mobile.
Security for your Money or Prop Trading accounts. This Expert Advisor constantly monitors the account balance and equity. If the maximum daily drawdown is reached, all open positions will be closed, open orders will be deleted, a notification will be sent by email/push. In addition, the EA creates a global variable, which ensures t
FREE

RSI Martingale is simply based on the RSI indicator. You can avail it for an affordable price right now because SET and OPTIMIZATION files are not yet available. The rules of the EA is when the indicator reaches the overbought condition, it will open a sell position and buy when the indicator reaches the oversold condition. When the trade is lost, the EA will trade the same position with a doubled lot size.
FREE
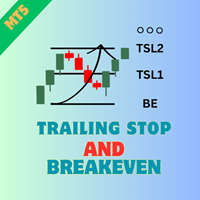
Product Name: Trailing Stop and Breakeven Management EA Description:
This EA (Expert Advisor) is designed to set trailing stops and breakeven levels for trades based on input parameters and a magic number in MT5. It can be used to manage trades placed manually or by any other EA. The EA allows customization of various settings to suit your trading strategy. General Settings: Enable Magic Number (ENABLE_MAGIC_NUMBER): Enable to use a magic number for trades. Set to false for manual trades. Magic
FREE

Loss Recovery 3 is an Expert Advisor for recovering losses of positions that were opened in the wrong direction (that were opened by another EA or manually). This EA recovers your loss and closes your position on Break Even or with determined profit.
Trading Strategy:
Loss Recover3 EA try to Recover Wrong Positions, by using Averaging method. There are various features on the EA to control risk of the strategy.
Using EA :
The EA is very simple and without complicated input para

引入终极外汇EA,专门设计用于帮助您通过专业公司的挑战:Easy Prop 1。这个专家顾问是为那些希望在交易旅程中取得成功并通过FTMO和My Forex Fund等专业公司挑战的个人量身定制的完美工具。虽然没有任何交易系统能够保证成功,但Easy Prop 1旨在为您提供市场优势,帮助您实现交易目标。 Easy Prop 1的一个关键特点是其先进的风险管理系统,每笔交易风险仅限于0.5%或1%。这意味着您可以放心交易,知道您不会承受过多的风险暴露。此外,每天仅执行两笔交易,您可以放心,您不会过度交易和冒险损害您的账户。 注意:价格将很快上涨,请立即购买。 购买Easy Prop 1时,您将收到一份详细的手册,其中包含了所有您需要定制该EA以适应您的交易偏好的信息。有了这些信息,您将能够根据您的特定交易计划调整EA,最大限度地提高您的成功机会。 此EA专门用于交易主要货币对USDJPY。 Easy Prop 1不仅高效,而且价格也非常实惠。在有限的时间内,我们以无与伦比的价格提供此EA。然而,一旦售出5份副本,价格将上涨,因此请迅速行动,以以这个惊人的价格获取您的副本。 无论您是新手

Algo Edge EA -DE40/ Tec100 Self learning EA just set the EA on the Chart and Start no Settings optimization.
AUD/USD, EUR/USD, DE40, US30, Tec100 and much more. Multifunctional Expert Advisor can trade with every Forex Pair or Indize. EA can Trade with every Broker. M1 high, M30 medium, H1 low Risk. Functions: For other Indize example US30: Change the Robot Worktime in Europe to 16:30-21:30
-inp1_ =Robot Worktime inp_2 and inp_4 VolumePercent = The Robot will increase the Lot per 1000$ to
FREE

This indicator draws regular bullish and bearish divergences in real-time onto the charts. The algorithm to detect those divergences is based on my 10+ years experience of detecting divergences visually. The divergences are drawn as green and red rectangles on the charts. You can even do forward testing in the visual mode of the strategy tester. This FREE Version is restricted to EURUSD and GBPUSD. The full version without restrictions is here: https://www.mql5.com/en/market/product/42758
Par
FREE

Colors generated according to trading volume and market direction.
The analysis is carried out following the direction of the price and volume traded if the traded value exceeds the calculation base the system changes the color to green, informing you that the price direction is strong to buy, if the traded value is less than the calculation base the system changes to red, indicating that the price is strong for sale.
FREE

The Martinware Manual Trading Helper indicator is aimed at helping people start their lives in manual trading. It can be used to display both some generic images at the right side of the graph, where custom operational remarks may be displayed or just a blank rectangle hiding the chart while backtesting. Moreover, it can periodically play a list of sounds. To show a blank rectangle, let the first image name input field empty and select the desired color. To show one or more custom images inste
FREE

Introducing our cutting-edge Expert Advisor (EA) designed to capitalize on the crossover signals generated by the Double Exponential Moving Average (DEMA) and Triple Exponential Moving Average (TEMA) indicators. This dynamic combination offers a robust strategy for identifying potential entry and exit points in the forex market. The DEMA and TEMA are advanced moving average indicators that provide smoother and more responsive signals compared to traditional moving averages. By leveraging the cro
FREE

Get ALERTS for break of your TRENDLINES, SUPPORT LINES, RESISTANCE LINE, ANY LINE!!
1. Draw a line on the chart (Trend, support, resistance, whatever you like) and give it a name (e.g. MY EURUSD line) 2. Load the Indicator and input the Line Name the same name in Indicator INPUT so system knows the name of your line (= MY EURUSD line) 3. Get Alerts when Price breaks the line and closes Works on All Time frames and charts LEAVE A COMMENT AND IF THERE IS ENOUGH INTEREST I WILL WRITE AN EA WHICH
FREE

"SyntheticaFX强势指示器" 是一款杰出的交易工具,旨在提供有价值的市场强势和潜在变化的洞察,而不泄露其专有的方法论。这一强大的指示器最适合与我们的专业工具 "SyntheticaFX CrashSlayer" 和 "BoomSlayer" 峰值指示器一起使用,以为交易者和投资者提供全面且动态的交易体验。
当与我们的 "SyntheticaFX CrashSlayer" 和 "BoomSlayer Spike Indicator" 一起使用时,"SyntheticaFX Power Indicator" 成为强大的交易工具之一,提供以下优势:
增强的市场分析:"SyntheticaFX Power Indicator" 与我们的其他工具协同使用,为交易者提供了对市场的全面视角,有助于精细调整交易决策。
协同的买入和卖出信号:这些指标的组合生成强大的买入和卖出信号,旨在提高您的交易进出的准确性。
完全的市场控制:有了这三个指标,交易者可以更好地掌握交易策略,实现更加平衡和明智的方法。
通过将 "SyntheticaFX Power Indicator" 与
FREE

VolumeFlow is a Volume Accumulation / Distribution tracking indicator. It works in a similar way to OBV, but it is much more refined and includes the options to use: Classical Approach = OBV; Useful Volume Approach; Gail Mercer's approach; Input Parameters: Input Parameters: Approach Type: Explained above; Volume Type: Real or Ticks; Recommendations: Remember: The TOPs or BOTTONS left by the indicator are good Trade Location points. This is because the players who were "stuck" in these regions w
FREE

This indicator displays MTF (Multi-Time Frame) Candles on your Chart. It helps to see the overall Trend of Market. You can specify 2ndLast, Last or Current Candle of any timeframe to show to get a better picture of Trend.. You get 4TF Bars/Candles on your current chart ..
Customizable Settings are : 1. Where to place MTF Candles.. 2. Show or Hide for each Candle 2. Time-Frame for each Candle 3. Current/ Last / 2nd Last of Each Candle
FREE

** All Symbols x All Time frames scan just by pressing scanner button ** *** Contact me after the purchase to send you instructions and add you in "Harmonic Scanner group" for sharing or seeing experiences with other users. Introduction Harmonic Patterns are best used to predict turning point. Harmonic Patterns give you high win rate and high opportunities for trade in during one day. This indicator detects the best and successful patterns based on Harmonic Trading concepts . The Harmonic Patt

TRAILINATOR is a unique Solution to use different Trailing-Stop Variants and change your Tradesetup via Remotecontrol. You configure your Tradesetup for a specified Symbol only once. This setting will be used for all your Positions of the same Symbol. Currently we support these Features: different Trailing-Stops: Standard: works like you use in Metatrader Terminal, starts trailing if your profit is greater than trailing stop Start after points: trailing stop will start after your defined poin

Индикатор PivotPointSuperTrend отлично показывает данные Тренд на основе мат данных от Pivot и ATR и очень удобен для входа в сделку и выставления стопов. Если кто то сможет добавить в код мултитаймфрем, я и многие пользователи будут очень Благодарны, то есть чтобы ондикатор показывал значение старшего таймафрема на графике младшего таймфрема, Заранее Спасибо!
FREE
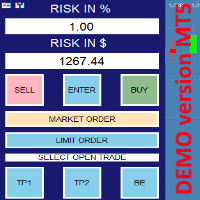
this is DEMO VERISON (for demo acc.) of TRADING OVERLAY with PARTIAL take profit ("virtual TP") and % risk lot size
--- full version available on my 'seller page' as well as version for MT4 Take better control of your trades with ease ! Easy lot size calculation with easy SL/TP setting. Your trading will be much more comfortable with this tool!
Main goal with this tool is very SIMPLE and FAST operation! Works like any EA, add it to selected chart and trade !
Features: start
FREE

Santa Donchian Indicator is an efficient way to detect support, resistence and break outs in any market.
The Donchian channel measures the high and the low of a previously defined range. Typically, a trader would look for a well-defined range and then wait for the price to break out to either one side for a trade entry trigger. Advantages Never repaints, never backpaints, never recalculates. Works in all symbols and all timeframes. Perfect trend filter for any strategy or expert advisor. Fu
FREE

Summary Since 2018, my forex trading journey has been centered around a breakout strategy, often referred to as the price trap, which has proven to be remarkably successful. By incorporating AI into my trading methodology, I've been able to amplify my profitability even further. This approach has not only allowed me to generate substantial profits but has also granted me the freedom to spend more quality time with my loved ones. Sharing my strategy with others demonstrates my confidence in its

This indicator is a zero-lag indicator and displays strength of trend change . True Trend Oscillator Pro works best in combination with True Trend Moving Average Pro that displays exact trend as is. Oscillator value is exact price change in given direction of the trend.
True Trend Moving Average Pro: https://www.mql5.com/en/market/product/103586
If you set PERIOD input parameter to 1 this indicator becomes a sharpshooter for binary options.
Developers can use True Trend Oscillator in E
FREE

Baby ADX (BBADX ADXBB) Lo he diseñado con el propósito de operar automáticamente desde y para cuentas muy pequeñas (recomendable para cuentas de tan solo 100 USD ) y un apalancamiento de 1:30 aunque un apalancamiento mayor es preferible, con mayor capital no se obtiene un beneficio mayor proporcional, si no una reducción proporcionalmente menor. Con objetivo de alcanzar el punto de equilibrio a corto, medio plazo para retirar el capital y seguir operando tan solo con el beneficio obtenido en rie
FREE

如果你象这个项目一样,就有5个饥饿审查。 塔克的后续工作: borelatech 大量贸易要求我们寻找多种工具/工艺品,以寻找多种工具。
找到新的机会,这一指标将帮助你具体勾画具体的具体机会。
数众多或多其配件的职等自动更新。
随着价格的变化,这项任务本来会引起恶意。 例如,在日本财团,你可以有4个关于该指标的事例。
图谋: 每0.01 每隔100英尺长。 每种价格以每隔0.0075年关闭25个酒吧。 每种价格以50英尺的长度为准。 每种价格在0.0025年关闭,时间为25个酒吧。 这种做法将类似于一个规则者,你可以看到这一非常例子。
屏幕。 此外,你可以确定不同的肤色和线风格。
这使视觉程度更加容易。
FREE

This is a depowered version of the following product: AI Trading Advisor
This version is just to give you an idea but it does not allow you to run multiple tasks at once, and it is totally depowered. It is free as the cost of the service is offered entirely by StormWave Tech. This version cannot do in-depth analysis but it can give you an idea of how the AI works and interacts with the metatrader, unlike the paid version which instead has unlimited capacity even to perform tasks simultaneousl
FREE

趋势面板是一个简单方便的工具,它将使用用户选择的十对显示时间帧 M1 - D1 的已确认趋势方向。
该指标旨在将方向确认添加到任何策略/模板中,然后还可以作为一个干净的交互式界面快速将图表更改为不同的货币对或时间范围。 群聊: https://www.mql5.com/en/users/conorstephenson 请在购买后与我联系以获取设置建议和免费专家顾问! 我的产品仅在 MQL5 上出售 ,如果您在其他任何地方看到此产品,那是仿制品。不要被愚弄 。 主要特点 清洁图表面板以快速帮助确定时间范围内的趋势方向。 交互功能。 更改图表蜡烛的颜色 - 轻松查看当前和过去的趋势。 点击配对和时间框架按钮可更改当前打开的图表。 单击图表上的面板并将其拖动到最适合您的模板设置的位置。 选择要显示的 10 对。 编辑面板中使用的颜色。 将与外汇对、指数、股票、加密货币... 提示新趋势开始的警报功能。 建议 当面板中的所有一个垂直列都是相同的颜色时,一对可以被认为是强烈趋势。 与策略/模板一起使用以获得时间框架趋势方向的视觉帮助。 输入定义 趋势模式。 更改蜡烛颜色 - True 将更
FREE

Whether you are a scalper or daily trader, you will always look for bullish / bearish engulfing candles. This can be a bit tricky and stressful when you try to visually identify the engulfing candles on the chart. Not only that, you might be trading on the M15 time frame but the engulfing candle is forming or has already formed in the H4 time frame. This indicator is made to do that on your behalf. You can trade on any time frame and see Engulfing candles of another time frame, this means that
FREE

Ever wanted to use MACD like you see in TradingView??? Now you can use this indicator to use same MACD in your MetaTrader5 and enjoy more time in Trading.. You can change MACD settings if you want to change and it will be ready to use for you... Now you will not spend time in TradingView to use only indicator there... Open charts , load Indicator and you are ready to do analysis in MetaTrader5 and Put Trades when you feel okay with your analysis.
FREE

This is my version of the famous VWAP indicator.
Channel Group: Click Here
You get: - Default VWAP Line - First and second deviation zones - Previous day levels Very simple to use, one of the best tools for day trading. Can be used on any TF and on any symbol. Don't use for entries, use as a trend filter. Add supporting indicators
I would recommend to use the indicator on either 15M or 5M chart.
FREE

该 Pz 振荡器 是一款非常平稳和灵敏的加速计,它提供了很多有用的信息,并自动检测背离。它可以用来识别趋势的方向和强度,以及确认。它被设计用于我们的交易工具的补充。
趋势方向 该振荡器绘制两条均线来显示趋势的方向。如果快速均线上穿慢速均线, 市场行情处于涨势,并且多头交易可下单。同样地,如果快速均线下穿慢速均线,市场行情处于跌势,空头交易可下单。 其它识别市场行情趋势的方式是通过直方图的绝对值。如果直方图的值高于零轴, 市场行情为涨势。如果直方图的值低于零轴, 市场行情为跌势。
趋势强度 趋势强度 (或速度) 由直方图描述。一根蓝色柱线代表多头冲量,而红色柱线代表空头冲量。如何处理这些任意给定时刻的信息,取决于市场的趋势。如果在跌势当中出现多头冲量,它意味着跌势衰竭,并且停止加速。同样地,如果在涨势当中出现空头冲量,它意味着涨势衰竭,并且停止加速。
背离 该指标自动检测并绘制常规和隐藏的背离, 并在它们出现时可用于交易, 但并非意味着 立即 交易。若要背离交易成功,您必须一并考虑趋势方向和强度,解释如上所述。以下是一个空头背离的完美情况: 振荡器的快速均线高于零轴 振荡器显
FREE

Highly configurable CCI indicator. Features: Highly customizable alert functions (at levels, crosses, direction changes via email, push, sound, popup) Multi timeframe ability Color customization (at levels, crosses, direction changes) Linear interpolation and histogram mode options Works on strategy tester in multi timeframe mode (at weekend without ticks also) Adjustable Levels Parameters:
CCI Timeframe: You can set the current or a higher timeframes for CCI . CCI Bar Shift: you can set
FREE

Special Offer ... It is totally free for all. New one coming soon...................
About This Indicator: RSI vs SMA Indicator: A Comprehensive Technical Analysis Tool for Better for Identify the Short and Long Signals.
The RSI vs SMA Indicator is a powerful technical analysis tool designed to understanding Market Price Fluctuation for Long or Short signals. This user-friendly Indicator good for both novice and experienced traders, providing valuable indication in price chart and separate wi
FREE

O indicador imprime a linha da média longa quando as médias media e curta estão confinadas dentro dos limites de 1 ATR (average tru range) da média longa. Após períodos de congestão os preços se movimentam fortemente em uma direção. Este indicador não fornece pontos de entrada, apenas mostra que as médias estão bastante próximas. Parâmetros: Periodmalongo: Período da média longa. Periodmamedio: Período da segunda média. Periodmamedio2:Período da terceira média. Periodmacurto: Período da média cu
FREE

Supply or demand zones refer to price areas where a significant amount of supply or demand had previously entered the market, causing prices to either fall or rise. If the price returns to the demand or supply zone, it is likely to bounce off due to the large number of orders previously placed within the zone. These orders will be defended in these areas.
The Fair Value Gap (FVG) is a concept used to identify imbalances in the equilibrium of buying and selling. Fair Value Gaps are formed in a

A pin bar pattern consists of one price bar, typically a candlestick price bar, which represents a sharp reversal and rejection of price. The pin bar reversal as it is sometimes called, is defined by a long tail, the tail is also referred to as a “shadow” or “wick”. The area between the open and close of the pin bar is called its “real body”, and pin bars generally have small real bodies in comparison to their long tails.
The tail of the pin bar shows the area of price that was rejected, and
FREE

Imbalance / Fair Value Gap (FVG) , this is a zone / gap created when the price move with force in a given direction. It identify a zone where the price could potentially go back. This gives perfect targets for your trades.
Imbalance is created from the high and low of 3 candles. When the wicks the of 1st and 3rd candle does not fully overlap the middle one.
This indicator will help you to easily spot mitigated/unmitigated imbalances in your chart. NEW UPDATE: Added Multi-Timeframe feature
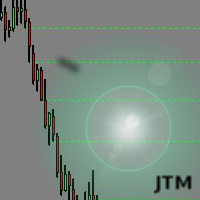
This indicator scanning thorough the history and drawing horizontal rays on all bars untested lows and highs. Fresh supply/demand zones and support/resistance levels will be marked down. It allows to be sure that certain levels is fresh and has not been tested yet. Usually after strong departure price is not retesting base immediately and leaving unfilled orders. There is no inputs, so indicator is ready to go.

This code snippet is a comprehensive Expert Advisor (EA) developed for the MetaTrader platform, utilizing or MQL5 programming languages. The EA, named "CHOPPA BOT," is designed to automate trading strategies based on a combination of technical indicators, including the Relative Strength Index (RSI), Parabolic SAR, Exponential Moving Averages (EMA), Simple Moving Average (SMA), and the Average Directional Movement Index (ADX). Here's an overview of its functionality: Initialization and Setup : Up
MetaTrader市场是您可以下载免费模拟自动交易,用历史数据进行测试和优化的唯一商店。
阅读应用程序的概述和其他客户的评论,直接下载程序到您的程序端并且在购买之前测试一个自动交易。只有在MetaTrader市场可以完全免费测试应用程序。
您错过了交易机会:
- 免费交易应用程序
- 8,000+信号可供复制
- 探索金融市场的经济新闻
注册
登录