适用于MetaTrader 5的EA交易和指标 - 18

this is a highly profitable semi-auto grid strategy.
MT4 Version
======== Usage======== :
Symbol: Any Main pairs Timeframe: H1 or higher Recommend Lots: 0.01 per 1000 USD
Note: Grid strategy is alwasy with some risk due to the increasely accumulated risk lots. but the high profit makes such strategy still being popular no matter how forex industry developed.
semi-auto trading should be the best way to equilibrate profit and risk. this EA has integrated many useful options for user t
FREE
CAP Ichimoku EA MT5 trades using the Ichimoku Kinko Hyo Indicator. It offers many customizable Ichimoku trading scenarios and flexible position management settings, plus many useful features like customizable trading sessions, a martingale and inverse martingale mode. [ Installation Guide | Update Guide | Submit Your Problem | All Products ]
Functions Easy to use and customizable Ichimoku setting. Customizable indicator settings Built-in money management Grid trading when trade in Los
FREE

The Expert Advisor is used to create Renko chart, realtime updates, easy for technical analysis. Backtest your strategy with all indicators with Renko chart in MetaTrader 5.
Parameters Box Size : input the number of box size. Show Wicks : if true , draw a candle with high/low. History Start: input the date to creat first candle.
Maximum Bars: limit number of bars on renko chart
How to use Attach the Expert Advisor to a chart (timeframe M1), for which you want to create a renko. Input box siz

How many times have you looked for a PIVOT that works on a specific candle every day?
Many traders like to estimate the direction of the day's trend based on a specific time each day, such as 30 minutes after the market opens, or at 12 noon, and so on.
This indicator allows you to specify a certain time (hour and minute) and plots a pivot from that time to the next day at the same time. It shows five lines based on that specific candle/hour: median, maximum, minimum, support and resistance.
FREE

Introduction The "Ultimate Retest" Indicator stands as the pinnacle of technical analysis made specially for support/resistance or supply/demand traders. By utilizing advanced mathematical computations, this indicator can swiftly and accurately identify the most powerful support and resistance levels where the big players are putting their huge orders and give traders a chance to enter the on the level retest with impeccable timing, thereby enhancing their decision-making and trading outcomes.
FREE

This indicator shows the TLH and TLL and some trendlines that allow us to estimate the trend of market. It also shows the values of the angles of the lines in percentage in points (pip) , the standard deviation, and the trend of each line, and when it breaks the lines of support and resistance (TLH and TLL). And finally, it also shows the points identified as supports and resistances through the fractal algorithm in the graph. The high and low trend lines are supported by the highs and lows, th
FREE

The " YK Find Support And Resistance " indicator is a technical analysis tool used to identify key support and resistance levels on a price chart. Its features and functions are as follows:
1. Displays support and resistance levels using arrow lines and colored bands, with resistance in red and support in green.
2. Can be adjusted to calculate and display results from a specified timeframe using the forced_tf variable. If set to 0, it will use the current timeframe of the chart.
3. Uses
FREE

The RenkoChart tool presents an innovative and highly flexible approach to visualizing market data in MetaTrader 5. This expert creates a custom symbol with Renko bricks directly on the chart, displaying accurate prices at the respective opening date/time for each brick. This feature makes it possible to apply any indicator to the Renko chart. Furthermore, this tool also allows access to historical brick data through native methods in the MQL5 programming language, such as iOpen, iHigh, iLow and
FREE

Что такое Heiken Ashi? Heiken Ashi — это метод построения графиков, который можно использовать для прогнозирования будущего движения цены. Он похож на традиционные свечные графики. Однако в отличие от обычного свечного графика, график Heiken Ashi пытается отфильтровать часть рыночного шума для лучшего определения трендовых движений на рынке. Как рассчитать Heiken Ashi?
Heiken Ashi использует формулу COHL, которая означает «Закрытие, Открытие, Максимум, Минимум». Это четыре компонента, кото
FREE

Free TrendLine EA opens trades whenever the price on the chart interacts with or crosses your trend line. You simply draw the trend line manually then let the EA do the trading automatically according to the rules you give it. The settings available in the EA are explained below: Lots : The lot size for trading. RiskPercentage : Set a value other than zero to activate lot sizing by use of percentage of margin. TrendLineName: The name of the line to track. You can either * rename the trend li
FREE

This indicator draw a line on high and low levels of X number of days. It is possible to have an alert (in the software and mobile app) for when the price breaks the high or low of the current day. Configurações: Days - past days to calculate (1 = actual day only).
Alert when reach levels - activate the alert for specific levels or both.
Push notification - enable the alert to the mobile MT5 app.
Appearance
High - high level color.
Low - low level color.
Size actual day - thi
FREE

The indicator displays volume clusters or volume profiles to choose from. For trading symbols which contain the tape of deals, the indicator can perform calculations based on the tape of deals.
Input variables
StepPoint - cluster step in points, if the value is zero, the step is assigned automatically. HistoryTicks - size of tick history (for VolumeType in the mode TimeAndSales). AssociatedTimeframe - binding the indicator to the specified timeframe of the chart, if the value is equal to

Holeshot MT5 is a highly effective reversion trading system that leverages the power of momentum, and custom trend indicators to detect high-probability trading opportunities U-Turn areas to exploit. When demoing the system use this link below to get sample set files for your account size:
Holeshot MT5 Demo Set Files
Launch Sales The Launch Sale is $250, the first 10 believers in this product would receive this outstanding EA at our launch price. ***Buy Holeshot MT5 and you could get the P
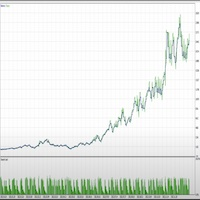
** For MT4 version, please go to https://www.mql5.com/en/market/product/112577 Backtested with Broker: Pepperstone Demo Symbol: EURUSD Time period: M5 Date: 2022-01-01 to 2022-12-31 Version: 1.70 --- Setup explanation for RTB or MetaTrader: https://www.youtube.com/live/HmM4rWT49M8?si=SISPJ5DvW9iazOBE&t=3865 Parameter explanation: https://kelvinausoftware.com/rtb-parameter-explanation/ --- Introducing the Realistic Trading Bot (RTB) – Your Trusted Trading Companion! Are you looking for a powe

Highly configurable Trader Dynamic Index (TDI) indicator.
Features: Highly customizable alert functions (at levels, crosses, direction changes via email, push, sound, popup) Multi timeframe ability (higher and lower timeframes also) Color customization (at levels, crosses, direction changes) Linear interpolation and histogram mode options Works on strategy tester in multi timeframe mode (at weekend without ticks also) Adjustable Levels Parameters:
TDI Timeframe: You can set the lower/higher
FREE

This indicator shows OutsideBars (OB) and InsideBars(IB) in the chart in candle form.
The colors of the candles can be set individually. Also different colors for bearish and bullish IBs or OBs are possible.
In addition, the color of the wicks or Outlines can also be set.
OutsideBars and InsideBars often show good zones for support or resistance. See the Screenshot for some examples.

The Nadaraya Watson Envelop indicator for MT5 is a popular tool used by traders to identify trends and potential buy/sell signals. The indicator is based on a non-parametric regression model that uses kernel smoothing to estimate the underlying trend of the market. The resulting envelopes are then plotted around the trend line, providing traders with an indication of where prices are likely to fluctuate. One of the key features of this indicator is its ability to send alerts, emails, and notific

欢迎使用双峰指标 MT5 --(双顶/双底)-- 双顶底指标是一种技术分析工具,旨在识别市场中潜在的反转模式。
它确定了价格连续出现两个几乎相等高度的波峰或波谷,随后价格向相反方向移动的区域。
这种模式表明市场正在失去动力,可能已准备好趋势逆转。 *购买后联系我,向您发送 说明和步骤指南。 特征:
自动图表注释:指标自动在图表上标记双顶底形态 易于使用:该指标用户友好,可以轻松应用于 MT5 平台中的任何图表。 可定制:指标具有可定制的设置 自定义警报 。 适用于任何乐器。 该指标可与其他技术分析工具结合使用,以确定趋势方向和反转形态的潜在强度。 总的来说,双顶和双底指标是寻求识别市场潜在趋势逆转的交易者的强大工具。
其可定制的设置、警报和自动图表注释使其易于使用,
而其多时间框架分析和趋势确认功能为交易者提供了对潜在交易机会的宝贵见解。 如果你有任何问题随时问。

The DR IDR Range Indicator PRO plots ADR, ODR and RDR ranges for a given amount of days in the past. A key feature that appears is that it calculates the success rate of the ranges for the shown days. This indicator is perfect for backtest since it shows ranges for all of the calculated days, not just the most recent sessions. In the PRO version you can now: use fully customizable advanced statistics to base your trades on get an edge via calculating statistics on up to 3 different day period

50% discount for one week only
An expert based on artificial intelligence and neural network
99% of this expert's strategy is in charge of artificial intelligence
A complex neural network with multiple filters
Experience multiple experts in one expert
I have provided you with several months of artificial intelligence training with powerful new and advanced computers (and several years of programming effort) at the lowest price.
Features of this expert:
Can be used:
in several dif
网格交易是一种有效的机械交易策略,它不依赖方向,不从波动中获利并且利用市场的内在波动性。它使用固定价格水平在一个或两个方向上进出交易。通常以20-200点子的间隔间隔的此类交易会创建交易网格。 [ 用户指南 | 安装指南 | 更新指南 | 故障排除 | 常见问题 | 所有产品 ]
好处
易于设置和监督 它是不受时间限制的 无需指标或严格分析 交易价格范围,而不是交易设置 几乎不需要市场预测 定期从市场中提取资金
特征
它可以做多,做空或双向交易 它可以交易许多同时交易的符号 交易者可自行决定关闭或暂停网格 实现定向和双向利润目标
它不交易开放式网格,风险有限 网格配置可以随时更改 风险和暴露被预先计算并显示 它实现了三种不同的行为
它适用于外汇,差价合约和期货 可以说,这是您将找到的最灵活的Grid Trading EA,并且可以以多种不同的方式使用它。
如何开始 将EA加载到任何图表和时间表 选择交易方向(买,卖或双向)
编辑交易的间隔和数量,直到风险可以接受为止 启动网格
使用技巧 如果市场便宜,只做多交易 如果市场价格过高,仅做空 不必承

Revolutionize Your Forex Trading with The AI Prop Firms Forex Robot: Your Ultimate Scalping Solution For those seeking unparalleled success in prop firm trading, look no further than The AI Prop Firms Forex Robot. Powered by cutting-edge neural networks developed by Aura Black, this innovative tool is designed to elevate your trading to new heights. Unlock Your Trading Potential: Neural Networks Mastery: Harness the power of advanced neural networks for unparalleled accuracy in market analysis.

鞅。“Fobos iSAR”由 15 個獨立的區塊(迷你智能交易系統)組成,它們匯總利潤並隨著時間的推移分配回撤。
特點: 每個字符的單獨輸入數據。 交易品種可以重複(即使是 15 個相同的交易品種也會彼此分開交易)。 在一個交易賬戶上,您可以安裝多個具有不同設置的“Fobos iSAR”(觀察條件:Magic[i+1]>Magic[i]+15)。 安裝在任何一張圖表上。 對沖賬戶類型。 對於具有 4 位報價的經紀商,“TakeProfit”參數數據必須與 5 位報價一樣輸入(即乘以 10)。 進入市場的信號是價格突破 iSAR_2 指標。此外,入場交易是根據 iSAR_1 指標的數據進行的。平倉信號 - 止盈。
顧問必須針對所用賬戶的交易條件進行優化: 優化示例 此處 。 Fobos_iSAR_1.set 初學者信息(常見問題解答): “file.set”包含輸入參數的值。 要將它們安裝在顧問的菜單中,請選擇“加載”並選擇所需的“file.set”。 您可以在“ 此處 ”看到視覺描述。 顧問“Fobos iSAR”的輸入參數: PERIOD_: 設置 EA 交易的時間框架(

Supply and Demand indicator does not repaint as it counts the number of tests/retests occurred in the past x number of times. As a trader you need a path to be able to place your buy and sell trades such as: Supply and Demand, Falling & raising channels . Experienced trades will draw the key levels and channels around the timeframes. But, they will not be able to draw them on the small time frames as the price changes too frequent. This indicator is based on Shved supply and demand indicator, b
FREE

Easy and Smart Trade Manager. Take your trading to the next level with it. This assistant has everything you need to do that. MT4 version
Basic features: Works with any FX, Crypto, Indices, Futures etc Several volume calculations methods, included risk calculation based on StopLoss level Several BreakEven modes Time close, timeout close and orders expiration Cancel pending orders level (OCO) Real and virtual StopLoss and TakeProfit One Click open and close trades Screenshots of your trades Cus
FREE

TRADECOPY CLIENT MT5 Over the years I developed TradeCopy MT4/MT5 for that purposes: I'm running several experts on one and/or different terminals and accounts. The trades opened by those experts, usually will not move straight away into profit zone. Very often they use to pullback more or less before end up in profit (or in loss finally...). To improve the profits and avoid possible drawdowns of trades that have been opened by the accounts that are running the TradeCopy Master MT4/MT5 was

HighQualityMap是一个很好的中长线交易指示器,这个指标可以单独使用,尤其是用在M30或者大于M30的时间框架下,它能很好的体现出趋势的走向,以及转折点,你可以很快的从这个指示器上寻找到最佳的buy和sell位置,同时也能很好根据指示器去坚守自己的持仓定订单。指标不含有未来函数,不会重新绘制,不仅能够应用到自己的手动交易过程中,还能完全可以写入到自己的EA中。(如果你感觉到这个指标能够帮助你进行更准确的交易,请帮忙给个好评,希望我的作品能够帮助更多有需要的人) ===================参数列表===================== 所有参数均采用默认参数即可,无需更改,若为激进型交易者,可以根据自己的需要来调整参数。 =================参考使用方法=================== 此指标可以适用于任何交易品种,使用周期框架大于M30相对更准确。

The Real Ticks Recording Indicator for MetaTrader 5 backtesting is a powerful tool designed to enable traders to simulate their trading strategies with utmost accuracy and realism. This indicator captures and stores real market ticks, allowing you to replay past market conditions with extreme fidelity, thereby enhancing the precision and reliability of strategy tests. Key Features: Real-Time Tick Capture: The indicator records each market price movement in real-time, ensuring an accurate represe

此儀表板是與市場結構反轉指標一起使用的警報工具。它的主要目的是提醒您在特定時間範圍內的逆轉機會,以及像指標一樣重新測試警報(確認)。儀表板設計為單獨放置在圖表上,並在後台工作,以向您發送有關您選擇的貨幣對和時間範圍的警報。它是在許多人要求衝刺以同時監控多個貨幣對和時間框架而不是讓市場反轉指標在一個 MT4 中的多個圖表上運行之後開發的。它會在 M5、M15、M30、H1、H4 和 D1 時間範圍內發出警報。當然,與交易中的任何事情一樣,更高的時間框架效果最好。 我創建的用於繪製矩形並提醒特定貨幣對的市場結構變化的指標運行儀表板。 儀表板僅允許您監控多個貨幣對和時間範圍,並在打開一個圖表時收到警報。
該儀表板被設計為市場結構反轉指標的附加組件。它將獨立工作,並提醒市場反轉警報指標給出的模式和信號。 在此處獲取市場反轉警報指標的 MT5 版本: https://www.mql5.com/en/market/product/46295 此儀表板的 MT4 版本在這裡: https://www.mql5.com/en/market/product/62751/
指標輸入/設置:

Moving Average Trend Alert is a triple MA indicator that helps traders to identify potential market trends based on 3 MAs alignment and crossover.
Moving Average Trend Alert features: Customizable short-term, medium-term, and long-term MAs. Option to filter signals based on a minimum distance between moving averages to avoid premature MAs alignment. Optional Filter of signals with RSI indicator overbought/oversold levels. Optional Filter of signals with ADX indicator. Popup, email, and phone n
FREE

Original supertrend indicator in Tradingview platform. Indicator type: Price Action indicator Introduction: The Supertrend Indicator - Enhancing Your Trend Analysis. If you haven't yet found a Supertrend indicator with good graphics on the MQL5 platform, this is the indicator for you. Overview: The Supertrend Indicator is a powerful tool designed to provide traders with valuable insights into the current and historical trends of financial markets. It serves as a valuable addition to any t
FREE

RSI Entry Points is the upgrade of the standard RSI indicator to avoid lagging. Indicator draws the clouds and the arrows to have clear picture where price is and what to wait for. Why standard RSI is lagging? because mostly we do not use it correctly and it is with very weak visual flexibility, less informativity. With my current upgrade I tried to Fix both problems same time and I got much better results and more exact entries than standard RSI has. To make yourself sure check out the screens

This EA is easy to use, it does not have too complicated settings and algorithms for performing trading operations. It’s not optimized for long, it may appeal to those who recently decided to engage in trading on the exchange with the help of advisers, or who do not want to understand the settings for a long time. The basis of his work is several indicators (moving average, RSI, stochastic, ATR). Despite its simplicity, it has a custom trailing stop function, which can reduce the risks for a dep

Hello, my name is Alexander. I would like to introduce you to my new development, the Prometheus New Generation advisor. The advisor is synthesis of two strategies: breakthrough strategy and level strategy. To reduce losses, the advisor uses division into several stop orders.The EA works well on Gold pair. The advisor has shown stable performance for more than 10 years. It does not use dangerous trading methods such as martingale, etc. All transactions are protected by take profit and stop loss

隆重推出 HydraAlchemist,一种创新的自动交易工具。 这款尖端的智能交易系统 (EA) 巧妙地结合了多种技术指标,以精确发现金融市场上有前景的交易机会。 我们的目标是用自己的逻辑仔细审视MACD、随机指标、RSI等指标所获得的信号,准确把握市场趋势和转折点,从而实现利润最大化。
“HydraAlchemist”的真正优势在于它基于真实的交易策略。 虽然市场上许多黄金 EA 依赖于简单的网格/鞅系统并重复风险交易,但这款 EA 采用了不同的方法。 通过整合多种策略并无缝协作,实现稳定的增长曲线。 该设计足够强大,可以适应现实世界的市场条件,而不会受到回测结果的影响。
易用性也是《HydraAlchemist》的一大特色。 直观且易于理解的设置屏幕使您可以用很少的参数执行最佳的交易策略。 此外,虽然它是一个完全自动化的交易系统,但它适当地管理了每笔交易的风险并确保了安全。
“HydraAlchemist”适合各个级别的交易者,从初学者到专业人士,将成为提高您的投资组合质量的强大盟友。 特别是,在交易 5 分钟黄金 (XAUUSD) 时,您可以从最低余额 500 美
FREE

This LEGIT Indicator Can Accurately Predict the Outcome of One Bar.
Imagine adding more filters to further increase your probability!
Unlike other products, Binary Options PRO can analyze past signals giving you the statistical edge.
How Increase Your Probability
Information revealed here www.mql5.com/en/blogs/post/727038 NOTE: The selection of a Good Broker is important for the overall success in trading Binary Options.
Benefits You Get
Unique algorithm that anticipates price weaknes

The indicator automatically identifies the 1-2-3 pattern on the chart. The indicator is able to monitor the formation of pattern in real time. It informs the trader when the pattern is completely formed (when the price breaks the line in point 2) and displays the completed patterns in history. The patterns are never redrawn. The indicator can identify patterns on any instruments (currency pairs, stock market, gold, etc.) without the need to adjust to each instrument. Simple and clear visualizati

该指标分析分形的价格结构并确定市场动态中可能的反转点。 分形可用作支撑位和阻力位
优点:
适用于所有仪器和时间序列, 不重绘其结果, 指示元素的可定制颜色, 与任何趋势策略完美搭配, 调整分形的强度。
MT4 版本指示器 -> 这里 / AW 分形 EA MT5 -> 这里
战略:
分形是蜡烛的组合,形成楔形的几何图形,中心有一个峰。也就是说,当平均价格处于峰值并且峰值之前的后续价格和前一个价格位于峰值蜡烛的下方或上方时。这些标记可以用作支撑位和阻力位。 AW 灵活分形是一种指标,它不是立即指示信号,而是由于分形的结构而有延迟。 要检测变量“分形每侧的蜡烛数”中的信号,您可以调整分形中心点每侧的柱数。 默认设置使用值“2” - 这意味着当相对于中心(上部)分形每侧都有 2 个较低的条时,将设置信号。其中,每侧最接近分形的一个将是中间的一个,下一个将是该组中最低的一个。当形态中的所有柱均闭合时,指标将绘制分形。 交易者可以调整分形的类型: 当使用“全分形”类型时,将会有更多信号,因为到达的信号的分形图不必是精确的。 当使用“强分形”类型时,接
FREE

Have you missed any tools or shortcuts in Meta Trader? Simple things that would make your daily trading much easier ?
We have the solution for you: our Trade Panel!
This is an EA tool (Expert Advisor) that, if configured to controll all symbols, needs to be loaded only once.
This is the Lite version (free) of our tool. Professional version: https://www.mql5.com/en/market/product/42658 If you have some problemas with the shortcut buttons on chart on unpinned mode try change the tickets d
FREE
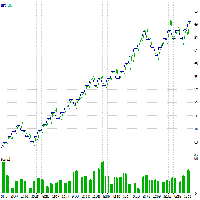
Strategy description The idea is to go with trend resumption. Instruments Backtest on XAUUSD shows profitability over a long period even without any specific optimization efforts. However applying optimization makes it even better.Backtest details: Simulation Type=Every tick(Most accurate) Expert: GoldScalper Symbol: XAUUSD Period: H1 (2020.01.01 - 2023.02.28) Inputs: magic_number=1234 ob=90.0 os=24.0 risk_percent=2.64 time_frame=16385 Company: FIBO Group, Ltd. Currency: USD Initial Deposit: 100
FREE

MACD Divergence Scanner is a multi-timeframe and multi-symbol dashboard and alert that checks all timeframes and symbols to find regular and hidden divergences between price chart and MACD indicator. This divergence scanner is integrated with support and resistance zones so you can check the MACD divergences in the most important areas of the chart to find trend reversals in the price chart. Download demo version (works on M4,M5,M6,M12,H3,H8 timeframes) Full description of scanner parameters

Advanced Market Analysis Tool : Dive into market depth with the MT5 Volume Profile Indicator. Seamless MT5 Integration : Perfectly compatible with the MT5 platform. Enhances Pro Thunder v9 : Integrates smoothly with Pro Thunder v9 for deeper market insights. Detailed Volume Analysis : Explore market dynamics through in-depth volume data. ️ Simple Installation : Easy-to-follow setup steps for quick integration with MT5. Efficient Single Chart Application : Best used on a single c
FREE
实时滴答声和1分钟数据导出记录器
不幸的是,您经纪商的历史价格数据不准确,这意味着存在数据缺失(缺口)、价格不正确,这会导致回测结果不正确。
数据记录器将可选的刻度/1 分钟数据或两者实时单独保存在 CSV 文件中。每月一份文件。
全部采用 MT5 格式,以便可以轻松导入这些数据,以创建具有来自经纪商的准确数据和真实点差的自定义交易品种,以进行回测。
只需将指标添加到您想要记录的 1 分钟图表中,选择重新编码模式即可开始记录。
如果您还有任何其他问题或要求,我将很乐意随时为您提供帮助。
实时滴答声和1分钟数据导出记录器
不幸的是,您经纪商的历史价格数据不准确,这意味着存在数据缺失(缺口)、价格不正确,这会导致回测结果不正确。
数据记录器将可选的刻度/1 分钟数据或两者实时单独保存在 CSV 文件中。每月一份文件。
全部采用 MT5 格式,以便可以轻松导入这些数据,以创建具有来自经纪商的准确数据和真实点差的自定义交易品种,以进行回测。
只需将指标添加到您想要记录的 1 分钟图表中,选择重新编码模式即可开始记录。
如果您还

"BIG FIGURE INDICATOR" automatically identifies and draws horizontal lines on price charts at specific levels, such as whole numbers or half-numbers (e.g., 1.0000 or 1.5000 in currency trading). These levels are considered psychologically significant because they represent round numbers that big traders and investors may focus on, leading to potential support or resistance levels. The big figure indicator can help traders identify important price levels and make trading decisions based on these
FREE
CAP Stochastic EA Pro MT5 trades using the Stochastic Indicator. It offers many customizable Stochastic trading scenarios and flexible position management settings, plus many useful features like customizable trading sessions, a martingale and inverse martingale mode. [ Installation Guide | Update Guide | Submit Your Problem | All Products ]
Before buy Pro version? You can buy alternation pro version, our powerfull EA, CAP Strategy Builder EA . This is strategy builder EA. It produc
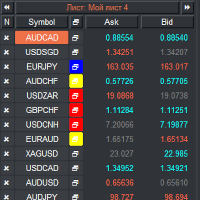
VR 观察列表和链接器 是 MetaTrader 终端的筛选器应用程序。使您更容易找到最有趣和技术性的金融工具。该筛选器供交易者在bybit、莫斯科交易所、美国交易所、外汇和加密货币市场、金属市场等交易所进行交易,并用于自营公司的交易。金融工具的选择是手动进行的。筛选器连接 MetaTrader 终端中打开的图表,并在更改金融工具时单独显示每个图表中的数据。 设置、设置文件、演示版本、说明、问题解决,可以在 [博客] 中找到
您可以在 [链接] 阅读或撰写评论
[MetaTrader 4] 版本 使用筛选器可以帮助交易者找到最具技术性的金融工具,并排除流动性低、风险高的工具的交易。筛选器使您可以轻松快速地创建和更改带有股票行情的工作表,快速添加和删除工作表中的股票行情。在所有图表上保存和加载交易者加价和指标。直接从筛选器交易金融工具。应用预先准备的策略。 VR 监视列表和链接器 - 支持使用热键 - 这使您可以直接从键盘操作工作表,几乎无需使用鼠标。通过这种方法,交易者可以选择多种金融工具在白天进行交易。 筛选器被设计为顾问,需要多个打开的图表才能工作。 在策略测试器中不起作用。
FREE

This indicators automatically draws the support and resistances levels (key levels) for you once you've dropped it on a chart. It reduces the hustle of drawing and redrawing these levels every time you analyse prices on a chart. With it, all you have to do is drop it on a chart, adjust the settings to your liking and let the indicator do the rest.
But wait, it gets better; the indicator is absolutely free! For more information: https://youtu.be/rTxbPOBu3nY For more free stuff visit: https
FREE

This is a derivative of John Carter's "TTM Squeeze" volatility indicator, as discussed in his book "Mastering the Trade" (chapter 11).
Gray dot on the midline show that the market just entered a squeeze (Bollinger Bands are with in Keltner Channel). This signifies low volatility, market preparing itself for an explosive move (up or down). Blue dot signify "Squeeze release".
Mr.Carter suggests waiting till the first blue after a gray dot, and taking a position in the direction of the mo
FREE

Ambrosia 交易由机构级别指标和中央枢轴工具创建的级别。
这些水平包括 CPR 区域、斐波那契水平、支撑和阻力、四分之一点等。专家顾问总共可以采用 26 种不同的入场选项/组合。
Ambrosia 每天都会根据前几天的价格走势计算新的枢轴和斐波那契水平。再加上对机构级别当前价格上下的持续观察,该专家可以交易多个重要的价格水平。 信号: - 群聊: https://www.mql5.com/en/users/conorstephenson 请在购买后与我联系以获取设置建议和免费专家顾问! 我的产品仅在 MQL5 上出售,如果您在其他任何地方看到此产品,那是仿制品。不要被愚弄。 主要特点 使用不同的价格水平进入交易 - 从 26 种条件中选择。 交易入场选项包括 - R1、R2、R3、S1、S2、S3,- 斐波那契点 '0.23、0.38、0.5、0.68、0.78',- 斐波那契区,- 机构/季度点水平 '000、200、250、500 , 750, 800'. 按不同时间框架趋势过滤条目的可选功能。 多功能专家顾问。 控制和管理交易的多种方式。 - 可以设置有或没有网格

This indicator finds Double Top and Double bottom Example : What is Double Top When price establishes a new high and then falls, then reverse to the same candle area of High then its considered a valid double top and vice versa for double bottom. 1. It plots and high and low on visible chart if ChartChange is set to true else it searches on new bar opening
2. If there is double top and double bottom found in visible chart window then it plots a line 3. It has options to customize text color, te
FREE

DO THE BACKTEST YOU WILL UNDERSTAND THE POTENTIAL OF THIS EA.
EURUSD - GBPUSD PAIRS ( FROM + OF ONE YEAR BETWEEN DEMO AND REAL WITH TWO ACTIVE PAIRS TOGETHER EURUSD - GBPUSD )
BACKTEST EVERY REAL TICK
$1500 time frame M5 lot 0.02 max dd $660 profit 5%-8% monthly $3000 time frame M5 lot 0.03 max dd $995 profit 8%-15% monthly FROM 3000 AND UP Backtest for DD EURUSD /GBPUSD ALL PAIRS LOW SPREAD. VPS AND ECN/STANDARD STP BROKERS ARE RECOMMENDED
The EA will open two COUNT TRADES righ

Peak Trough Analysis is the great tool to detect peaks and troughs in your chart. Peak Trough Analysis tool can use three different peaks and troughs detection algorithm. The three algorithm include the orignal Fractals Indicator by Bill Williams, the Modified Fractals indicator and ZigZag indicator. You can use this peak and trough analysis tool to detect the price pattern made up from Equilibrium Fractal-Wave process. For further usage, there are good guide line on how to use this peak trough
FREE

MASpeed是一个通用移动平均线,具有运动速度的指示。 当平均值移动得比阈值快时,线上的点就会出现。 阈值可以在设置中指定。 基于该指标,您可以构建各种各样的交易策略。 该指标有巨大的机会调整移动平均线-10种类型的平滑。 12价格选项来构建。 增加了对所产生的移动进行采样的可能性。 额外的优点是:快速和优化的代码,使用专家的能力没有限制,额外的缓冲区与有关指标的状态和位置的有用信息。 这种指标最常见的用途是冲动交易策略。 冲动交易是一种交易,包括在市场强劲和活跃的运动中打开交易。 这种头寸可以保持几分钟或在整个交易时段。 这一切都取决于势头有多强,以及是否有逆转的先决条件。 一般来说,动量与经典趋势的不同之处在于它更尖锐,更不稳定。 事实上,这样的运动没有明显的回调,市场只是陷入深渊或飙升。 脉冲的一个重要特征是增加的音量,这在会话期间不是仪器的特征。 MASpeed有助于确定脉冲开始的时刻。 关于这个指标的交易的一个很好的例子将是第一点的出现。 移动的第一个点,在线颜色变化后出现,打开了剥头皮交易的潜力。 期设置的特征。 指标的参数可以根据用户的要求进行配置。 他可以设置一个方便
FREE

Sessions are very important in trading and often good area where to look for setup. In SMC, ICT we will look for Asian session to serve as liquidity
This indicator displays: High & Low of the Asia session Midnight New York time opening line
Congifuration Line Style, color Label position, size, color Start of the level (Start of the day, Start of the session, Highest or Lowest point in the session)
Any questions or comments, send me a direct message here https://www.mql5.com/en/users/mvonl
FREE

Overview: The trading robot is an software designed to operate on the EUR/USD currency pair. It is optimized for an H1 (one-hour) trading timeframe, suitable for traders looking for a balance between short-term and medium-term trading strategies. Technical Indicators Used: Relative Strength Index (RSI): The robot incorporates the RSI to measure the velocity and magnitude of directional price movements. It helps identify overbought or oversold conditions in the trading of an asset. Bollinger Band
FREE

Synthetic indeces are one of a kind of forex markets. Specially, on boom and crash indices on M1 timeframe is really interesting. I always thought that it was impossible to catch spikes safely until today. Everything has it's limits. This EA is based on martingale strategy with low drawdown. Max grid level is 3. When each trades goes on drawdown, the next trade will be multiplied by 2. The EA does not use take-profit or stoploss . So the backtesting will show the same results as real-time tradi
FREE

Breakthrough Solution For Trend Trading And Filtering With All Important Features Built Inside One Tool! Trend PRO's smart algorithm detects the trend, filters out market noise and gives entry signals with exit levels. The new features with enhanced rules for statistical calculation improved the overall performance of this indicator.
Important Information Revealed Maximize the potential of Trend Pro, please visit www.mql5.com/en/blogs/post/713938
The Powerful Expert Advisor Version
Automa

The indicator plots a trend channel using the technique by Gilbert Raff. The channel axis is a first-order regression. The upper and lower lines show the maximum distance the Close line had moved away from the axis line. Therefore, the upper and lower lines can be considered as resistance and support lines, respectively. A similar version of the indicator for the MT4 terminal
As a rule, most movements of the price occur within a channel, going beyond the support or resistance line only for a s
FREE

该指标的独特之处在于交易量核算算法:在所选时段内直接进行累积,而无需参考当天的开始。可以从计算中排除最后的柱线,那么当前数据对之前形成的显着水平(交易量)的影响较小。 为了更精确的计算,默认使用 M1 图表中的数据。规范了价格量的分配步骤。默认情况下,显示的右边框设置为用于分析的数据开头对应的栏,但如果需要,可以设置为您需要的栏。显示的音量带的长度(右边界)由系数调节,也可以向左或向右移动到 0(当前)条或参照当前条进行镜像。 参数: Accumulation period - 累积量计算周期 Number of excluded last bars - 从计算中排除的最后一根柱线的数量 Accumulation price step - 按价格参数的成交量总和步骤 Graph length multiplier - 显示数据的长度比例 Use data from timeframe - 用于分析的图表(时间范围) Graph show shift - 开始显示数据的移位,如果留为0,则数据将从分析数据周期开始时间对应的条开始显示; “-1”——显示在左侧; “-2” - 显示

RSI EA ΜΤ5 是一种独特的全自动智能交易系统,用于交易众所周知且极其高效的相对强度指标,能够同时控制您的交易账户在篮子级别的利润和/或亏损,对于您所有未平仓头寸的组合. RSI EA MT5 有 4 种不同的交易相对强度指标的策略,在实时柱线的 RSI 极端值上开仓交易,在闭合蜡烛上的 RSI 极端值开仓交易和 RSI 水平交叉上的开仓交易。最后一种策略是相对强度指标的一种独特方法,因为它是一种趋势跟踪策略,而不是逆转策略。此 EA 附带为许多符号提供的设置文件,专门针对 ECN Raw Spread ICMarkets 帐户(基于纽约的 GMT+3 时区服务器)进行了优化。可能会使用其他经纪商或账户类型,但您可能需要进行任何必要的时间调整以适应您的经纪商/账户。 建议: 我的 EA 都不是能够预测市场的神奇产品。 相反,他们是诚实的、编码良好的专家顾问,旨在赢得更多而不是失去。 他们不采用鞅或网格策略,这意味着他们的结果不会始终显示出向上的利润曲线; 可能会有起伏。 他们的成功需要耐心和纪律。 我的一般建议是在策略测试器中测试所有提供的设置文件。 如果您发现任何有

This is actually just a combination of 3 classic TTM_Squeeze indicators, nothing special. As I know exactly this is implemented in original TTM_Squeeze PRO indicator. It shows strong, middle and weak squeeze. If someone interested, TTM_Squeeze is not completely John Carter's invention. Concept of squeeze is commonly known as well as the method of squeeze search using Bollinger Bands and Kelthner Channels. How to use
As always there is a lot of variations. For example here is simple strategy Us
FREE

EA名称:FXGAIN Genius Masaniello 描述:FXGAIN Genius Masaniello是专为外汇市场而设计的独家专家顾问,旨在通过应用著名的资本管理系统Masaniello来优化回报并减轻风险。该EA将先进的交易策略与渐进的资本管理方法相结合,为交易者提供了一个强大的工具,以持续实现其财务目标。 注意:我们不提供演示版本!如有任何问题,请通过Telegram与我们联系。页面底部有链接。 主要特点: Masaniello管理系统:该EA融合了Masaniello资本管理系统,根据账户表现和市场波动性调整仓位大小。这允许采用逐步和可控的方式增加投资,最大化利润并在成功期间最小化损失。 与专业Trading View信号集成:FXGAIN Genius Masaniello在市场上以其与专业Trading View信号无缝集成的能力脱颖而出。这使交易者能够接收和执行基于先进技术分析和经过验证的策略的高质量入场和出场信号,为市场提供了显著优势。 高级交易算法:该EA由一组外汇专家开发的先进交易算法驱动。这些算法持续分析市场数据,识别有利可图的机会,并以24小时,

策略基于价格与均线指标交叉, 并以 ADX 指标确认。 交易信号: 买: 最后完成的柱线收盘价高于均线, 当前以及最后完成的柱线所对应的均线在增长。 卖: 最后完成的柱线收盘价低于均线, 当前以及最后完成的柱线所对应的均线在降低。 出于过滤假信号,使用移动方向指数 (DI+ 和 DI-) 来检查趋势能量 (ADX>ADXmin) 和趋势方向。 输入参数: Inp_Signal_ADX_MA_PeriodADX = 48; Inp_Signal_ADX_MA_MinimumADX = 13.0; Inp_Signal_ADX_MA_PeriodMA = 50; Inp_Signal_ADX_MA_StopLoss = 400; Inp_Signal_ADX_MA_TakeProfit = 900; Inp_Money_FixLot_Percent = 10.0; Inp_Money_FixLot_Lots = 0.1.
FREE

Tom DeMark developed TD Sequential by hand, through a process of trial and error, in the 1970s. It never ceases to amaze me how something originally created to analyze daily price data can be applied so effectively, more than thirty years later, to any time frame—from one minute to one year—and to any market. The indicator has two components: TD Setup, which relies on momentum to define price ranges, and TD Countdown, which is trend based, and looks for low-risk opportunities to fade establishe

Closing Price Reversal is a very well known and traded candlestick pattern. This little indicator paints with specific (user-selected) colors the Closing Price Reveral Up and Down patterns, as well as the Inside Bars (as a bonus). Higher timeframes are more effective as with all other candlesticks patterns. Do NOT trade solely on this indicator. Search the web for "Closing Price Reversal" to learn about the several approaches that can be used with this pattern. One of them is combining short/me
FREE

Display Order box list from Trading box Order Management tool. Find contacts and manual links on my profile . This dashboard gives you an edge in forex trading because in few seconds you can decide which pair and timeframe is worth to watch more closely. This is how you will not be distracted by all other forex pairs that you trade, and you will not miss great opportunities to trade the best price.
Trading Dashboard (order box overview panel and Trading box Order management extension) Tr
FREE

Get all benefits of a grid strategy and none of its disadvantage | Built by a grid trader >> for grid traders.
This is MT5 version, click here for Blue Sonic Donchian MT4 (settings and logics are same in both versions) Real monitoring signal --> Sonic Gold | Sonic Fx Intro BlueSonic Donchian EA ('Sonic') is a next-gen multi-currency multi-timeframe EA base on Donchian indicator. Other than normal one-off entry, users would have option to activate grid series to maximize return f
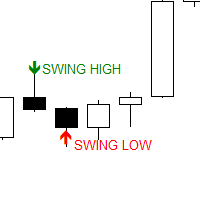
The Swing Point scanner scans for Swing High and Swing Low in real time and on the strategy Tester. It works on all time frames. Swing High is a candlestick High that has a Lower High on both side. Swing Low is a candlestick Low that has a Higher Low on both side.
Past Swing points are area where buy-side and sell-side liquidity can be found. This are areas where most traders place their buy and sell stops.
FREE

鞅。“Oberon iSAR MT5” 由 15 個獨立的區塊(迷你智能交易系統)組成,它們匯總利潤並隨著時間的推移分配回撤。
特點: 每個字符的單獨輸入數據。 交易品種可以重複(即使是 15 個相同的交易品種也會彼此分開交易)。 在一個交易賬戶上,您可以安裝多個具有不同設置的“Oberon_iSAR_MT5”(觀察條件:Magic[i+1]>Magic[i]+15)。 安裝在任何一張圖表上。 如果您的軟件功能低下,那麼在“Every_tick_based_on_real_tick”模式(啟用所有 15 個交易品種)下進行測試將很困難,或者可能會在加載貨幣對報價歷史時由於內存不足而結束。 在這種情況下,您可以減少輸入數據(“交易”參數)中的字符數或縮短測試週期。 但最正確的選擇是租用功能更強大的虛擬服務器 (VPS)。 對沖賬戶類型。 對於具有 4 位報價的經紀商,“Take_Profit”參數數據必須與 5 位報價一樣輸入(即乘以 10)。 槓桿 >= 1:100。 開倉信號是價格突破 iSAR 指標時(iSAR_1 和 iSAR_2 應該在價格的相反兩側)。平倉信號 - “T

A complete Session Timer that shows the current time, session information with remaining time, chart display of range (high-low) and open price, of current and previous sessions for major markets, and option to add an additional city. A friendly user interface with clickable icons, customizable panel location and format, selection of colors and text. It automatically handles the DST (daylight saving) settings. It also shows the GMT/UTC and server (broker) time. And includes a Candle timer option
FREE
MetaTrader市场是您可以下载免费模拟自动交易,用历史数据进行测试和优化的唯一商店。
阅读应用程序的概述和其他客户的评论,直接下载程序到您的程序端并且在购买之前测试一个自动交易。只有在MetaTrader市场可以完全免费测试应用程序。
您错过了交易机会:
- 免费交易应用程序
- 8,000+信号可供复制
- 探索金融市场的经济新闻
注册
登录