Смотри обучающее видео по маркету на YouTube
Как купить торгового робота или индикатор
Запусти робота на
виртуальном хостинге
виртуальном хостинге
Протестируй индикатор/робота перед покупкой
Хочешь зарабатывать в Маркете?
Как подать продукт, чтобы его покупали
Торговые роботы и индикаторы для MetaTrader 5 - 49

This is a bufferless indicator which can display classical X and O columns if applied on custom symbol charts built by Point-And-Figure-like generator PointFigureKagiCharts or its DEMO . The indicator will enforce a fixed price-scale on the chart to make sure the marks keep correct aspect ratio. The marks are shown only if the chart time-scale is large enough to hold them in the space allocated per bar (if the horizontal scale is one of 3 smallest ones, the indicator draws nothing and outputs a
FREE

Индикатор рисует актуальные уровни Фибоначчи для вашей активности торговли. Уровни перерисовываются заново, каждый раз, после касания цены минимума (0%) или уровня 100% фибоначчи. В параметрах выберите активность торговли: Долгосрочный инвестор Среднесрочный инвестор Среднесрочный инвестор активный Краткосрочный инвестор Краткосрочный инвестор активный Спекулянт Спекулянт активный Скальпер Скальпер активный Попробуйте этот индикатор в действии, и вам больше не придётся искать координаты отрисовк
FREE

- Chart Time Indicator is very simple and easy, but it can be very important to control the time before opening any manual trade. This indicator shows the time on the chart between 3 different options. Input Parameters: - Show Time : Select all the time options that you want to see. Local Time (Personal Computer Time), Server time (Broker Time) or GMT Time. Recommendations: - Use only one Chart Time Indicator for each Chart.
FREE

Индикатор делает расчеты по данным, получаемым из из одной из семи(7) скользящих средних и окрашивает график. Простые скользящие средние - это те, у которых всего один важный параметр расчета - период. Сдвиг в индикаторе не используется. Есть настройка shift trick она используется для сглаживания результата расчетов. Можно увидеть изменения, если уменьшить этот параметр до 1(минимальное значение). shift trick должен быть всегда меньше значения периода.
Доступные средние: MA Simple
FREE

Противоречивая пятиступенчатая система, которую используют трейдеры, чтобы добиться успеха в торговле! Reversal Pro эффективно объединяет движение цены, идеальную локацию и надежную статистику в одном умном алгоритме. Понимание рынка с учетом этой уникальной перспективы дает вам возможность профессионально распознавать развороты трендов.
Раскройте секреты профессиональных трейдеров
Получить мгновенный доступ www.mql5.com/en/blogs/post/716077 Скопируйте то, что профессиональные трейдеры дела

"Hypercon Pro MT5" - мультивалютный советник, основанный на классических стратегиях торговли. Точки входа в рынок определяются автоматически , учитывая особенности волатильности и текущую динамику торгуемой валютной пары. Для уменьшения рисков рекомендуется использовать центовые счета. Сигналы. Входные данные: 1. ОТКРЫТИЕ ПОЗИЦИИ "Period" : Таймфрейм графика определяет интенсивность открытия позиций. Чем меньше период - тем агрессивней торговля. "Choosing a strategy" : "Strategy 1: Lot from

Magic Finger can help you identify trends and trading opportunities clearly. The finger points to the open position signal, and the discoloration line is confirmed by the trend.
If you are a day trader, you can choose to trade during a period of active trading, referring to the discoloration line as the basis for the next order, finger signal as a filter.
If you are a trend trader, you can choose a period above H1, wait for the appearance of the finger signal in the key price area, and enter

ATR Monitor ATR is a measure of volatility introduced by market technician J. Welles Wilder Jr. in his book, "New Concepts in Technical Trading Systems". In general, traders are accustomed to seeing the ATR in the form of a sub-window indicator. What I am presenting here is a simplified version of ATR - just the current ATR number - very useful for monitoring just the very moment of the current chart. And, by default, this indicator will not show up on screen, you can just use the buffers thems
FREE

ScriptBot+ It is a robust programmable robot, designed to allow the user to develop their strategy quickly, with fewer limitations and a multitude of subsystems and triggers based on logical expressions.
Utility:
With ScriptBot+ , it is possible to convert a variety of TEXTS into logical expressions. These expressions, composed of Operators , Variables , and Functions , make it possible to perform calculations using data from indicators , charts , orders , or the client's account . By means

An easy indicator that simply shows the moment we connect to the market. We can easily see what has happened while we were gone because the line has two different colors that show the start time. It is only that, a visualization aid that allow us to mark the market behavior while it was night time in our country, or if we have stopped several hours. Input: Server start working date: Day of month Month Year Hour Minutes
FREE

NOW FREE!! It's crucial to note that, like any trading tool, ForexClimber EA doesn't guarantee profits. Forex trading carries risks, and market volatility means success is never certain. The pricing of ForexClimber EA is dynamic, and as it gains popularity, the cost for renting or buying may increase. Invest now to secure your place in Forex trading advancement. Seize the opportunity, navigate the markets, and let ForexClimber EA support your Forex trading aspirations.
FREE
PANEL OF TOPOS AND HISTORICAL BACKGROUNDS This is a panel that does not open orders only manages all Symbols and calculates the tops and bottoms and presents the calculation in relation to the top and bottom in 5 Years, 2 Months and 1 Week.
It is ideal for filtering the pairs that are in the good regions to operate. You can filter the range and choose whether to consider the body or shadow of the candle in the monthly. Good luck...
FREE

Traders Dynamic Index (TDI) MetaTrader indicator — a comprehensive but helpful indicator that uses RSI (Relative Strength Index), its moving averages, and volatility bands (based on Bollinger Bands) to offer traders a full picture of the current Forex market situation. Here is single timeframe product. Once puscharse this indicator, you free to use MTF scanner (free at here ) The Traders Dynamic index TDI indicator is the next generation of the popular Trader Dynamic index indicator dev

MetaCOT 2 - набор индикаторов и специализированных утилит для анализа отчетов американской коммиссии по товарным рынкам CFTC (U.S. Commodity Futures Trading Commission). Благодаря отчетам, издаваемым комиссией, можно анализировать размер и направление позиций крупных участников рынка, что выводит точность долгосрочного прогнозирования цены на новый, более качественный уровень, недоступный большинству трейдеров. Данные индикаторы, относящиеся к фундаментальному анализу, также можно использовать,
FREE

Новостной индикатор. Показывает учётную ставку 12 стран(Австралия, Бразилия, Канада, Мексика, зона евро, Великобритания, Индия, Новая Зеландия, Швейцария, Соединенные Штаты, Южная Корея, Япония). Поможет проанализировать влияние учётной ставки на курс валют. Устанавливать индикатор имеет смысл на большие таймфреймы. Для улучшения информативности, есть смысл, изменить в настройках стиль индикатора нужной страны, таким образом, чтобы линия выделялась из общей массы индикаторов, как указано на перв
FREE

Simple indicator to calculate fibonacci retracement levels on time. Add to chart and move trend line to set the fibonacci retracement levels. Inputs Levels - levels for which to calculate values, separated by space, default are fibonacci levels Show time - if true, time will be shown on levels Show date - if true, date will be shown on levels Show fibonacci level - if true, value of levels will be shown Fibonacci lines color - color of levels Trend line color - color of trend line which de
FREE

Smart Gridder MT5 основан на RSI и полосах Боллинджера. Оптимизированные настройки будут представлены ниже. Стратегия советника основана на пересечении свечой полос Боллинджера, и RSI будет решающим фактором, откроет ли он сделку на покупку или продажу. Размер сетки будет рассчитан автоматически.
ОПТИМИЗИРОВАННЫЕ НАСТРОЙКИ:
МИНИМАЛЬНЫЙ ДЕПОЗИТ: счет в 400 центов
EURUSD - https://drive.google.com/file/d/1BVz5ad8kwgz7NcJCNr0mfQzGurc53u1t/view?usp=sharing GBPUSD - https://drive.goog

To calculate strength of currencies and to show in table There is 1 parameter: . Show recommended pairs: true/false -> To show top 1 of strong and weak currency Tips to trade: . To trade only with strongest vs weakest currency . When H1, M30, M15, M5 of specific currency is up or down -> consider to open BUY/SELL . It can combine: + strongest currency vs weakest currency + strongest currency vs 2nd weakest currency + 2nd strongest currency vs weakest currency
FREE

Данный индикатор показывает объем каждого бара (видимый диапазон) в пунктах. Гибкие настройки отображения значений. Возможна настройка параметров показа. Индикатор создавался для личного пользования, анализа графиков. Параметры: Color - цвет текстовых меток; Position - позиция метки: 0 - снизу, 1 - сверху; FontSize - размер шрифта; Angle - угол наклона текста; GapPoints - отступ по вертикальной оси.
FREE

Свечной паттерн «Молот» формируется одной единственной свечой. Вот как определить свечной паттерн «Молот»: У свечи маленькое тело. Фитиль внизу должен быть большим по сравнению с телом. Вверху он не должен иметь фитиля или быть очень маленьким. Цвет тела не имеет значения Этот бычий свечной паттерн из 1 свечи является разворотным паттерном, то есть он используется для поиска оснований. По этой причине мы хотим увидеть эту модель после движения вниз, показывая, что быки начинают брать контроль.

Мультитаймфреймовый трендовый индикатор, на основе индикатора ADX / ADXWilder Индикатор показывает трендовые участки, используя данные индикатора ADX или ADXWilder с нескольких таймфреймов. Импульсный режим индикатора позволяет поймать начало тренда, а несколько "Экранов" с разными таймфреймами позволяют отфильтровать рыночный шум.
Принцип работы индикатора: если PDI больше NDI, то устанавливается бычье движение; если PDI меньше NDI, то устанавливается медвежье движение; для определения какого
FREE
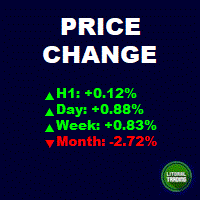
This is an informant indicator, very simple. It shows how much the price has chanded in percentage in certain period (month, week, day and actual period). It is discreet and small, does not visually posslute the chart. If your MT is not on portuguese idiom the indicator will automatically change to english. Check out our most complete tool for the market, the Trade Panel: https://www.mql5.com/en/market/product/42658 If you have any suggestion or find any bug, please, contact us. Enjoy!
This i
FREE

The Vwap Bands Auto indicator seeks to automatically map the maximum market frequency ( automatic update of the outermost band ) and has two intermediate bands that also adjust to daily volatility.
Another tool from White Trader that combines price and volume, in addition to mapping the daily amplitude.
The external band is updated automatically when the daily maximum or minimum breaks the current frequency, and can be an input signal, seeking a return to the daily vwap.
Thus, in ad

Mean Reversal Heikin Ashi Indicator calculates special trade reversal points based on Heikin Ashi candlesticks patterns. This indicator can be used on all symbols, even in Forex or B3 Brazillian Markets. You can configure just the position of each arrow. Then, after include the indicator on the graphic, pay attention on each arrow that indicates a long or short trade.

I do not have the exact indicator for MT4 but the nearest possible look alike can be downloaded from here . Also you may check this link . This is the exact conversion from TradingView: "Donchian Trend Ribbon" By "LonesomeTheBlue". One of the coolest indicators out there to detect trend direction and strength. As a trader you always need such indicator to avoid getting chopped in range markets. There are ten buffers as colors to use in EAs also. The indicator is loaded light and non-repaint. Not

"2nd To NoneFX Scalper" is one powerful indicator which you can use on any timeframe. The accuracy is in between 90% - 95% can be more. The indicator is 100% non repaint so it doesn't repaint at all. When the arrow comes out wait for the candlestick to close the arrow won't repaint/recalculate or move. The indicator works with all volatility indices,step index, Boom & Crash(500 & 1000) and all currency pairs. You can change settings of the indicator. For great results find the trend of the pair,

This Oscillator describes the drift of an asset, as part of the geometric Brownian Motion (GBM). As a data basis the mean reverting log returns of the asset price is considered. It gives the percentile of drift directional. For instance, a value of 0.05 means a drift of 5%, based on the selected sample size. If the value is positive, drift to higher asset values is determined.
This indicator should be used in confluence with other indicators based on volatility, probability and statistics. L
FREE
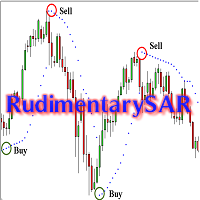
Для тех, кто любит простоту. Работа эксперта очень простая, используется минимум настроек. Для сигнала используется один индикатор Parabolic SAR (Parabolic Stop and Reverse system). У него всего один буфер. Входной сигнал формируется при изменении направления индикатора. Когда точки над ценой закончились, и появилась первая точка под ценой – это сигнал на покупку. Если точки под ценой закончились, и появилась первая точка над ценой – это сигнал на продажу (есть на рисунке). Уровни стоп-лосса, те

To get access to MT4 version please click here . - This is the exact conversion from TradingView: "Twin Range Filter" by " colinmck ". - This is a light-load processing and non-repaint indicator. - All input options are available. - Buffers are available for processing in EAs. - You can message in private chat for further changes you need. Thanks for downloading

To get access to MT4 version please click here . Also you can check this link . This is the exact conversion from TradingView: "UT Bot" by "Yo_adriiiiaan". This is a light-load processing indicator. This is a non-repaint indicator. Buffers are available for processing in EAs. All input fields are available. You can message in private chat for further changes you need. Thanks for downloading

To get access to MT4 version please click here . This is the exact conversion from TradingView: QQE MT4 Glaz-modified by JustUncleL This is a light-load processing and non-repaint indicator. All input options are available. This is not a multi time frame indicator. Buffers are available for processing in EAs. You can message in private chat for further changes you need.
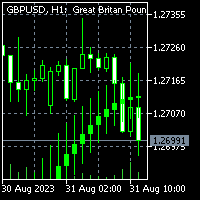
To get access to MT4 version please click here . This is the exact conversion from TradingView: "Smoothed Heiken Ashi Candles v1" by " jackvmk ". This is a light-load processing and non-repaint indicator. All input options are available. Buffers are available for processing in EAs. You can message in private chat for further changes you need. This is not a multi time frame version.

This indicator helps you identify support and resistance levels. Also it adds break points when level is broken. Price sometimes goes back to break point. It has 4 technical parameters and 4 buffers for expert advisors. Buffer indexes: 0 - Resistance, 1 - Support, 2 - Resistance break point, 3 - Support break point". Number of Levels: Determines how many levels are on graph ( if 3 - 3 levels of support and 3 levels of resistance) Tolerance in percentage %: This parameter is used to filter out

The Partial Close Panel is a very useful MQL5 trading tool designed to provide traders with granular control over their trading positions. Key features of this script include: Partial Closure: This functionality allows traders to partially close their positions, setting a custom percentage of lots to close. The volume is flexible, allowing for precision management of risk and profit. Stop Loss Adjustment: This script supports dynamic stop loss adjustment to break-even points. This function can a

Automated trading system it's a professional instrument that allows you to achieve results without the negative influence of a human factor. Effectiveness is confirmed by trading on a real account since 2017. Perform all the tests with the modelling type RealTicks or EveryTick. LINKS Full description of the algorithm; Signal monitoring ( WeTrade + BOA System ); Telegram community; Presets for popular symbols. TRADING STRATEGY DESCRIPTION The trading strategy is based on a breakout of
FREE

Entry base on Quantitative method. DCA if the trend is not support the first Entry.
Requirement Account leverage min 1:500 Deposit min:50.000 Cents (please use for Cents account). Recommend Symbol trade: Any Currency or XAUUSD Deposit min: use Cents account, mininum 10.000 Cent (100 usd) for ONE CURRENCY ONLY. If you use 20.000 Cents, you change MultiLevel to 2 and so on ... Leverage 1:500 DCA method: Exponential DCA auto range = true DCA range: 1$ (100 points) Volume start: 0.01 lot DCA tra

You can think of these indicators as moving pivot points. MasterChartsTrading Price Action Indicators show good price levels to enter or exit a trade. The Blue indicator line serves as a Bullish Trend setter. If your instrument closes above the Blue line, we think about going Long (buying). When your trading instrument closes below the Red line, we think about Shorting (selling). It is very easy to read price action if you have a reference point. These support/resistance lines are there to help

Symbol Changer this Indicator for make more easy when change Chart pair, this more usefull if trader make deal with many pair.
Property Input Indicator Custom Unique ID : Indicator have Id for make different. Show Profit Loss : Adjustable for Show or no Profit and Loss Option Horizontal/Vertical button : Button can change Horizontal or Vertical. Option Window : Adjustable in main Chart as window or buttom chart as Window 1, 2 Main Pairs Preset / Own Pair : available group pair for make easy ha

Представьте себе самую редкую пару. Этот индикатор сможет рассчитать ее силу. Этот измеритель сил валют рассчитывает любые символы, будь то валютные пары, металлы, контракты на разницу, сырьевые товары, криптовалюта (например, Bitcoin/BTC или Ethereum/ETH) и даже акции. Просто назовите ее, и индикатор ее рассчитает! Нет такой валютной пары, которую этот индикатор не смог бы рассчитать. Не важно, насколько редкой или экзотической является эта валюта, этот измеритель валют всегда сможет ее рассчит

This tool was developed to help traders on candle by candle and replay training. In the indicator settings, the user can set the training start datetime. The indicator will autommatically hide all candles after this datetime. So the user can make studies before starting the training. Starting the training, the user can simulate your trades quickly and easily!
This is a product developed by Renato Fiche Junior and available to all MetaTrader 5 users!
Input Parameters
Training Start - train

Наконец то интерфейс стал удобным. Теперь вы можете мышкой управлять периодом индикатора. Просто нажмите на кнопку и прокрутите колесо мышки для увеличения или уменьшения периода CCI. Кнопку можно разместить в любом удобном месте, закрепить ее и использовать одним нажатием. На одном графике можно установить несколько индикаторов и управлять ими как по отдельности так и всеми сразу. Простая установка на график позволяет не заботится о переименовании или изменении параметров каждого индикатора, ав
FREE

HM ( Horizontal Markup ) предназначен для ручной разметки горизонтальных уровней. Разметка содержит уровень и его ценовое значение. Толщина и цвет линии и ценового значения задаются в настройках. Уровни можно размещать локально на таймфреймах, либо выставлять общедоступно для всех таймфреймов. Его работа очень проста: 1) – нажимаем клавишу, которую задали в настройках, для разметки уровня; 2) – подводим линию в желаемое место; 3) – кликаем правую кнопку мыши и уровень привязы
FREE

Displays a USD DXY chart in a seperate window below the main chart. YOUR BROKER MUST HAVE THESE SYMBOLS FOR THE INDICATOR TO WORK Based on EUR/USD, USD/JPY, GBP/USD, USD/CAD, USD/CHF and USD/SEK All these pairs must be added to Market Watch for the indicator to work correctly As this is calculated using a formula based on the 6 pairs it will only work when the market is open.
YOUR BROKER MUST HAVE THESE SYMBOLS FOR THE INDICATOR TO WORK
Displays a USD DXY chart in a seperate window below the
FREE

Что такое RSI? Индикатор RSI (Relative Strength Index, индекс относительной силы) — это индикатор, который измеряет соотношение восходящих и нисходящих движений. Расчет ведётся таким образом, что индекс выражается в диапазоне от 0 до 100. Как понять RSI?
Если значение RSI находится равно 70 и больше, считается, что инструмент находится в состоянии перекупленности (ситуация, когда цены выросли выше, нежели того ожидал рынок). Значение RSI на уровне 30 и ниже считается сигналом о том, что инст
FREE

Automatically protect you positions with Raba BreakEven and Trailing StopLoss EA. Functionalities: Automatic break even. Automatic trailing stoploss
I you have any doubt you can leave it in comments and I will anwer it asap. If you found this tool helpful for you, a comment and a good rating will be appreciated. Also any proposal will be taken into account for future versions.
FREE

Индикатор средневзвешенной цены по объему — это линейный индикатор, который отображается в главном окне графика MT5. Индикатор отслеживает типичную цену, а затем торговый объем, используемый для автоматического смещения линии индикатора в направлении интенсивно торгуемых цен. Именно по этим ценам было продано наибольшее количество контрактов (или лотов). Затем эти взвешенные цены усредняются по прошлым периодам, и индикатор показывает линейное исследование по этим ценам.
Индикатор в этом пост

This indicator will mirror the assets in use in another metatrader, being able to choose the timeframe and a template. This is the Metatrader 5 Client, it needs the Metatrader 4 or 5 Server versions: Metatrader 4 Mirror Chart Server: https://www.mql5.com/en/market/product/88644
Metatrader 5 Mirror Chart Server: https://www.mql5.com/en/market/product/88652 Details of how it works in the video.
FREE

The RFOC Mini Chart was created to project a macro view of the market, which the option to select the timeframe of interest other than the main chart, it is possible to include 2 indicators:
In the full version it is possible to include 2 indicators: 1 - Moving average channel On the mini chart, the moving average will be created based on the prices of the selected time frame for the RFOC Mini Chart. The moving average period must be selected in the indicator settings pannel. 2 - Boillinger Ba
FREE
SaTo EA simple for free. 1. Double MA indicator for Entry signal 2. RSI for trend filter (Uptrend: RSI value greater than RSI level, Downtrend: RSI value less than RSI level ) 3. MACD for trend filter (Uptrend: MACD greater than signal , Downtrend: MACD less signal ) Buy signal : Fast MA greater than Slow MA, RSI value greater than RSI level, MACD greater than signal Sell signal : Fast MA less than Slow MA, RSI value less than RSI level, MACD less signal
FREE

TRADECOPY MASTER MT5 Over the years I developed TradeCopy MT4/MT5 for that purposes: I'm running several experts on one and/or different terminals and accounts. The trades opened by those experts, usually will not move straight away into profit zone. Very often they use to pullback more or less before ending up in profit (or in loss finally...). Improvement of profits (and limit losses) by additional controlling of trades that your experts on the TradeCopy Master part have been opened can be
FREE

Индикатор отображает размер лота и стоп-уровни для длинных и коротких позиций, используя информацию на графике и установленные входные параметры. Объем позиции определяется на основе процентного значения волатильности, рассчитанного по ATR. Индикатор подходит трейдерам, которые желают освоить более продвинутые способы определения объема позиции, отличные от метода фиксированного лота. Текст с необходимой информацией добавляется прямо на график и включает в себя рассчитанный объем позиции, процен
FREE

Будущее скальпинга: Ultra Scalp FX - наш советник теперь для MT5
Добро пожаловать в революцию торговли с Ultra Scalp FX, невероятным советником по скальпингу, теперь доступным для MetaTrader 5. Основные особенности: Безопасная и высокопроизводительная стратегия: Ultra Scalp FX основана на высокой вероятности пробития уровней поддержки и сопротивления. Попрощайтесь с опасными стратегиями, такими как мартингейлы, сетки или хеджирование; здесь безопасность капитала - приоритет номер один. Индивид

Эксперт Exp Crassula может начать работать с минимальным депозитом в 20$ Можно включать на других таймфреймах и валютных парах, предварительно протестировав и подобрав параметр the minimum size for the calculation in paragraphs. рекомендуется использовать от 50 до 500. Есть возможность использовать Мартингейл . Бесплатная версия выпущена для того, чтобы можно было протестировать эксперта в реальном времени. 1.в отличие от платной версии эксперт торгует 2 дня в неделю, по вторникам и четвергам.
FREE

RSI Currencies is an indicator that is based on the RSI concept but with a totally different approach. It calculates its values calculating all RSI values of all pairs related to the same currency and making an average between them: the goal is to obtain a more solid and trustable information about what each currency are doing lowering the impact of market noise and extreme euphory on a particular pair to analyze the whole basket. It works on 28 forex majors and minor pairs related to these curr
FREE

This indicator show color of trend. And combined with the average line, but be used on the hightest price and the lowest of the 26 period. The target entry at the level and the point of the route between 2 line for entry and exit position This is a first version, many problems is not supported and fine. Expected a contected from your friends To continue to follow the good products
FREE

This indicator will show the the change of volumes via 2 lines of SMA: . Fast line (default is 5 candles) . Slow line (default is 13 candles) We can use the crossing point of fast line and slow line to know investors are interesting in current price or not. Pay attention: The crossing point is not signal for entry. Absolutely that we must use in combination with other indicators for sure. Parameters: . Fast line periods: the periods (candles) to calculate SMA of fast line . Slow line periods: th
FREE

Вы уже устали от постоянных взлетов и падений? Не стоит становится жертвой неустойчивых движений рынка … Пора уже как-то от этого избавиться! Уже сейчас вы можете воспользоваться умными решениями Impulse Pro, чтобы сбалансировать фильтры и получить точную статистику.
В трейдинге время решает все
Если вы хотите узнать больше, посетите www.mql5.com/en/blogs/post/718212 Выполните три простых шага, и вы сможете прогнозировать неожиданные движения на рынке!
Преимущества
Быстрый алгоритм опред

Smart Lot-Size Calculator And Trade Assistant for Mobile Trading Overview: This is the tool every trader in the market must have no matter if you are scalper, swing traders, day trader, or long term trader. This On-The-Go trading tool will help you stay disciplined and also stay free from daily trade management chores, Most traders face common problems like 1. Calculation of proper lot-size of a position to take controlled risk 2. Managing every trade and trailing stop-loss if trades goes in
FREE

Title : Ultimate Oscillator - Multi-Timeframe Momentum Indicator Description : Overview : The Ultimate Oscillator is a powerful and versatile technical analysis tool developed by renowned trader Larry Williams. This indicator is specially designed to capture market momentum across three different timeframes, providing a comprehensive view of the market's dynamics. Unlike traditional oscillators, which are confined to a single timeframe, the Ultimate Oscillator integrates short-term, medium-term,
FREE

The Bolliger Bands On-Off let you control the indicator using the keyboard or a button . You can choose if you want the indicator always shown or always hided while switching among different time frames or financial instruments . ---> This indicator is part of Combo Indicator OnOff
The Bollinger Bands identify the degree of real-time volatility for a financial instruments . A lower amplitude corresponds to a low volatility, conversely a greater bandwidth corresponds to high volatility
FREE

Functional in the Forex market. Functional in the B3 market - Bolsa Brasil Balcão.
Motivation The technical Fibonacci retraction indicator for many is essential and the basis for all market movement forecasts. The name of the tool comes from the Italian mathematician Leonardo de Pisa (13th century).
This DEMO version will work in Meta Trader with Demo and Strategy Tester.
To purchase the Full version that works on a Real account, click on: https://www.mql5.com/en/market/product/38089
FREE

Switch symbols and timeframe by arrow buttons 1. You can switch multiple symbols of one or all charts. 2. You can set list of symbols to switch between them or get them from Market Watch. 3. You can change timeframe of one or all charts. List of timeframes here [M1, M5, M15, M30, H1, H4, D1, W1, MN1]. Switch symbol of all charts: indicator check current symbol of the chart to get index of it in list and change for next or previous. Key functions: - Right arrow key: switch to next symbol. - Left
FREE

Это версия MT5 Вот несколько показателей, которые работают вместе. Он в основном работает с движущихся средних и различных уровней ATR создания динамического канала, через который цена осушенных. Как я всегда рекомендую, вы должны попробовать его, прежде чем использовать его вживую, так что вы понимаете, как это работает. Сигнал входа на рынок похож на другие индикаторы MA, но с этим у вас также есть графический анализ момента, когда тренд найден и динамические уровни, чтобы скорректировать стоп
FREE

The Indicator indicator draws 2 clouds based on Bollinger Bands indicator values. The upper cloud is formed by the upper lines values and the lower cloud by the lowers lines values. The indicator allows to change the Bollinger Bands parameters and the clouds colors the period of the base line and the deviations of each Bollinger Bands instance. The indicator holds 5 buffer index as follow: [0] - Outer values of the upper cloud [1] - Inner values of the upper cloud [2] - Base/Center line values
FREE

Менеджер символов или Сеточный менеджер, разработан для группировки ордеров в одну позицию (по символу и по направлению). Эта утилита будет полезна сеточникам и мультивалютникам, тем у кого может быть открыто множество ордеров по нескольким парам. Вы сможете видеть общее количество лотов, общую прибыль, и устанавливать виртуальные стоплосс и тейкпрфит. Для установки реального ТП (или СЛ) необходимо сначала задать виртуальное значение, а затем ввести в этой ячейке команду: "set". Если вы хотите

Introducing "Congestion Breakout MT5" - the indicator that helps you identify congestion zones in your chart and alerts you when the price breaks through them. Traders know that congestion zones can be key areas of price action and can indicate potential turning points in the market. However, spotting these zones and anticipating breakouts can be a difficult and time-consuming task. That's where "Congestion Breakout" comes in. This powerful indicator uses advanced algorithms to analyze the pri

Уникальный профессиональный инструмент - индикатор дивергенции/конвергенции между AC и ценой, позволяющий своевременно получать сигнал о развороте тренда или ловить движения откатов цены (в зависимости от настроек). Незаменим для тех, кто торгует дивергенции в ручную или советником. Настройки индикатора позволяют регулировать силу дивергенции/ конвергенции за счет угла наклона пиков AC и процентного изменения цены, что даёт возможность тонко настроить силу сигнала. Код индикатора оптимизирован
FREE

Introduction to the Magic TD Sequential 9
The "Magic TD 9" is a technical analysis tool for stocks. It is based on historical price data and divides prices into nine levels based on a certain magnitude. It then calculates the average price of each level and constructs a sequence of nine data points. This sequence is called the "Magic TD 9," with the first data point representing the stock's lowest price and the ninth data point representing the highest price.
Index inputs:
1 Turns: repr

This system is a semi- automatic trend following system that operates during the days of highest probable market volatility aiming to capitalize on major retracements and reversals that occur midweek. It can operate on full autopilot, act as just a signal generator, or any customized user preference based on the needs of the user and the functionality of the program. It is capable of risk management with an inbuilt lot size calculator with adjustable risk pecentage to suit the user's unique apet
FREE
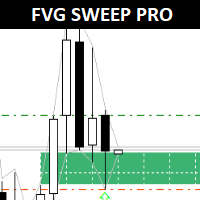
FVG Sweep Pro is a trading system designed for the MetaTrader 5 platform. This EA is built on my Fair Value Gap Sweep indicator(the principle of sweeping fair value gaps). It executes trades under specific conditions such as time of day, gap size and other criteria fully customizable by the user.
For optimal operation, it is recommended to use these pairs with low spreads.
One of the key features of FVG Sweep Pro is its risk management system. Users can specify their desired risk percent pe
MetaTrader Маркет - торговые роботы и технические индикаторы для трейдеров, доступные прямо в терминале.
Платежная система MQL5.community разработана для сервисов платформы MetaTrader и автоматически доступна всем зарегистрированным пользователям сайта MQL5.com. Ввод и вывод денежных средств возможен с помощью WebMoney, PayPal и банковских карт.
Вы упускаете торговые возможности:
- Бесплатные приложения для трейдинга
- 8 000+ сигналов для копирования
- Экономические новости для анализа финансовых рынков
Регистрация
Вход
Если у вас нет учетной записи, зарегистрируйтесь
Для авторизации и пользования сайтом MQL5.com необходимо разрешить использование файлов Сookie.
Пожалуйста, включите в вашем браузере данную настройку, иначе вы не сможете авторизоваться.