Смотри обучающее видео по маркету на YouTube
Как купить торгового робота или индикатор
Запусти робота на
виртуальном хостинге
виртуальном хостинге
Протестируй индикатор/робота перед покупкой
Хочешь зарабатывать в Маркете?
Как подать продукт, чтобы его покупали
Технические индикаторы для MetaTrader 5 - 28

A indicator to show saturation in buying or selling With fast and complex mathematical calculations Easily find saturation points for buying or selling Can be used in all symbols and time frames with many signals Can be combined with different indicators and different time frames With simple settings and simple working methods
Features: Can be used on all symbols Can be used in all time frames Can be used in all markets (Forex, stock, etc.) Large number of signals Same performance on all t

HiLo Trend Matrix is an advanced multi-timeframe trend indicator that scans and analyzes multiple timeframes to determine the overall trend direction, allowing you to effortlessly ride the trend waves as they emerge. By scanning the four higher timeframes, starting from your current timeframe or a selected one from the input parameters, you'll always have a comprehensive view of the market's movements. And when the trend aligns, the HiLo Trend Matrix delivers an alert, so you can seize the oppo

Elevate Your Trading Experience with the famous UT Bot Alert Indicator!
Summary: The UT Bot Alert Indicator by Quant Nomad has a proven track record and is your gateway to a more profitable trading journey. It's a meticulously crafted tool designed to provide precision, real-time insights, and a user-friendly experience.
Key Features: Precision Analysis: Powered by advanced algorithms for accurate trend identification, pinpointing critical support and resistance levels. Real-time

IBB Candles is a tool that is based on the concept of Inverse Bollinger Bands. It compares price relative to state of the bands and plots candles with different colors defining the current state of the market i.e range | trend | strong trend. As the name suggests IBB(Inverse Bollinger Bands) is a technique which is completely different from the traditional Bollinger Bands and proves to be much more effective in analyzing market. This personal implementation makes this tool a more reliable optio
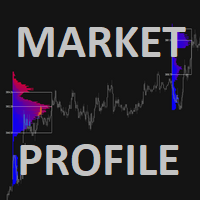
Concept of Market Profile was created at Chicago Board of Trade (CBOT) by trader Peter Steidlmayer and first published during the 1980s as CBOT product. Market profile by itself is not a stand-alone strategy, but a different way how you can view the market and make better trading decisions.
They have seen a market as an auction process which is affected by supply and demand the same way as every other auction, for example, development of prices of food, gas etc.
The price goes up as long th

MT4 Version SMT Divergences MT5
SMT Divergences is one of the most innovative indicators in the market. It offers the possibility of analyzing price divergences between 2 pairs. These divergences highlight and help to foresee what banks and institutions are planning to do. SMT divergences also provides you with a kill zones indicator and the possibility of filtering divergences occurring during these kill zones. This indicator is specially powerful if applied in 2 highly correlated pairs. A pr

Introducing the Kangaroo Hunter - Your Ultimate Edge in Forex Trading ATTENTION Forex Traders! Are you in constant pursuit of high-probability trade setups? Or maybe you're a novice trader struggling to pinpoint precise entry and exit points? Our solution, the Kangaroo Hunter, is about to revolutionize your trading journey. This meticulously designed indicator simplifies and refines the art of identifying the often elusive Kangaroo Tail patterns in the Forex market, pushing your trading strateg

Welcome to the world of SMC (Smart Money Concepts) Trading, where we empower traders with the tools and knowledge to make smarter trading decisions. Our latest addition to our suite of trading tools is the SMC Trading Pro indicator, version 1.0. Key Features: Major Market Structure Identification with BODY break. Order Block must be in Major Swing ( not Small Swing ). Order Block with Fair Value Gap Detection. Order Block in Discount | Premium zone. Filter for only Bullish, Bearish or All Order
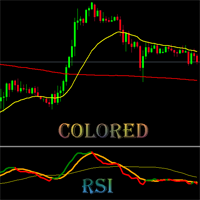
This is Colored RSI Scalper Free MT5 -is a professional indicator based on the popular Relative Strength Index (RSI) indicator with Moving Average and you can use it in Forex, Crypto, Traditional, Indices, Commodities. Colors are made to make trend, and changing trend more easily. Back test it, and find what works best for you. This product is an oscillator with dynamic overbought and oversold levels, while in the standard RSI, these levels are static and do not change.
This allows Colored RS
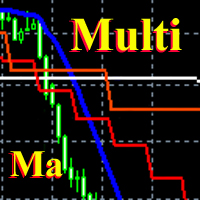
Это тот же самый индикатор Ma Multi , который ранее был доступен только для Mt4 . Теперь появилась версия для Mt5 . Он принадлежит к целому семейству мультифреймовых индикаторов, реализующих идею отображения разных таймфреймов в едином масштабе времени. Фиксация горизонтального масштаба позволяет одним взглядом получить общую картину и предоставляет дополнительные возможности для технического анализа. Работа индикатора проверена на Just2trade Параметры индикатора :
MA_Period - период

RISK TO REWARD TOOL for MT5 with UI on chart: (creates similar RR boxes like on tradingview) -creates and deletes draggable boxes on chart, ANY SYMBOL, ANY TF. Menu buttons:
NEW BUY, NEW SELL, DELETE ALL, ( and minimize) -draggable target TP level
-draggable SL limit level
-text labels with pips SL TP, RR ratio-there is no limit of boxes
-but program remembers first 100 boxes after changing input. there is parameter "delete_on_init" so false = every created box stays as it is,

Indicador Para Opções Binarias. Indicator for Binary Options Usa dois gales. Instalar em mt5 Esse indicador é para ser usado no tempo de vela de 5 minutos e em M5. Este também funciona em M1, porém é mais eficiente em M5. Só descompactar e copiar os arquivos na pasta de dados do seu MT5. Arquivos indicator na pasta MQL5 - Indicator. Baixe também a Media Movel totalmente gratis:
https://www.mql5.com/pt/market/product/50400
Esse Indicador é para a próxima vela. Apareceu a seta, só aguardar a pr

MultiTimeframe (MTF) Support and Resistance Indicator is use to measure last 320 bar (user input) of support and resistance of the dedicated timeframe.
User can attached this indicator to any desire timeframe. Features: User input desire timeframe (default Period H4) User input numbers of last bars (default 320 bars) User input measurement of last HH and LL (default 10 bars) Line styling and colors. MT4 Version : https://www.mql5.com/en/market/product/31984

The Session Volume Profile indicator displays the distribution of trade volume across price levels for a specific trading session. It visualizes areas of high and low trading activity, helping traders identify support and resistance zones. The profile's peak, known as the Point of Control (POC), represents the price with the highest traded volume.
The inputs of the indicator:
volumeBars(Row Size) : Determines the number of price bins or rows for the volume profile. A larger number results in
This indicator measures the largest distance between a price (high or low) and a moving average. It also shows the average distance above and below the moving average. It may come in handy for strategies that open reverse positions as price moves away from a moving average within a certain range, awaiting it to return so the position can be closed. It just works on any symbol and timeframe. Parameters: Moving average period : Period for moving average calculation. Moving average method : You can

Welcome to Investment Castle products This product is exclusively available in the MQL5 market and is not available and will not be available anywehere else. The Combined indicator is a multi-time frame indicator and it is built using 3 indicators: Bands indicator which draws the support and resistance key levels using up to 5 different time frames Patterns indicator which draws the chart patterns using up to 6 different time frames Spots indicator which shows the common candlestick patterns Yo

The double top bottom pattern is arguably one of the technical analysis's most popular chart patterns. These patterns are used to capitalize on recurring patterns and identify trend reversal patterns, thereby creating well-placed entry and exit levels. The KT Double Top Bottom is based on these patterns and fine-tunes the trade signal development process for traders.
Features
It's based on one of the most reliable trading patterns and brings some fine-tuning and automation to the process. A

What you can do with CandleStick CandleStick is a useful indicator for doing MTF analysis. This indicator displays the CandleStick of another time frame on the chart . By understanding the information in multiple time charts at the same time, it is easier to understand the overall market view. It is also a useful tool for validating and studying past quotes and trades. There are similar products made by others, but I designed and developed it so that it is easy for me to use.
Features of Candl

The Didi Index is an indicator that helps in the identification of the so called “Didi Needles” (Agulhada do Didi), a method created by the experienced Brazilian trader Odir Aguiar (Didi).
DIDI NEEDLES EXPLAINED
The concept of the needles is simple: 3 moving averages are added to the chart (by default 3, 8 and 20 periods, simple mode), and whenever all 3 averages pass simultaneously inside the real body of a candle, the needling occurs. It was named after the movement of passing a thread th

Многим современным трейдерам приходится открывать несколько позиций по одной и той же паре, потому что одна позиция обычно не является лучшей, при этом накапливается много сделок, иногда с различными размерами лота. В таких ситуациях непросто рассчитать цену безубытка для всех открытых позиций. Для решения этой проблемы был создан индикатор Breakeven Price. Breakeven Price - это индикатор для MetaTrader 5, который рассчитывает текущую цену безубытка для всех позиций на покупку и продажу, открыты

The GGP SuperTrend MT5 Indicator is a technical analysis tool that can assist investors in identifying market trends. The indicator is based on ATR and is very useful for capturing the direction of an asset’s momentum and is widely employed when looking at stocks, currencies, and commodities. It plots a line on the price chart, which acts as a dynamic level of support or resistance, helping traders and investors make informed decisions about entry and exit points. This indicator is MT5 conversi

This indicator is used to identify key levels where the trend in price has a greater probability of halting and possibly changing direction. Interpretation of the degree of significance of a level depends on a trader's time frame. It is great to see how the prices respect each level of this support and resistance. This Indicator works for me very well. If you have good knowledge of Price Action then you can make profitable trades with this indicator. If candle take support or resistance on any o

Moving Average Distance Indicator
The “Moving Average Distance Indicator” calculates the difference between the instrument's price and the moving average of your choice, showing this difference in percentage values or in price. In other words, it indicates how far the price is from the moving average.
What is it for?
The great advantage of this indicator is the ease to compare movement expansions that occurred in the past, at different price levels, as the indicator works in a levell

Introducing the revolutionary ICT Silver Bullet Strategy Indicator for MT5, a groundbreaking tool designed to usher in a new era of trading for beginners and experienced traders alike. This advanced indicator seamlessly translates the intricate ICT Silver Bullet strategy into a simplified visual representation on your charts, offering not just comprehension but a path to profitable trading. A Strategy Simplified: Navigating the complexities of the ICT Silver Bullet strategy has never been easie

Introducing our A.I Currency Strength Meter Forex Indicator, a state-of-the-art tool designed to provide forex traders with real-time insights into the strength of various currencies. Leveraging the latest advancements in artificial intelligence and machine learning, this innovative indicator analyzes market data in real-time, providing users with accurate and up-to-date information to inform their trading decisions. In addition to its cutting-edge algorithms, the Currency Strength Meter For
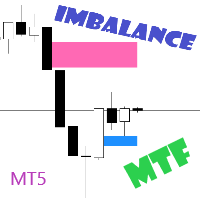
Imbalance / FVG MTF Mark Imbalance on chart of Selected Multi Time frames. Trend is Manually set to filter signals in the chosen direction by a button on the chart. .
Futures Auto Mark Imbalance / FVG on chart on selected time frames
Select time frames by buttons on chart
Popup Alert, Push Notification or email when New Imbalance Form
Popup Alert, Push Notification or email when Imbalance is Taken out
Select Alert Mode to be a single or multiple Imbalance ( OR / AND option ) when Imbalan

KT Heiken Ashi Smoothed is a smoothed version of the standard Heiken Ashi. Moreover, it also plots buy/sell arrows on a trend change. A buy arrow is plotted when it change to a bullish state from bearish state. A sell arrow is plotted when it change to a bearish state from bullish state. Mobile notifications, Email, Sound and Pop-up alerts included.
What exactly is Heiken Ashi Smoothed? It filters out the false signals and noise in the standard Heiken Ashi. It applies the set of two moving a
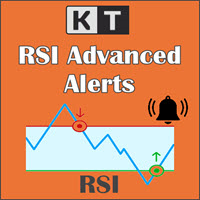
KT RSI Alerts is a personal implementation of the Relative Strength Index (RSI) oscillator that provide signals and alerts on four custom events: When RSI enter in an overbought zone. When RSI exit from an overbought zone. When RSI enter in an oversold zone. When RSI exit from an oversold zone.
Features A perfect choice for traders who speculate the RSI movements within an overbought/oversold zone. It's a lightly coded indicator without using extensive memory and resources. It implements all

The KT 4 Time Frame Trend is an invaluable forex indicator for traders seeking to identify the trend direction across 4-time frames accurately. This innovative indicator allows users to simultaneously observe and analyze price trends across four different timeframes. Whether you're a beginner or an experienced trader, this tool offers an enhanced understanding of trend dynamics, leading to improved trading strategies on your trading platform. The capability to concurrently monitor multiple timef
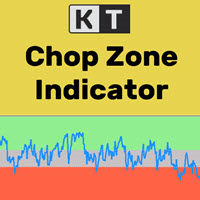
It's a well-known fact that most of the financial markets trend only 30% of the time while moving in a closed range rest 70% of the time. However, most beginner traders find it difficult to see whether the markets are trending or stuck in a range. KT Chop Zone solves this problem by explicitly highlighting the market phase into three zones as Bearish Zone, Bullish Zone, and Chop Zone.
Features
Instantly improve your trading by avoiding trade during the sideways market (Chop Zone). You can al

KT Pip Counter is a simple and informative indicator that shows some essential data and numbers on a real-time basis. Such critical information and data can benefit a trader during an intense trading session.
Features
Shows the current profit/loss in currency, pips, and percentage. Shows the current spreads. Shows the remaining time in the closing of the current bar. The different color schemes for profit/loss scenario. The text position and layout can be fully customized. It uses minimum

В современных условиях рынка объективный метод торговли против тренда может стать ценным преимуществом трейдера. Большинству трейдеров, наверняка, знакомы названия "TD Sequential" и "Range Exhaustion". Sequential R - торговля против тренда с использованием системы распознания истощения трендов Simple Range Exhaustion. Система TD Sequential полезна при определении точек истощения тренда, позволяя оказаться впереди толпы трейдеров, следующих за трендом. Индикатор Sequential R предназначен для опре

I'm excited to introduce you to the fifth bar on Martin Armstrong's Forecast Array - The Trading Cycle .
This innovative tool represents a transverse form of cyclical frequency analysis, offering a unique perspective on market trends.
The model employs a color-coded system for easy interpretation. In this model, green signals the ideal timing for highs, red indicates ideal lows, and yellow signifies a convergence of highs and lows occurring simultaneously. This intuitive approach allows
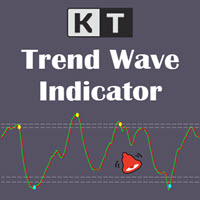
KT Trend Wave is an oscillator based on the combination of Price, Exponential, and Simple moving averages. It usually works great to catch the short term price reversals during the ongoing trending market. The bullish and bearish crossovers of the main and signal lines can be used as buy/sell signals (blue and yellow dot). It can also be used to find the overbought and oversold market. The buy and sell signals that appear within the overbought and oversold region are usually stronger.
Feature

KT SuperTrend is a modified version of the classic SuperTrend indicator with new useful features. Whether its Equities, Futures, and Forex, the beginners' traders widely use the Supertrend indicator. Buy Signal: When price close above the supertrend line.
Sell Signal: When price close below the supertrend line.
Features
A multi-featured SuperTrend coded from scratch. Equipped with a multi-timeframe scanner. The last signal direction and entry price showed on the chart. All kinds of MetaTra

KT Custom High Low shows the most recent highs/lows by fetching the data points from multi-timeframes and then projecting them on a single chart. If two or more highs/lows are found at the same price, they are merged into a single level to declutter the charts.
Features
It is built with a sorting algorithm that declutters the charts by merging the duplicate values into a single value. Get Highs/Lows from multiple timeframes on a single chart without any fuss. Provide alerts when the current
Advanced MA Crossover Alert System The FX AlgoTrader Advanced Moving Average Crossover Alert System is a highly configurable MT5 indicator which incorporates a fully automated alert system for monitoring two trader defined moving averages. The indicator is designed to alert traders when two moving averages crossover. The trader has a wide range of control over how the MA Crossover alerts are generated which is detailed below. Key Features Automatic display of trader defined fast and slow movin

KT Absolute Strength measures and plots the absolute strength of the instrument's price action in a histogram form. It combines the moving average and histogram for a meaningful illustration. It supports two modes for the histogram calculation, i.e., it can be calculated using RSI and Stochastic both. However, for more dynamic analysis, RSI mode is always preferred.
Buy Entry
When the Absolute Strength histogram turns green and also it's higher than the previous red column.
Sell Entry
W
Статистический индикатор спреда.
Незаменимый инструмент для каждого трейдера. Подходит как для ручной, так и для алгоритмической торговли.
Ключевые показатели:
maximum - максимальное значение спреда за указанный период medium - среднее значение спреда за указанный период minimum - минимальное значение спреда за указанный период current - текущее значение спреда Его можно использовать абсолютно на любом торговом инструменте. Данный индикатор показывает пределы спреда за установлен

This Currency Meter Calculates Strength Using a currency basket of 28 pairs? This Currency Meter uses a basket of 28 currency pair to define strength. This is very important because it gives an wholesome view of the strength of a currency by considering its reaction to all major currencies paired with it.
This Currency Meter is Multi-timeframe!!! Majority of the currency strength indicators around the market today only has a single time frame view. Even with the so called multi-timeframe versi
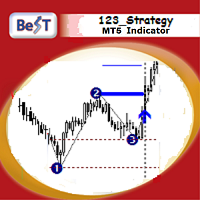
BeST_123 Strategy is clearly based on the 123 Pattern which is a frequent Reversal Chart Pattern of a very high Success Ratio .It occurs at the end of trends and swings and it’s a serious indication of high probability for a change in trend.Theoretically an 123_pattern is valid when the price closes beyond the level of #2 local top/bottom, a moment when the indicator draws an Entry Arrow, raises an Alert, and a corresponding Position can be opened.
The BeST 123_Strategy Indicator is non-repai

Индикатор показывает, сколько времени осталось до открытия следующего бара или свечи. Примеры оставшегоя времени до появления нового бара: Пример для таймфрейма М1: 05 = 05 секунд. Пример для таймфрейма Н1: 56:05 = 56 минут, 05 секунд. Пример для таймфрейма D1: 12:56:05 = 12 часов, 56 минут, 05 секунд. Пример для таймфрейма W1: W1(06): 12:56:05 = 6 дней, 12 часов, 56 минут, 05 секунд. Версия для МetaТrader 4: https://www.mql5.com/ru/market/product/13564 Настройки color_time - Цвет текс

Данный индикатор распознает все уровни поддержки и сопротивления.
Применены ряд уникальных высокопроизводительных методик, которые сделали возможным существование данного индикатора. Естественным образом видны все сформированные каналы: горизонтальные линейные линейные параболические кубические (Полином 3 степени - Волна) Это происходит благодаря связке аппроксимирующих каналов.
Сформированные каналы в иерархической последовательности образуют "стоячие волны".
Таким образом видны все уров

Setup 9.1 strategy created by the North American trader Larry Williams . SIMPLE setup, effective, with a good level of accuracy and excellent return. Attention : The Demo version only works on the tester, if you are interested in running it in real time, please contact me and I will provide another version. Buy Signal:
Exponential moving average of 9 (MME9) is falling, wait it to TURN UP (in closed candle). Place a buy stop order 1 tick above the HIGH of the candle that caused the turn to occur

Buy CTS scalping indicator, provide buying and selling signals, automatic channeling and sending signals to mobile phones
Using technical analysis and price action methods and modern methods, CTS indicator can draw price channels and recognize price trends with high accuracy and issue entry and exit signals according to them. Traders can easily fluctuate using this indicator in different time frames and in different markets. With the CTS indicator, you can signal in different ways. This indicat

Tatino Super Signals is Non Repaint Indicator for Binary Option trading and Forex trading. Recommendations:
Timeframe: All timeframes. For best results we recommend using it on M1, M5 and M15 timeframes. Currency pairs: All Pairs Account type: All Type Broker time: Any Brokers : Alls Binary Trading : Expired 1 Candle Buffer Buy=1, Sell=0, Entry Next Candle Recommended Forex trading stop loss : 15 pips Recommended Forex tradingTake profit levels : 15 pips
Specifications:
Does not repaint

Индикатор позволяет анализировать изменения тиковых объемов в виде кумулятивных дельта-баров (свечей). Он вычисляет на каждом баре тиковые объемы для покупок и продаж (раздельно), а также их разницу. Кроме того, он может выводить объемы в разбивке по кластерам (ячейкам) цен внутри указанного бара (обычно это последний бар). Данный индикатор производит вычисления аналогично VolumeDeltaMT5 , но предоставляет иное отображение результатов. Имеется версия для МетаТрейдер 4 - CumulativeDeltaBars . Это

Super Trend Indicator for MetaTrader 5 - Elevate Your Trading Precision Experience the future of trading with the "Super Trend Indicator" designed for MetaTrader 5. This versatile tool is your key to precise market analysis, providing insights into potential trend directions that enhance your trading decisions. Basic Details : Indicator Type : Super Trend Indicator for MetaTrader 5 Key Metrics : Real-time analysis of market trends using a proprietary algorithm. Customization : Fully customizable
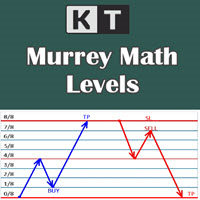
It shows the Murrey Math levels on chart and also provides an alert when price touch a particular level. T. Henning Murrey, in 1995, presented a trading system called Murrey Math Trading System, which is based on the observations made by W.D Gann.
Applications
For Murrey Math lovers, this is a must-have indicator in their arsenal. There is no need to be present on the screen all the time. Whenever the price touches a level, it will send an alert. Spot upcoming reversals in advance by specula

Blended Candle Strength (BCS)
Any trading strategy, whether it is a continuation, trend reversal or breakout requires, in addition to analyzing the context of the price movement, confirmation signals for both trading entry and exit. And for that, it is necessary to analyze the formats of the candlesticks and fit them in known patterns to assist decision making. In addition to the context and format, two other important information to determine the strength of candlesticks are the size of the ba
FREE

KT CCI Divergence shows the regular and hidden divergence created between the price and CCI oscillator. Divergence is one of the vital signals that depicts the upcoming price reversal in the market. Manually spotting the divergence between price and CCI can be a hectic and ambiguous task.
Limitations of KT CCI Divergence
Using the CCI divergence as a standalone entry signal can be risky. Every divergence can't be interpreted as a strong reversal signal. For better results, try to combine it

Introduction to Fibonacci Volatility Indicator Volatility indicator can help you to detect any statistical advantage for your trading. Especially, if you are trading with Price Action and Price Patterns, then we recommend to use the Volatility indicator together with your strategy. Especically, Fibonacci Volatility indicator combines the market volatiltiy with Fibonacci Analysis to provide you more advanced volatiltiy indicator. Main Features Fibonacci Volatility in Z score Configuration Mode Fi

MACD ******************** MACD для платформы секундных графиков Micro . ********************* Секундный график на порядок увеличит точность ваших входов и выходов. Секундный период , в привычном формате, позволит увидеть то, что ранее было скрыто. Бесплатные индикаторы, дополнят визуальную картину, что, в совокупности выведет вашу торговлю на новый уровень. Идеально подходит как скальперам, так и трейдерам торгующим внутри дня. Индикатор MACD для платформы Micro. Входные параметры:
FREE

Добрый день. Сегодня добавили вспомогательный индикатор тренда DveMashkiTompson, идея взята из аналога МТ4 и перенесена на МТ5, используется совместно с индикаторами Тренда ТМА и МА, рисует красные и зеленые области в зависимости от направления рынка. Тренд вверх -зеленые области, тренд вниз -красные.Области основываются на пересечении индикатора МА, таким образом данный индикатор дает информацию графического содержания для более быстрой оценки ситуации и принятия решения.
FREE

Indicator basic idea is buy strong currency and sell weak currency. If A/B currency pair is in an uptrend, it shows if it is due to A strength or B weakness.On these signals one can choose the most optimal pair to trade. You can use Currency Power System for pattern trading as well, among basic patterns which can be used are: cross trend break divergencies So much for theory. I searched for a ready-made indicator (Currency Strength) to support my trade but did not find one. Well. I have to wr

This indicator was developed to support multiple timeframe analysis. In the indicator settings, the user can set the color, width, and style of the horizontal lines for each timeframe. This way, when the horizontal lines are inserted into the chart, they will be plotted with the timeframe settings.
MTF Lines also allows visibility control of another objets like rectangles, trend lines and texts.
This is a product developed by Renato Fiche Junior and available to all MetaTrader 4 and 5 users!

Индикатор RealCryptoLevels скачивая стаканы ордеров криптобирж с максимальной глубиной показывает горизонтальные объёмы популярных криптовалют выводя их на график, благодаря чему можно видеть не только сами объёмы, но и уровни и что не мало важно силу отображаемых уровней (смотрите скриншоты), что очень важно для успешной торговли по всем стратегиям от скальпинга до среднесрочной торговли, ведь можно видеть предпочтения покупателей и продавцов в настоящий момент и их настроения на будущее. Ин

(Google Переводчик) Этот индикатор был вдохновлен средним истинным диапазоном (ATR) Джона Уэллса Уайлдера , но с некоторой дополнительной информацией. Точно так же он вычисляет экспоненциальное скользящее среднее истинного диапазона, но использует стандартный альфа-вес вместо Уайлдера . Он также вычисляет среднее отклонение от среднего диапазона и отображает его как смещение. Это помогает не только быстрее определить изменение, но и его влияние. (Original text) This indicator was inspired by Joh
FREE

Indicators are professional data statistics, position orders, historical order analysis->>>>>> <This version is in Chinese -> English version please move>
Necessary for traders: tools and indicators Waves automatically calculate indicators, channel trend trading Perfect trend-wave automatic calculation channel calculation , MT4 Perfect trend-wave automatic calculation channel calculation , MT5 Local Trading copying Easy And Fast Copy , MT4 Easy And Fast Copy , MT5 Local Trading copying For DE
FREE
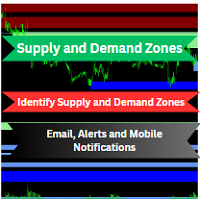
This powerful Indicator can automatically identify supply and demand zones and send you alerts, email and push notification on mobile whenever a new zone is created or when the price enters a specific zone.
This indicator integrates with any timeframe and chart or currency pair, ensuring its versatility across your trading endeavors. Supply & Demand Zones Finder(SDZF) indicator seamlessly identifies proven supply and demand zones, areas where price has consistently found support or res

O indicador é uma ferramenta desenvolvida para o MetaTrader, projetada para auxiliar na análise detalhada do comportamento do preço em relação a uma média móvel específica. Ao ser anexado ao timeframe diário, o ele realiza cálculos e monitora, em timeframes menores, quantas vezes o preço toca determinados níveis de afastamento durante o dias além de calcular a média dos toques.
MT4: https://www.mql5.com/pt/market/product/111706
FREE

The underlying strategy of this indicator is based on identifying momentum in the market and attempting to capture the direction of the trend through transitions between bullish and bearish moments. Utilizing bands around the RWMA allows for identifying potential overbought and oversold situations in the market.
1. Calculation of the Range Momentum Index (RMI): The RMI is based on a combination of the Relative Strength Index (RSI) and the Money Flow Index (MFI), both of which are momentum ind

Non-proprietary study of Joe Dinapoli used for trend analysis. The indicator gives trend signals when the fast line penetrates the slow line. These signals remain intact until another penetration occurs. The signal is confirmed at the close of the period. It is applicable for all timeframes. Inputs lnpPeriod: Period of moving average. lnpSmoothK: %K period. lnpSmoothD: %D period. ********************************************************************************
FREE

Trend Line Finder will project forward a support and resistance lines using 2 previous highs for resistance and 2 previous lows for support. It will then signal to the trader by alert making the trader more aware that a possible good move is about to happen. This is not a stand-alone trading system but is very useful in finding key areas of support resistance levels where price will usually either rebound from or breakthrough. Its down to the trader to decide what to do with use of other s

Description of ADTGroup_Oscillator.mq5 Indicator
The ADTGroup_Oscillator.mq5 indicator is a custom technical analysis tool created by avydel. It is designed to provide insights into market trends and potential trading opportunities. Here is an overview of its key features and functionality:
- **Indicator Type:** This oscillator is designed to be displayed in a separate window on the trading platform. - **Indicator Plots:** It utilizes one buffer for plotting data. - **Plot Style:** The indi
FREE
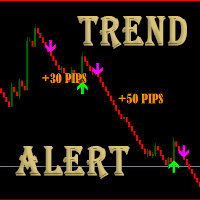
Characteristics of Trend Alert Platform: Metatrader4 Currency pairs: Any (recommended major) Trading Time: Any Timeframe: M5 or higher In-built Alert System Trend Alert is easy to use.
ITS FREE, GIVE ME A GOOD RATING!
Trend Alert indicator can be added to the existing trading systems , or used in combination with other indicators , filters its signals.
Send me a mail for further details.
FREE

Highly configurable Rate of Change (ROC) indicator. Features: Highly customizable alert functions (at levels, crosses, direction changes via email, push, sound, popup) Multi timeframe ability Color customization (at levels, crosses, direction changes) Linear interpolation and histogram mode options Works on strategy tester in multi timeframe mode (at weekend without ticks also) Adjustable Levels Parameters:
ROC Timeframe: You can set the current or a higher timeframes for ROC. ROC Bar Shift:
FREE

516/5000 Average volume indicator to calculate the average volume for a given period. Useful as a filter to measure the strength of a trend, or false breaks in support or resistance.
It does not give a signal to buy or sell, it only acts as a filter to avoid entering into transactions with a drop in volume, or below-average volume, which may indicate disinterest in trading at the price level.
It has only the parameters of period, method of calculating the average and type of volume.
FREE

This indicator displays the spread Simple and easy to use and fully customisable: View as Pips or Pipettes Chart symbol can be hidden Text display can be changed Change color and text styles Add or hide a decimal point Spacing options between inputs Default screen positions Screen position inputs
How to use 1. Simply use the default settings; or 2. Choose to show pips or pipettes; 3. Choose to display symbol, text or decimal; 4. Choose where to place it on the screen; 5. Save settings or save
FREE

Это специальная утилита, для подключения внешнего индикатора к торговой панели . Она позволяет получать данные из буфера индикатора и рисует стрелочные объекты для передачи их в торговую панель. Входные параметры
Number of call buffer - номер индикатора для покупки Number of sell buffer -номер индикатора для продажи Indicator window - окно индикатора Indicator position in list - позиция индикатора в списке Default value of indicator - значения по умолчанию для индикатора Show information - пока
FREE
MetaTrader Маркет - торговые роботы и технические индикаторы для трейдеров, доступные прямо в терминале.
Платежная система MQL5.community разработана для сервисов платформы MetaTrader и автоматически доступна всем зарегистрированным пользователям сайта MQL5.com. Ввод и вывод денежных средств возможен с помощью WebMoney, PayPal и банковских карт.
Вы упускаете торговые возможности:
- Бесплатные приложения для трейдинга
- 8 000+ сигналов для копирования
- Экономические новости для анализа финансовых рынков
Регистрация
Вход
Если у вас нет учетной записи, зарегистрируйтесь
Для авторизации и пользования сайтом MQL5.com необходимо разрешить использование файлов Сookie.
Пожалуйста, включите в вашем браузере данную настройку, иначе вы не сможете авторизоваться.