Смотри обучающее видео по маркету на YouTube
Как купить торгового робота или индикатор
Запусти робота на
виртуальном хостинге
виртуальном хостинге
Протестируй индикатор/робота перед покупкой
Хочешь зарабатывать в Маркете?
Как подать продукт, чтобы его покупали
Торговые роботы и индикаторы для MetaTrader 4 - 140

Chakram — сеточная торговая система основанная на возврате цены к среднему значению с использованием индикаторов Bollinger Bands RSI Валютные пары: AUDCAD, AUDNZD, NZDCAD.
Таймфрейм: M15 Функции: Советник устанавливается только на один график для торговли всеми символами Если ваш брокер использует суффикс (например, AUDCAD.a), вам следует обновить имена в параметре Symbol . Настройки ММ и риска
Метод определения размера лота — выберите метод определения ра
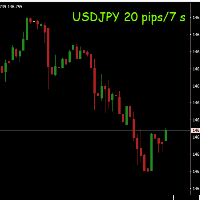
This indicator allows you to view the speed of price movement based on the time set in seconds
Indicator Parameters VisorVelocity_Price_Up_Color - Color to UP price VisorVelocity_Price_Down_Color - Color to Down price VisorVelocity_Price_Zero_Color - Color to Zero VisorVelocity_Price_X_Position - Posicion horizontal in chart VisorVelocity_Price_Y_Position - Posicion vertical in chart VisorVelocity_Price_Size - Size price font VisorVelocityTime - Time to calcule

Main Features Detect the best and most successful point of trend or reversal trend Easy-to-use Stop Loss and Take Profit Scan the number of candles – Amount of history bars to evaluate Intuitive easy setup Configuring not required Suitable for any type of instrument Suitable for any time frame Suitable for any currency pair This EA is fully automated and easy to use. This robot uses Moving Averages working in combination with RSI and MACD filters built in. It is a dynamic EA that is very active

Neural Bands — скальперский индикатор. Есть 2 разные полосы отклонения для уровней перепроданности и перекупленности. Цветные свечи должны определять тренд, если он проходит отклонения и показывает сильный тренд или если цветные свечи останавливаются на отклонениях и возвращаются к среднему значению. Этот советник представляет собой тип регрессионного индикатора, торгующего диапазонами и прорывами цены.
В Neural Bands 2.0 не добавлены стрелки перерисовки.

Live Signal - is a trading system based on the correlation of several classical indicators with certain parameters to achieve the necessary goals of market entry and exit control. The minimum number of parameters greatly simplifies the work with the Expert Advisor. The strategy is based on a classic overbought/oversold system with the possible influence of market strength on the price movement in a certain direction. Recommendations for trading: - H1 GBPUSD currency pair - leverage 1:500 or hig
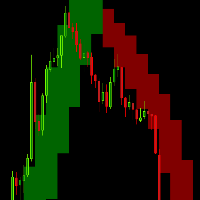
Anyone who is experienced in trading knows that longer time signals are trend signals. That's why it's always good to follow the trends of longer times to make a good trade.
With that in mind, I created the trend indicator in the background
Indicator Parameters TFBar - TimeFrame BackgroundEnabled - Enable Background NumbersOfBars - Numbers of Bar draw ColorUp - Color Up ColorDown - Color Down Smoothing - Heiken-Ashi Smoothing Average
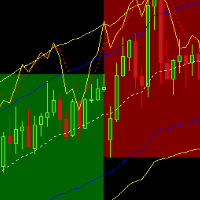
This indicator allows to observe the larger time trends and the stochastic channel on the chart
Indicator Parameters KPeriod - %K period. This is the number of time periods used in the stochastic calculation; DPeriod - %D calculation period Slowing - Slow K calculation period maPeriod - Averaging period maMethod - Averaging method maPrice - Averaging Price LineoverBought2 - line over bought 2 LineoverBought1 - line over bought 1 LineMidle - line midle LineOverSold1 - line over sold 1 LineOv
This robot allows you to automate trading of areas of interest drawn on the chart, such as supply and demand zones identified by order flow and institutional trading strategies. It is a multi-chart bot, so you just need to drag the bot to one of the open charts and it will monitor all the charts at once. How does it work: 1. Open the charts you want to trade. 2. Drag the bot onto only one of the open charts. 3. Select your preferences for Risk, Stop loss Ratio or Take profit Ratio. 4. Activate t
Hello Traders!
I present the old god my "ANUK" strategy, it is an intelligent strategy with 3 types of built-in strategies (you can choose this within its options) it is designed to enter the trade where it detects a strong trend or a market break, it has a built-in algorithm to recover positions and exit quickly, it can be configured to work in some sessions as the trader prefers, it also has a large news detection system, so as not to enter those moments where the market can be very volati
The Bollinger Band is a strategy that has become one of the most useful tools for spotlighting extreme short-term price moves. Bollinger Bands consist of a centerline and two price channels or bands above and below it. The centerline is typically a simple moving average while the price channels are the standard deviations of the stock being studied. The bands expand and contract as the price action of an issue becomes volatile (expansion) or becomes bound into a tight trading pattern (c

Twin Hunters is a bit risky but very profitble Expert Adviser.
Features This EA trades on both Trend Following and Contrarian Trading strategies, so it gains you profit in any market conditions. Frequent trades (it trades multiple times if the market conditions match). Weekend Filter Recommendation Symbol : XAU/USD Timeframe : 15M Minimum deposit : 5,000$ Low spread broker Settings Setting Instruction visual If TRUE, information board is activated
*When in use of strategy tester, it'll be q

The Squeezer indicator simply draws ascending lines with Sell signal in the downtrend and descending lines with Buy signal in the uptrend to catch the pullbacks and sniper entries. This is a common successful trading strategy being used by many successful traders, and the good thing about this strategy is that it works with all time frames. The difference is in the take profit level between them. Buy / Sell signals are triggered at the close of the current candles above / below the ascending or

What Is The Buy OR Sell MT4 Indicator? As the name suggests, the Buy-Sell Indicator is an indicator that tells traders about when to take the buy and sell position on the Forex price chart. This tool is a preference of many traders because it can provide solid indications of the trend and its reversals. In addition, it helps them simplify the hassle of choosing one or more indicators because this one tool alone is enough to provide them with a straight answer. When you apply this indicator

MACros is based on Exponential Moving Average Crossover:
It can be used for: All Pairs: Forex, Cryptocurrencies, Metals, Stocks, Indices. All Timeframe All Brokers All type of Trading Style like Scalping, Swing, Intraday, Short-Term, Long-Term etc. Multiple Chart
***MT5 Version -->> https://www.mql5.com/en/market/product/87474
Notification Setting: All type of notifications and Pop-Up available with this Indicator. (Can manually ON/OFF the notification as per requirements.)
Special No

The EA was developed for the currency pair GBPUSD time frame H4 . The strategy is built for intraday/swing trading - no scalping, martingale, grid, etc. The EA pass through rigorous testing of robustness and is tested on over 18 years of data with 99% modeling quality! Is intend for GBPUSD H4. EA is designed for UTC+2 timezone with New York DST (EST+7). This is a long-term strategy that makes 2-5 trades per month on average - if you want more trades, more profits, risk diversification and a smo
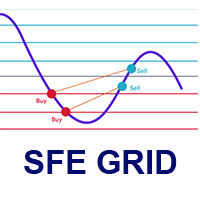
This EA is an Utility for define and execute a grid strategy. Join to the telegram group you can find in my profile page for have access to the different strategies proposed by the SFE community.
BACKTEST AND LIVE The EA must be used on a M5 timeframe chart.
The current version works only in the Long side, and with symbols like BTC, ETH, GOLD, Stock Indices, STOCKS.
Do not work on Forex symbols.
This is a deliberate restriction, because the idea behind is use the strategy under 're

Hedge EA will turn your losing trades into winners using a unique hedging strategy. Once the initial trade moves into negative territory a predefined number of pips or change in signal, the recovery mechanism will kick in: it will place a limited amount of opposite trades at the signal, until all of them can be closed with a small gain. It can trade Crypto, Forex pairs, Metals, Indices but need you optimize. Fully automatic adviser, with a system for recovering from losses. You can choose to

The Bollinger Band is a strategy that has become one of the most useful tools for spotlighting extreme short-term price moves. Bollinger Bands consist of a centerline and two price channels or bands above and below it. The centerline is typically a simple moving average while the price channels are the standard deviations of the stock being studied. The bands expand and contract as the price action of an issue becomes volatile (expansion) or becomes bound into a tight trading pattern (c
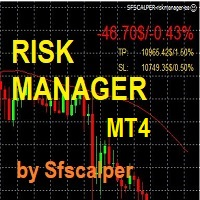
RISK CONTROL MANAGER
Now You can have the same control over risk management as big trading rooms, institutional investors and hedge funds. Managing risk is a fundamental operation for your brokerage. Choose your maximum desired risk exposure in percentage to Your account, set it on the RISK CONTROL MANAGER, the EA will check and make sure that You'll never exceed that. When You ignore the trading risk, and you leave your operations open, that potentially could lead to catastrophic trade expo
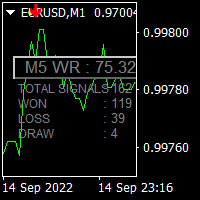
Hi Trader, We are strategy development for Binary and Forex tools, our product have success for binary trading 1 min - 2 min experation. At the moment most of Binary Broker apporev trading with experation conctract 15 minutes and more. We launch MilowLima Indicator for trading 5 minutes to 15 minutes experation is mean can trade from 5 minutes - 15 minutes. Specification of MilowLima trading binary option: Work with specifict time so default setup for Broker use Time Zone GMT+3 auto DST. (exampl

Szia! Egy indikátorral. Több idő gyertyájának kirajzoltatása egy charton. Különböző színek rendelhetők a long és short gyertyákhoz. Vonal vastagsága állítható. A gyertya kitöltése engedélyezhető. Hello! With an indicator. Drawing multiple time candles on a chart. Different colors can be ordered for long and short candles. Line thickness can be adjusted. Filling the candle can be allowed. Videó: https://www.youtube.com/watch?v=-9bequnAw-g& ;ab_channel=GyulaKlein

LUTOS Multicurrency is the advanced scalping system
Is not working on All Broker Tickmill, Eightcap , TMGM broker is good ( IC MARKET is Not Good Broker for this Scalper)
Supported currency pairs: AUD SGD,AUD CHF ,NZD CHF, CAD CHF , EURCHF, USDCAD, USDCHF ,CHFJPY, AUDCAD, EURCAD, EURAUD, NZD CAD and also more pairs Recommended timeframe: M5 , M15 Minim Deposit 100 USD for All Pairs
Tested on Best Broker - write me about detail

ONLY FOR FX MAJOR PAIRS Neural Oscillator is a later evolution of Neuro Scalper found here https://www.mql5.com/en/market/product/72342 It is a cluster signal, a better oscillator than a more traditional one like MACD. Neural Oscillator adds a divergence with momentum type signal compared to Neuro Scalper. Attach to charts. Entry arrows are at 100 for buy and -100 for sell. Example set up in the comments. Simple rules. Trade this as a stand alone system. How to trade: Trade during Act

The Golden Target Indicator is a forex trading tool that displays important market levels on the charts. These levels include: buy and sell areas, overbought and oversold levels, extreme levels, reversal levels and middle level. The price will most likely react at these levels so plan your forex trades accordingly. The Golden Target Indicator fits all kinds of timeframes and currency pairs. It is displayed directly on the main trading chart. The default settings can be modified directly fr

This Robot allows the execution of orders following the trend, whether it is bullish or bearish, it has been tested in the EUR/USD pair in a time range of 8 years from from 2015 to 2022 with a few more than 1000% profit results, it has excellent capital management since it will depend on the The amount entered will also calculate the lottery to reduce the risk of loss.
The robot calculates the lottery from 100 dollars but it is recommended in accounts with a minimum of 1000 dollars The ro

2 copies left at 49 USD. Next price is 99 USD .set file
- This is a very aggressive trading strategy, based on a modified MACD indicator. It is used to analyze the anomalous zones of the market + author's methodology to restore the critical movement. The strategy was developed taking into account the movement of the currency pair USDCHF and the best rates of trade just on it.
Recommendations:
- H1 USDCHF - Leverage of 1:500 or higher (ideally 1:1000 or 1:2000) - Minimum deposit 100 un
MACD EXPLANATION Moving average convergence divergence (MACD, or MAC-D) is a trend-following momentum indicator that shows the relationship between two exponential moving averages (EMA's) of a price. The MACD is calculated by subtracting the 26-period exponential moving average (EMA) from the 12-period EMA. macd is one of the best momentum indicators macd is used by a lot of professional traders when it comes to continuous trade macd is the best choice if used properly even a ne

Scalp Master is a very simple and smooth operation system that is designed to help traders facilitate trading and risk management. No Keyboard need to make, take profit or close orders. Every orders parameters are created automatically based on predefined risk and your strategy lines. Such parameters appear friendly on the screen and you just need 1 click to convert to order. The unique algorithm prevent common missed and hit taking profit strategy. Instead of very subjective partial closed by u

Noize Absorption Index - is the manual trading system that measures the difference of pressure between bears forces and bulls forces. Green line - is a noize free index that showing curent situation. Zero value of index shows totally choppy/flat market.Values above zero level shows how powerfull bullish wave is and values below zero measures bearish forces.Up arrow appears on bearish market when it's ready to reverse, dn arrow appears on weak bullish market, as a result of reverse expectation. S

Crypto Risk Master is a state-of-the-art breakout system that has already stably generated profit for our funds for years. We respect imperfection, and there is no risk-free trading strategy in the financial markets, particularly in Cryptocurrency. The Risk Master is designed as the heart of the system to manage account drawdown as long as the market breakout happens. The system can automatically preserve your profit by optimizing its allocation to future trades. Advanced statistics are applied
MACD EXPLANATION Moving average convergence divergence (MACD, or MAC-D) is a trend-following momentum indicator that shows the relationship between two exponential moving averages (EMA's) of a price. The MACD is calculated by subtracting the 26-period exponential moving average (EMA) from the 12-period EMA. macd is one of the best momentum indicators macd is used by a lot of professional traders when it comes to continuous trade macd is the best choice if used properly even a ne

Easy Technical Indicator is a powerful tool to detect the market trend and its strength . in addition, The signal Line reduce volatility and convert main trends to reliable Buy or Sell Signals --- Contact me in messages for free gift after purchase! --- HISTOGRAM:
It shows the main trend of the market. A histogram above zero means that the market is bullish A histogram below zero means that the market is bearish The height of the histogram bars indicates the strength of the trend weak,

Pullback points indicator - is the manual trading system, that shows most popular market prices. Indicator measures bull/bear waves pressure and looks for "consensus" prices. As a rule these points are crossed up and down very often and opened trade has several chances to be closed in positive zone. Mainly, such points is the good base for "common profit" types of strategies. Indicator also represents "common profit" scalping method of trading as default one. Main Indicator's Features Signa
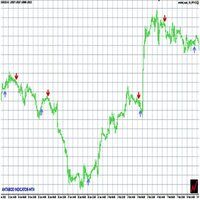
Antabod indicator is a trading system worth being sold for $999, but now $120. For a short period of time the price is now reduce to $60, but may soon go back up to $120 . This forex indicator analyzes the price behavior on the chart every second and determines the ideal entry points, based on the built-in algorithm, informing you when you need to open a deal and close it, to take profit.
It catches very fast and profitable price movements and gives you easy BUY/SELL signals, by Up and Do

This indicator shows the current direction of the market, the moments of reversal and the levels the market can reach. The development is based on years of experience and on the most advanced concepts of fractal analysis, so it adapts to every market and every time frame. The most impressive property is the ability to draw the levels that the market can reach with dozens of bars in advance.

The EA was developed for the currency pair GBPUSD time frame H1 . The strategy is built for intraday/swing trading - no scalping, martingale, grid, etc. The EA pass through rigorous testing of robustness and is tested on over 18 years of data with 99% modeling quality! Is intend for GBPUSD H1. EA is designed for UTC+2 timezone with New York DST (EST+7). This is a long-term strategy that makes 2-5 trades per month on average - if you want more trades, more profits, risk diversification and a smo

Özel Stratejisi ile çalışıyor. Kullanılan işleme giriş İndikatörler(ATR-SAR-KAMA-RSI-TREND-ATR2) Lot ayarını.0. 20 başlattığınız da hedefini Kar Al giderken önce 0.10 daha sonra kalanın ardından 0.5 lot olacak 0.3 ve en son da 0.2 lot kapatır. Parçalayarak Kar alır. ATR ile takip eden Zararı durdur. Görsel Ekranda Kar-Zarar ve Sermaye -Bakiye bilgileri eklenmiştir.

название показателя: Double Joker
описание показателей:
1, подходит для EURUSD, низкие счета.
2, желтые и красные линии достигли выше 90 +, и в то же время носить 90, это сигнал Селла.
3, желтые и красные линии вниз, около 5, и одновременно носить 10, является сигнал buy.
4, необходимо установить точку останова растяжения.
более эффективным был комплексный анализ М1 и М5.

Floating gain meter is the manual trading system that works with local trends and it's scalping. Histogram represents bull/bear floating trend gain. Green color histogram shows choppy market with bullish pressure, Orange - shows choppy market with bearish pressure. Lime and Red colors shows "boiled" places in market. As a rule buy arrow is placed after strong Down movement when it's power becomes weak and choppy market starts. And sell arrow is plotted after strong Up movement when it's power

Are you looking for a reliable support-resistant indicator to help you trade? Look no further! Our support resistance indicator is designed to make your trading experience easier and more efficient. With our indicator, you can find high-probability support and resistant zones and stay on top of the market, so you can take high-probability trades. Try it now and see the difference! support and resistance is the key element in trading just by identifying support and resistance correctly and using

Trend speed vector - is the oscillator for manual trading. System measures trend direction and it's speed. Histogram shows 4 colors: Lime --> Strong up movement with good gain speed; Green --> Up movement with low gain speed Red --> Strong down movement with good gain speed; Orange --> Down movement with low gain speed Green and Orange histograms show weak market's movements and thуese places excluded from signal points. Buy arrow is plotted during strong down movement when bearish gain speed i
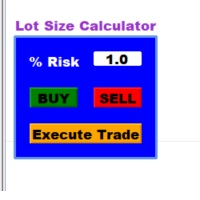
Hey,
It's Jannie here (pronounced Yannie). This is a Lot Size EA calculator and not a manual calculator where you need to manually type in the numbers. It will automatically calculate your lot size based on where you put your stop loss. It will also calculate your risk Reward ratio based on where you decide to take profit. The moment you click on "Buy" or "Sell" on the calculator; two lines will appear on the chart. One for your Stop Loss, and one for your Take Profit. The lines will be cle

View the institutional support and resistance on every time frame with alerts on and off buttons for each timeframe for instant chart decluttering. Monthly, Weekly, Daily, 4hour, 1hr, 30 min, 15min,5min etc. Ability to change colors each timeframe Solid or Outline Use bottom or top of Order Blocks as stop loss = defined risk
My Trading Story Began in 2013 in the wild west of the crypto market, I’ve spent over $10,000 on trading courses and what I've learned from this experience is that man

Forex Dominator is a safe expert advisor that trades pending orders with stop loss and take profit . Forex Dominator EA only trades GBPJPY with a maximum of 3 trades per day around the London open. When pending orders are not triggered they will be deleted at the end of the trading day. All trades have a 1:1 risk reward system, most trades will be closed with a trailing stop loss for a consistent increasing balance curve. With this "Set and forget" expert you will see long term results, you don
蜡烛剩余时间和价格根据行情的涨跌,变换不同颜色.当行情发生变化,就会发生颜色变更,在涨时为一种颜色,在跌时变为另外一种颜色。可以根据颜色的变化知道这一跳是涨还是跌。如果一直为同一颜色,说明现在正在加速进行涨或者跌。 蜡烛剩余时间和价格根据行情的涨跌,变换不同颜色.当行情发生变化,就会发生颜色变更,在涨时为一种颜色,在跌时变为另外一种颜色。可以根据颜色的变化知道这一跳是涨还是跌。如果一直为同一颜色,说明现在正在加速进行涨或者跌。 蜡烛剩余时间和价格根据行情的涨跌,变换不同颜色.当行情发生变化,就会发生颜色变更,在涨时为一种颜色,在跌时变为另外一种颜色。可以根据颜色的变化知道这一跳是涨还是跌。如果一直为同一颜色,说明现在正在加速进行涨或者跌。

Monitor your favorite Symbols My #1 Utility: includes 65+ functions, including this tool | Contact me if you have any questions This tool opens in a separate window: it can be moved (drag anywhere), and minimized [v]. You can adjust the Watchlist on the panel: Click [edit list] to add / remove the Symbols from the Watchlist. Calculated value: it may either be the last [closed bar], or the current [floating bar]. Select the [timeframe] for calculation. There are 2 types of the value sorti

Expert for portfolio of basic set long term strategies. You can choose for your AOS trading two ways – first way is purchased for EA with grid, martingale and other similar dangerous strategies. This EAs work great and have very profitable results – days, weeks, maybe months, years?.. Until they didn’t blow up your account. The second way is to use EAs based on real trading strategies and logical patterns. On MQL Market are very few of these strategies. The risk of trading with these EAs

Visualization of the economic events on the chart My #1 Utility: includes 65+ functions, including this indicator | Contact me if you have any questions | MT5 version The indicator draws a vertical lines, showing you when economic news are coming.
In the input settings you can adjust: Only for the current Symbol : if true, only events for the selected symbol will be displayed. Show past events : if true, past events will remain on the chart. Color : separately for 3 types of events

Floating peaks oscillator - it the manual trading system. It's based on Stochastik/RSI type of oscillator with dynamic/floating overbought and oversold levels. When main line is green - market is under bullish pressure, when main line is red - market is under bearish pressure. Buy arrow appears at the floating bottom and sell arrow appears at floating top. Indicator allows to reverse signal types. Main indicator's adjustable inputs : mainTrendPeriod; signalTrendPeriod; smoothedTrendPeriod; tre

TIO Surfing – это стратегия торговли, которая подразумевает разбиение графика на сектора, поиск важных уровней и потенциально разворотных зон для торговли в этих участках. То есть по сути мы получаем некоторую комбинацию из скальпинга и среднесрочной торговли, что является очень эффективным. В основе работы советника применение секторной торговли. Используя разные периоды, ищутся повторяющиеся паттерны. И затем советник проплывает по волнам секторов от разных периодов на сети ордеров.

ABOUT THE EA Sun Expert is a automated robot trading designed to work on the most traded currency any pair. The strategy is based on using several MT4 indicators, each entry point is calculated using an advanced input filter based on the analysis of the movement of the price chart. Each order is secured by a fixed stop-loss while, no martingale, no grid, or hedge.
INPUTS:
· CustomOrderComment - Adds your own comment to the comment field of each trade.
• Magic Order - is a special num

Precautions for subscribing to indicator This indicator only supports the computer version of MT4 Does not support MT5, mobile phones, tablets The indicator only shows the day's entry arrow The previous history arrow will not be displayed (Live broadcast is for demonstration) The indicator is a trading aid Is not a EA automatic trading No copy trading function
The indicator only indicates the entry position No exit (target profit)
The entry stop loss point is set at 30-50 PIPS Or the front

Triple trend index is the manual trading system/indicator. It looks for trend reversal points according to main trend index datas. Indicator represents 4 lines. 3 lines shows trend power by main market's parametres. 4th line (OrangeRed) is the main index. When line is above zero level - market is bullish, value below zero show bearish pressure. Indicator "looks" for weak places(reversal points) on bullish market to plot a sell arrow and weak places(reversal points) on bearish market to plot a
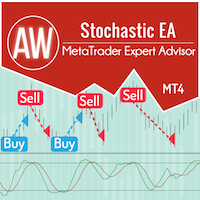
Автоматизированная продвинутый торговая система. Советник торгует по сигналам классического индикатора Stochastic". Для выхода из позиций использует интеллектуальную систему трейлинга и усреднение с помощью отложенных ордеров. Преимущества: Полностью автоматизированная торговая система Настраиваемые сигналы осциллятора для работы робота Интуитивно простая настройка входных переменных Подходит для любых типов инструментов и любых таймфреймов Встроенная система регулируемая система трейлинга О

The EA was developed for the currency pair EURUSD time frame M15 . The strategy is built for intraday/swing trading - no scalping, martingale, grid, etc. The EA pass through rigorous testing of robustness and is tested on over 18 years of data with 99% modeling quality! Is intend for EURUSD M15. EA is designed for UTC+2 timezone with New York DST (EST+7). This is a long-term strategy that makes 2-5 trades per month on average - if you want more trades, more profits, risk diversification and a s
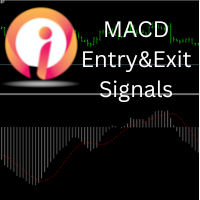
This indicator will show Entry and Exits using MACD and Moving average crossover. User can change settings to find best results from back testing. Profits and losses on candle close price is calculated and shown on screen of chart. Here any MACD settings and any Moving average crossover exit settings on various charts and various timeframes can be used. Watch video for few tests performed. Best wishes for trading.

Impulse fractals indicator - is counter-trend oriented complex market fractal pattern. Market creates bull/bear impulse, trend starts, fractals on impulsed wave are an agressive pullback signals. Buy arrow is plotted when market is bearish and it's impulse showed up-side fractal, and sell arrow is plotted when market is bullish and it's impulse showed dn-side fractal. Main indicator's adjustable inputs : impulsePeriod - main period of impulse histogram filterPeriod - smoothes impulse accordi

TPM Cross (trend power moving cross) - is a trend following strategy based on custom signal points. Indicator consists from main custom moving chart line and trend power line. Indicator defines up and down movements by it's trend power and custom moving direction. When current market's trend looses it's power and opposite trend starts - power trend line crosses moving and indicator plots an arrow. Main indicator's adjustable inputs : movingPeriod - period of moving line trendPeriod - period

XFlow показывает расширяющийся ценовой канал помогающий определять тренд и моменты его разворота. Используется также при сопровождении сделок для установки тейк-профит/стоп-лосс и усреднений. Практически не имеет параметров и очень прост в использовании - просто укажите важный для вас момент истории и индикатор рассчитает ценовой канал. ОТОБРАЖАЕМЫЕ ЛИНИИ
ROTATE - толстая сплошная линия. Центр общего вращения цены. Цена делает широкие циклические движения вокруг линии ROTATE. Положение цены око

This indicator takes input from the RSI, combined with a trend filter. Great for scalping. Does not feature any alerts and is best used manually. Settings: TrendFilterPeriod RSIPeriod Set these parameters to your preference. How to use: Attach to any chart with default settings. Can be used on any time frame. If used on lower time frames, check higher time frames too. Buy : - Wait for blue histo color to cross above level 50, then open buys. **Best results when checking the higher time frames to
That is my master piece invented new Forex indicator Copyright 2010 to 2100 (316009) for Sami A. Saydam. This indicator is showing the real Support and Resistance levels in dynamical ways as movable red lines with time, also works on all time charts' intervals. The price movements are strongly respecting those red lines and either confirmed break them or just touching them and can't break them up or down then move toward the right directions. This new techniques are the real alerting system ca

Potential loss on all active and pending trades: if SL levels will be reached (or the current floating loss if the SL level is not set) My #1 Utility: includes 65+ functions, including this indicator | Contact me if you have any questions In the input settings you can adjust: Calculateion method : account currency / pips / points / % of the balance Position on the chart: bottom left / bottom right / top left / top right corner
Font: color, size and style Optionally you can includ
Absolute volatility for each day for the last 4 weeks My #1 Utility: includes 65+ functions, including this indicator | Contact me if you have any questions The indicator is displayed in a separate window, it can be moved to any place on the chart. In the input settings you can adjust: Interface theme : dark / white; Calculation method: price, pips, points, % change;
Panel size Font size
Supply / demand zones: observable areas where price has approached many times in the past. My #1 Utility: includes 65+ functions, including this indicator | Contact me if you have any questions The indicator shows where the price could potentially be reversed again. Usually, the more times the price has been rejected from the level, the more significant it is. In the input settings you can adjust: Enable or disbale Weak zones; Show or hide zone description; Font size; Set the basic col

EA SUPER MATAELANG PRO
See Live Result : https://www.mql5.com/en/signals/2040079?source=Site +Profile+Seller https://www.mql5.com/en/signals/2146550?source=Site +Profile+Seller
About EA:
This EA uses some very sophisticated indicators. Can detect trend direction with high accuracy. It also has a safety system to anticipate if the price direction is not in the same direction as the position. Using security in the form of an averaging or martingale system Best used in the m15 time frame. Th

Только первые 5 экземпляров по цене 49usd, последующие 5 экземпляров по цене 99usd, следующие 5 экземпляров по цене 149usd и так далее. Подобно истинному дону, торговый советник EA DonCorleone, никогда не спорит, не гневается и не угрожает рынку. Этот советник действует всегда размеренно, не поддаваясь эмоциям, сугубо в рамках своей логики, опираясь на свои логические расчеты и доводы. Не хватая звезд с неба данный советник не даст Вам золотые горы здесь и сейчас, но так же было и у Дона Карлио

The Th3Eng Ninja indicator is based on an analysis of the right trend direction with perfect custom algorithms. It show the true direction and the best point of the trend. With Stop Loss point and Three Take Profit points. Also it provides a secondary entry points in dots arrows style. And Finally it draws a very helpful lines from entry level to TP1, TP2, TP3, SL levels or the reverse signal, and all current/old signals status.
How to use the indicator
No complicated steps , Just follow 2
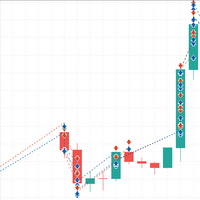
Matrix Hacker предназначен только для хеджированных счетов и использует случайное блуждание, прошлое не имеет значения. Советник поддерживает стабильную позицию на рынке и покрывает как запросы, так и запросы. Покупает и продает биды и аски с разным размером и объемом в зависимости от трейдера. Это не рекомендуется для новичков, так как все еще требует знаний об оптимизации, а не о чрезмерном использовании. Я рекомендую использовать настройки для скальпинга с меньшими пунктами и держаться в диа

... *** Signal : https://www.mql5.com/en/signals/1743955 EA Fx Lion Gold Trading is an Expert Advisor designed specifically for trading Gold (XAUUSD) work process will calculate support and resistance including the highest and lowest price of each candlestick The EA will calculate pending orders at the highest or lowest price after the support/resistance level. and will close the pending order on the next day if not in use -EA does not martingale -EA have Stop Loss and Take Profit to prote

Gold Scalping Indicator - индикатор для внитридневной торговли на золоте XAUUSD. Индикатор определяет точки разворота цены и рисует сигналы на графике. Так же индикатор отправляет сигналы на телефон. Когда индикатор рисует красную точку, это означает, что цена возможно развернется сейчас вниз. Когда индикатор рисует синюю стрелку, это означает, что цена возможно развернется сейчас вверх. Учитывая эту информацию, каждый трейдер, сможет построить эффективную торговую систему на золоте. Золото очен
MetaTrader Маркет - уникальная площадка по продаже роботов и технических индикаторов, не имеющая аналогов.
Памятка пользователя MQL5.community расскажет вам и о других возможностях, доступных трейдерам только у нас: копирование торговых сигналов, заказ программ для фрилансеров, автоматические расчеты через платежную систему, аренда вычислительных мощностей в MQL5 Cloud Network.
Вы упускаете торговые возможности:
- Бесплатные приложения для трейдинга
- 8 000+ сигналов для копирования
- Экономические новости для анализа финансовых рынков
Регистрация
Вход
Если у вас нет учетной записи, зарегистрируйтесь
Для авторизации и пользования сайтом MQL5.com необходимо разрешить использование файлов Сookie.
Пожалуйста, включите в вашем браузере данную настройку, иначе вы не сможете авторизоваться.