
Outras classes na biblioteca DoEasy (Parte 69): classe-coleção de objetos-gráficos

Sumário
- Ideia
- Aprimorando as classes da biblioteca
- Classe-coleção de objetos-gráficos
- Teste
- O que vem agora?
Ideia
Bem, preparamos uma funcionalidade para usar objetos-gráficos, temos um objeto-gráfico que contém as listas de objetos-janelas do gráfico que, por sua vez, contêm listas dos indicadores anexados. É hora de combinar tudo isso numa coleção de objetos-gráficos que nos permitirá ter acesso conveniente a qualquer gráfico aberto no terminal. Com essa coleção não só poderemos ordenar, pesquisar e obter listas de objetos-gráficos por qualquer uma de suas propriedades, mas também usar um ou vários gráficos de maneira conveniente.
Aprimorando as classes da biblioteca
Em primeiro lugar, vamos adicionar novas mensagens à biblioteca.
No arquivo \MQL5\Include\DoEasy\Data.mqh inserimos os índices das novas mensagens:
   MSG_CHART_OBJ_CHART_WINDOW,                        // Main chart window
   MSG_CHART_OBJ_CHART_SUBWINDOW,                     // Chart subwindow
   MSG_CHART_OBJ_CHART_SUBWINDOWS_NUM,                // Subwindows
   MSG_CHART_OBJ_INDICATORS_MW_NAME_LIST,             // Indicators in the main chart window
   MSG_CHART_OBJ_INDICATORS_SW_NAME_LIST,             // Indicators in the chart window
   MSG_CHART_OBJ_INDICATOR,                           // Indicator
   MSG_CHART_OBJ_INDICATORS_TOTAL,                    // Indicators
   MSG_CHART_OBJ_WINDOW_N,                            // Window
   MSG_CHART_OBJ_INDICATORS_NONE,                     // No indicators

//--- CChartObjCollection
   MSG_CHART_COLLECTION_TEXT_CHART_COLLECTION,        // Chart collection
   MSG_CHART_COLLECTION_ERR_FAILED_CREATE_CHART_OBJ,  // Failed to create a new chart object
   MSG_CHART_COLLECTION_ERR_FAILED_ADD_CHART,         // Failed to add a chart object to the collection

  };
//+------------------------------------------------------------------+
bem como os textos das mensagens correspondentes aos índices adicionados recentemente:
   {"Главное окно графика","Main chart window"},
   {"Подокно графика","Chart subwindow"},
   {"Подокон","Subwindows"},
   {"Индикаторы в главном окне графика","Indicators in the main chart window"},
   {"Индикаторы в окне графика","Indicators in the chart window"},
   {"Индикатор","Indicator"},
   {"Индикаторов","Indicators total"},
   {"Окно","Window"},
   {"Отсутствуют","No indicators"},

//--- CChartObjCollection
   {"Коллекция чартов","Chart collection"},
   {"Не удалось создать новый объект-чарт","Failed to create new chart object"},
   {"Не удалось добавить объект-чарт в коллекцию","Failed to add chart object to collection"},

  };
//+---------------------------------------------------------------------+
Nossa coleção de objetos-gráficos deve rastrear alterações no número de gráficos abertos e no número de janelas abertas, a fim de fazer alterações oportunas em nossas listas de gráficos e janelas abertas. Algumas mudanças podem ser rastreadas no manipulador OnChartEvent(), mas os testes mostraram que basicamente este indica que o gráfico sofreu algumas alterações - evento de alteração do gráfico (CHARTEVENT_CHART_CHANGE), ou seja, não há especificações. Portanto, trabalharemos com o temporizador do programa e rastrearemos independentemente as alterações no número de gráficos e de janelas abertas. Outras alterações que ocorrem no gráfico podem ser rastreadas quer usando o manipulador OnChartEvent() mencionado acima quer herdando o objeto gráfico e o objeto-janela do objeto-gráfico da biblioteca CBaseObjExt, que por sua vez é o herdeiro do objeto base de todos os objetos da biblioteca CBaseObj e dá funcionalidade de evento adicional aos seus objetos descendentes. Isso é necessário caso necessitemos de tal funcionalidade para trabalhar com gráficos posteriormente.
Uma vez que o trabalho com gráficos é realizado principalmente em modo semiautomático, bastará verificarmos o número atual de gráficos e janelas duas vezes por segundo para determinar as mudanças no número de gráficos e janelas abertos e compará-lo com o número anterior. Se não houver mudanças, nada precisa ser feito. Se houver alterações no número de janelas e gráficos, vamos atualizar os dados de nossa coleção.
Para os objetos-gráficos funcionarem no temporizador, precisaremos de mais um contador de temporizador de coleção de objetos-gráficos. Cada coleção no temporizador tem seu próprio contador de temporizador, o que nos permite acompanhar a frequência de atualização definida para a coleção. Além dos parâmetros do contador, precisaremos adicionar o identificador da nova coleção, uma vez que cada coleção de objetos possui seu próprio identificador para determinar a qual coleção pertence uma determinada lista de objetos.
Na seção "Substituição de macros" do arquivo \MQL5\Include\DoEasy\Defines.mqh escrevemos os parâmetros do contador de temporizador da coleção de objetos-gráficos e o identificador da lista coleção de objetos-gráficos:
//+------------------------------------------------------------------+
//| Macro substitutions                                              |
//+------------------------------------------------------------------+
//--- Describe the function with the error line number
#define DFUN_ERR_LINE                  (__FUNCTION__+(TerminalInfoString(TERMINAL_LANGUAGE)=="Russian" ? ", Page " : ", Line ")+(string)__LINE__+": ")
#define DFUN                           (__FUNCTION__+": ")        // "Function description"
#define COUNTRY_LANG                   ("Russian")                // Country language
#define END_TIME                       (D'31.12.3000 23:59:59')   // End date for account history data requests
#define TIMER_FREQUENCY                (16)                       // Minimal frequency of the library timer in milliseconds
#define TOTAL_TRADE_TRY                (5)                        // Default number of trading attempts
#define IND_COLORS_TOTAL               (64)                       // Maximum possible number of indicator buffer colors
#define IND_BUFFERS_MAX                (512)                      // Maximum possible number of indicator buffers
//--- Standard sounds
#define SND_ALERT                      "alert.wav"
#define SND_ALERT2                     "alert2.wav"
#define SND_CONNECT                    "connect.wav"
#define SND_DISCONNECT                 "disconnect.wav"
#define SND_EMAIL                      "email.wav"
#define SND_EXPERT                     "expert.wav"
#define SND_NEWS                       "news.wav"
#define SND_OK                         "ok.wav"
#define SND_REQUEST                    "request.wav"
#define SND_STOPS                      "stops.wav"
#define SND_TICK                       "tick.wav"
#define SND_TIMEOUT                    "timeout.wav"
#define SND_WAIT                       "wait.wav"
//--- Parameters of the orders and deals collection timer
#define COLLECTION_ORD_PAUSE           (250)                      // Orders and deals collection timer pause in milliseconds
#define COLLECTION_ORD_COUNTER_STEP    (16)                       // Increment of the orders and deals collection timer counter
#define COLLECTION_ORD_COUNTER_ID      (1)                        // Orders and deals collection timer counter ID
//--- Parameters of the account collection timer
#define COLLECTION_ACC_PAUSE           (1000)                     // Account collection timer pause in milliseconds
#define COLLECTION_ACC_COUNTER_STEP    (16)                       // Account timer counter increment
#define COLLECTION_ACC_COUNTER_ID      (2)                        // Account timer counter ID
//--- Symbol collection timer 1 parameters
#define COLLECTION_SYM_PAUSE1          (100)                      // Pause of the symbol collection timer 1 in milliseconds (for scanning market watch symbols)
#define COLLECTION_SYM_COUNTER_STEP1   (16)                       // Increment of the symbol timer 1 counter
#define COLLECTION_SYM_COUNTER_ID1     (3)                        // Symbol timer 1 counter ID
//--- Symbol collection timer 2 parameters
#define COLLECTION_SYM_PAUSE2          (300)                      // Pause of the symbol collection timer 2 in milliseconds (for events of the market watch symbol list)
#define COLLECTION_SYM_COUNTER_STEP2   (16)                       // Increment of the symbol timer 2 counter
#define COLLECTION_SYM_COUNTER_ID2     (4)                        // Symbol timer 2 counter ID
//--- Trading class timer parameters
#define COLLECTION_REQ_PAUSE           (300)                      // Trading class timer pause in milliseconds
#define COLLECTION_REQ_COUNTER_STEP    (16)                       // Trading class timer counter increment
#define COLLECTION_REQ_COUNTER_ID      (5)                        // Trading class timer counter ID
//--- Parameters of the timeseries collection timer
#define COLLECTION_TS_PAUSE            (64)                       // Timeseries collection timer pause in milliseconds
#define COLLECTION_TS_COUNTER_STEP     (16)                       // Account timer counter increment
#define COLLECTION_TS_COUNTER_ID       (6)                        // Timeseries timer counter ID
//--- Parameters of the timer of indicator data timeseries collection
#define COLLECTION_IND_TS_PAUSE        (64)                       // Pause of the timer of indicator data timeseries collection in milliseconds
#define COLLECTION_IND_TS_COUNTER_STEP (16)                       // Increment of indicator data timeseries timer counter
#define COLLECTION_IND_TS_COUNTER_ID   (7)                        // ID of indicator data timeseries timer counter
//--- Parameters of the tick series collection timer
#define COLLECTION_TICKS_PAUSE         (64)                       // Tick series collection timer pause in milliseconds
#define COLLECTION_TICKS_COUNTER_STEP  (16)                       // Tick series timer counter increment step
#define COLLECTION_TICKS_COUNTER_ID    (8)                        // Tick series timer counter ID
//--- Parameters of the chart collection timer
#define COLLECTION_CHARTS_PAUSE        (500)                      // Chart collection timer pause in milliseconds
#define COLLECTION_CHARTS_COUNTER_STEP (16)                       // Chart timer counter increment
#define COLLECTION_CHARTS_COUNTER_ID   (9)                        // Chart timer counter ID
//--- Collection list IDs
#define COLLECTION_HISTORY_ID          (0x777A)                   // Historical collection list ID
#define COLLECTION_MARKET_ID           (0x777B)                   // Market collection list ID
#define COLLECTION_EVENTS_ID           (0x777C)                   // Event collection list ID
#define COLLECTION_ACCOUNT_ID          (0x777D)                   // Account collection list ID
#define COLLECTION_SYMBOLS_ID          (0x777E)                   // Symbol collection list ID
#define COLLECTION_SERIES_ID           (0x777F)                   // Timeseries collection list ID
#define COLLECTION_BUFFERS_ID          (0x7780)                   // Indicator buffer collection list ID
#define COLLECTION_INDICATORS_ID       (0x7781)                   // Indicator collection list ID
#define COLLECTION_INDICATORS_DATA_ID  (0x7782)                   // Indicator data collection list ID
#define COLLECTION_TICKSERIES_ID       (0x7783)                   // Tick series collection list ID
#define COLLECTION_MBOOKSERIES_ID      (0x7784)                   // DOM series collection list ID
#define COLLECTION_MQL5_SIGNALS_ID     (0x7785)                   // MQL5 signals collection list ID
#define COLLECTION_CHARTS_ID           (0x7786)                   // Chart collection list ID
//--- Data parameters for file operations
Na enumeração das propriedades inteiras do gráfico removemos a constante CHART_PROP_WINDOW_IS_VISIBLE, pois não encontrei um uso prático dessa propriedade para um objeto. Assim, diminuiremos em 1 o valor do número de propriedades inteiras (de 67 para 66):
#define CHART_PROP_INTEGER_TOTAL (66) // Número total de propriedades inteiras
Vamos corrigir os critérios para classificar os objetos-gráficos por propriedades, adicionando as propriedades para classificar objetos que ignorei anteriormente:
//+------------------------------------------------------------------+
//| Possible chart sorting criteria                                  |
//+------------------------------------------------------------------+
#define FIRST_CHART_DBL_PROP  (CHART_PROP_INTEGER_TOTAL-CHART_PROP_INTEGER_SKIP)
#define FIRST_CHART_STR_PROP  (CHART_PROP_INTEGER_TOTAL-CHART_PROP_INTEGER_SKIP+CHART_PROP_DOUBLE_TOTAL-CHART_PROP_DOUBLE_SKIP)
enum ENUM_SORT_CHART_MODE
  {
//--- Sort by integer properties
   SORT_BY_CHART_ID = 0,                              // Sort by chart ID
   SORT_BY_CHART_TIMEFRAME,                           // Sort by chart timeframe
   SORT_BY_CHART_SHOW,                                // Sort by the price chart drawing attribute
   SORT_BY_CHART_IS_OBJECT,                           // Sort by chart object (OBJ_CHART) identification attribute
E vamos remover a constante SORT_BY_CHART_WINDOW_IS_VISIBLE da lista de constantes desta enumeração, pois não usaremos esta propriedade no objeto.
Todos os objetos cujas coleções temos na biblioteca, possuem suas próprias listas que podem ser classificadas por propriedades de objetos. A lista da coleção de objetos-gráficos também terá a capacidade de classificar - para localizar e selecionar objetos com os valores de propriedade necessários. Para cada um desses objetos, criamos nossos próprios métodos de classificação escritos no arquivo \MQL5\Include\DoEasy\Services\Select.mqh.
Vamos adicionar novos métodos ao arquivo de classe CSelect para organizar a pesquisa e classificação de objetos-gráficos.
Vamos anexar o arquivo de classe do objeto-gráfico ao arquivo de classe CSelect:
//+------------------------------------------------------------------+
//| Include files                                                    |
//+------------------------------------------------------------------+
#include <Arrays\ArrayObj.mqh>
#include "..\Objects\Orders\Order.mqh"
#include "..\Objects\Events\Event.mqh"
#include "..\Objects\Accounts\Account.mqh"
#include "..\Objects\Symbols\Symbol.mqh"
#include "..\Objects\PendRequest\PendRequest.mqh"
#include "..\Objects\Series\SeriesDE.mqh"
#include "..\Objects\Indicators\Buffer.mqh"
#include "..\Objects\Indicators\IndicatorDE.mqh"
#include "..\Objects\Indicators\DataInd.mqh"
#include "..\Objects\Ticks\DataTick.mqh"
#include "..\Objects\Book\MarketBookOrd.mqh"
#include "..\Objects\MQLSignalBase\MQLSignal.mqh"
#include "..\Objects\Chart\ChartObj.mqh"
//+------------------------------------------------------------------+
No final da listagem do corpo da classe declaramos novos métodos:
//+------------------------------------------------------------------+
//| Methods of working with chart data                               |
//+------------------------------------------------------------------+
   //--- Return the list of charts with one of (1) integer, (2) real and (3) string properties meeting a specified criterion
   static CArrayObj *ByChartProperty(CArrayObj *list_source,ENUM_CHART_PROP_INTEGER property,long value,ENUM_COMPARER_TYPE mode);
   static CArrayObj *ByChartProperty(CArrayObj *list_source,ENUM_CHART_PROP_DOUBLE property,double value,ENUM_COMPARER_TYPE mode);
   static CArrayObj *ByChartProperty(CArrayObj *list_source,ENUM_CHART_PROP_STRING property,string value,ENUM_COMPARER_TYPE mode);
   //--- Return the chart index with the maximum value of the (1) integer, (2) real and (3) string properties
   static int        FindChartMax(CArrayObj *list_source,ENUM_CHART_PROP_INTEGER property);
   static int        FindChartMax(CArrayObj *list_source,ENUM_CHART_PROP_DOUBLE property);
   static int        FindChartMax(CArrayObj *list_source,ENUM_CHART_PROP_STRING property);
   //--- Return the chart index with the minimum value of the (1) integer, (2) real and (3) string properties
   static int        FindChartMin(CArrayObj *list_source,ENUM_CHART_PROP_INTEGER property);
   static int        FindChartMin(CArrayObj *list_source,ENUM_CHART_PROP_DOUBLE property);
   static int        FindChartMin(CArrayObj *list_source,ENUM_CHART_PROP_STRING property);
//---
  };
//+------------------------------------------------------------------+
Fora do corpo da classe, escrevemos sua implementação:
//+------------------------------------------------------------------+
//| Methods of working with chart data                               |
//+------------------------------------------------------------------+
//+------------------------------------------------------------------+
//| Return the list of charts with one integer                       |
//| property meeting the specified criterion                         |
//+------------------------------------------------------------------+
CArrayObj *CSelect::ByChartProperty(CArrayObj *list_source,ENUM_CHART_PROP_INTEGER property,long value,ENUM_COMPARER_TYPE mode)
  {
   if(list_source==NULL) return NULL;
   CArrayObj *list=new CArrayObj();
   if(list==NULL) return NULL;
   list.FreeMode(false);
   ListStorage.Add(list);
   int total=list_source.Total();
   for(int i=0; i<total; i++)
     {
      CChartObj *obj=list_source.At(i);
      if(!obj.SupportProperty(property)) continue;
      long obj_prop=obj.GetProperty(property);
      if(CompareValues(obj_prop,value,mode)) list.Add(obj);
     }
   return list;
  }
//+------------------------------------------------------------------+
//| Return the list of charts with one real                          |
//| property meeting the specified criterion                         |
//+------------------------------------------------------------------+
CArrayObj *CSelect::ByChartProperty(CArrayObj *list_source,ENUM_CHART_PROP_DOUBLE property,double value,ENUM_COMPARER_TYPE mode)
  {
   if(list_source==NULL) return NULL;
   CArrayObj *list=new CArrayObj();
   if(list==NULL) return NULL;
   list.FreeMode(false);
   ListStorage.Add(list);
   for(int i=0; i<list_source.Total(); i++)
     {
      CChartObj *obj=list_source.At(i);
      if(!obj.SupportProperty(property)) continue;
      double obj_prop=obj.GetProperty(property);
      if(CompareValues(obj_prop,value,mode)) list.Add(obj);
     }
   return list;
  }
//+------------------------------------------------------------------+
//| Return the list of charts with one string                        |
//| property meeting the specified criterion                         |
//+------------------------------------------------------------------+
CArrayObj *CSelect::ByChartProperty(CArrayObj *list_source,ENUM_CHART_PROP_STRING property,string value,ENUM_COMPARER_TYPE mode)
  {
   if(list_source==NULL) return NULL;
   CArrayObj *list=new CArrayObj();
   if(list==NULL) return NULL;
   list.FreeMode(false);
   ListStorage.Add(list);
   for(int i=0; i<list_source.Total(); i++)
     {
      CChartObj *obj=list_source.At(i);
      if(!obj.SupportProperty(property)) continue;
      string obj_prop=obj.GetProperty(property);
      if(CompareValues(obj_prop,value,mode)) list.Add(obj);
     }
   return list;
  }
//+------------------------------------------------------------------+
//| Return the chart index in the list                               |
//| with the maximum integer property value                          |
//+------------------------------------------------------------------+
int CSelect::FindChartMax(CArrayObj *list_source,ENUM_CHART_PROP_INTEGER property)
  {
   if(list_source==NULL) return WRONG_VALUE;
   int index=0;
   CChartObj *max_obj=NULL;
   int total=list_source.Total();
   if(total==0) return WRONG_VALUE;
   for(int i=1; i<total; i++)
     {
      CChartObj *obj=list_source.At(i);
      long obj1_prop=obj.GetProperty(property);
      max_obj=list_source.At(index);
      long obj2_prop=max_obj.GetProperty(property);
      if(CompareValues(obj1_prop,obj2_prop,MORE)) index=i;
     }
   return index;
  }
//+------------------------------------------------------------------+
//| Return the chart index in the list                               |
//| with the maximum real property value                             |
//+------------------------------------------------------------------+
int CSelect::FindChartMax(CArrayObj *list_source,ENUM_CHART_PROP_DOUBLE property)
  {
   if(list_source==NULL) return WRONG_VALUE;
   int index=0;
   CChartObj *max_obj=NULL;
   int total=list_source.Total();
   if(total==0) return WRONG_VALUE;
   for(int i=1; i<total; i++)
     {
      CChartObj *obj=list_source.At(i);
      double obj1_prop=obj.GetProperty(property);
      max_obj=list_source.At(index);
      double obj2_prop=max_obj.GetProperty(property);
      if(CompareValues(obj1_prop,obj2_prop,MORE)) index=i;
     }
   return index;
  }
//+------------------------------------------------------------------+
//| Return the chart index in the list                               |
//| with the maximum string property value                           |
//+------------------------------------------------------------------+
int CSelect::FindChartMax(CArrayObj *list_source,ENUM_CHART_PROP_STRING property)
  {
   if(list_source==NULL) return WRONG_VALUE;
   int index=0;
   CChartObj *max_obj=NULL;
   int total=list_source.Total();
   if(total==0) return WRONG_VALUE;
   for(int i=1; i<total; i++)
     {
      CChartObj *obj=list_source.At(i);
      string obj1_prop=obj.GetProperty(property);
      max_obj=list_source.At(index);
      string obj2_prop=max_obj.GetProperty(property);
      if(CompareValues(obj1_prop,obj2_prop,MORE)) index=i;
     }
   return index;
  }
//+------------------------------------------------------------------+
//| Return the chart index in the list                               |
//| with the minimum integer property value                          |
//+------------------------------------------------------------------+
int CSelect::FindChartMin(CArrayObj* list_source,ENUM_CHART_PROP_INTEGER property)
  {
   int index=0;
   CChartObj *min_obj=NULL;
   int total=list_source.Total();
   if(total==0) return WRONG_VALUE;
   for(int i=1; i<total; i++)
     {
      CChartObj *obj=list_source.At(i);
      long obj1_prop=obj.GetProperty(property);
      min_obj=list_source.At(index);
      long obj2_prop=min_obj.GetProperty(property);
      if(CompareValues(obj1_prop,obj2_prop,LESS)) index=i;
     }
   return index;
  }
//+------------------------------------------------------------------+
//| Return the chart index in the list                               |
//| with the minimum real property value                             |
//+------------------------------------------------------------------+
int CSelect::FindChartMin(CArrayObj* list_source,ENUM_CHART_PROP_DOUBLE property)
  {
   int index=0;
   CChartObj *min_obj=NULL;
   int total=list_source.Total();
   if(total== 0) return WRONG_VALUE;
   for(int i=1; i<total; i++)
     {
      CChartObj *obj=list_source.At(i);
      double obj1_prop=obj.GetProperty(property);
      min_obj=list_source.At(index);
      double obj2_prop=min_obj.GetProperty(property);
      if(CompareValues(obj1_prop,obj2_prop,LESS)) index=i;
     }
   return index;
  }
//+------------------------------------------------------------------+
//| Return the chart index in the list                               |
//| with the minimum string property value                           |
//+------------------------------------------------------------------+
int CSelect::FindChartMin(CArrayObj* list_source,ENUM_CHART_PROP_STRING property)
  {
   int index=0;
   CChartObj *min_obj=NULL;
   int total=list_source.Total();
   if(total==0) return WRONG_VALUE;
   for(int i=1; i<total; i++)
     {
      CChartObj *obj=list_source.At(i);
      string obj1_prop=obj.GetProperty(property);
      min_obj=list_source.At(index);
      string obj2_prop=min_obj.GetProperty(property);
      if(CompareValues(obj1_prop,obj2_prop,LESS)) index=i;
     }
   return index;
  }
//+------------------------------------------------------------------+
Na seção "Organizando a busca" do artigo 3 examinamos em detalhes a operação desses métodos.
Quando o número de janelas anexadas ao gráfico muda, os índices da janela mudam, portanto, em alguns casos, podemos precisar definir um novo índice de janela. No arquivo da classe do objeto-janela do gráfico, objeto \MQL5\Include\DoEasy\Objects\Chart\ChartWnd.mqh na seção pública da classe vamos escrever um novo método para definir o índice da janela:
//+------------------------------------------------------------------+
//| Chart window indicator object class                              |
//+------------------------------------------------------------------+
class CWndInd : public CObject
  {
private:
   long              m_chart_id;                         // Chart ID
   string            m_name;                             // Indicator short name
   int               m_index;                            // Window index on the chart
   int               m_handle;                           // Indicator handle
public:
//--- Return itself
   CWndInd          *GetObject(void)                     { return &this;         }
//--- Return (1) indicator name, (2) window index and (3) indicator handle
   string            Name(void)                    const { return this.m_name;   }
   int               Index(void)                   const { return this.m_index;  }
   int               Handle(void)                  const { return this.m_handle; }
//--- Set the index of the on-chart window
   void              SetIndex(const int index)           { this.m_index=index;   }

//--- Display the description of object properties in the journal (dash=true - hyphen before the description, false - description only)
   void              Print(const bool dash=false)        { ::Print((dash ? "- " : "")+this.Header());                      }
//--- Return the object short name
   string            Header(void)                  const { return CMessage::Text(MSG_CHART_OBJ_INDICATOR)+" "+this.Name(); }

//--- Compare CWndInd objects with each other by the specified property
   virtual int       Compare(const CObject *node,const int mode=0) const;

//--- Constructors
                     CWndInd(void);
                     CWndInd(const int handle,const string name,const int index) : m_handle(handle),m_name(name),m_index(index) {}
  };
//+------------------------------------------------------------------+
Vamos modificar ligeiramente a classe- do objeto-gráfico localizado no arquivo \MQL5\Include\DoEasy\Objects\Chart\ChartObj.mqh.
Da lista de métodos privados para definir propriedades de objetos removemos a declaração do método SetVisible(), já que decidimos evitar a propriedade definida por este método, que não nos dá nenhuma carga útil:
//--- The methods of setting property values
   bool              SetMode(const string source,const ENUM_CHART_MODE mode,const bool redraw=false);
   bool              SetScale(const string source,const int scale,const bool redraw=false);
   bool              SetModeVolume(const string source,const ENUM_CHART_VOLUME_MODE mode,const bool redraw=false);
   void              SetVisibleBars(void);
   void              SetWindowsTotal(void);
   void              SetVisible(void);
   void              SetFirstVisibleBars(void);
   void              SetWidthInBars(void);
   void              SetWidthInPixels(void);
   void              SetMaximizedFlag(void);
   void              SetMinimizedFlag(void);
   void              SetExpertName(void);
   void              SetScriptName(void);
Fora do corpo da classe, encontramos sua implementação e também a removemos:
//+--------------------------------------------------------------------+
//|  Set the property                                                  |
//| "The total number of chart windows including indicator subwindows" |
//+--------------------------------------------------------------------+
void CChartObj::SetWindowsTotal(void)
  {
   this.SetProperty(CHART_PROP_WINDOWS_TOTAL,::ChartGetInteger(this.ID(),CHART_WINDOWS_TOTAL));
  }
//+------------------------------------------------------------------+
//| Set the "Subwindow visibility" property                          |
//+------------------------------------------------------------------+
void CChartObj::SetVisible(void)
  {
   this.SetProperty(CHART_PROP_WINDOW_IS_VISIBLE,::ChartGetInteger(this.ID(),CHART_WINDOW_IS_VISIBLE,0));
  }
//+----------------------------------------------------------------------+
//| Set the property "The number of the first visible bar on the chart"  |
//+----------------------------------------------------------------------+
void CChartObj::SetFirstVisibleBars(void)
  {
   this.SetProperty(CHART_PROP_FIRST_VISIBLE_BAR,::ChartGetInteger(this.ID(),CHART_FIRST_VISIBLE_BAR));
  }
//+------------------------------------------------------------------+
O método simplesmente definia a propriedade de visibilidade da janela principal do gráfico para a propriedade inteira já removida acima. Não a usaremos, portanto, nos livraremos de todos os métodos associados a ela. Em qualquer caso, ainda podemos obter o valor desta propriedade da janela diretamente do ambiente, e não das propriedades do objeto-janela do gráfico.
Na seção privada da classe declaramos um método para criar uma lista de janelas anexadas ao gráfico:
//--- The methods of setting property values
   bool              SetMode(const string source,const ENUM_CHART_MODE mode,const bool redraw=false);
   bool              SetScale(const string source,const int scale,const bool redraw=false);
   bool              SetModeVolume(const string source,const ENUM_CHART_VOLUME_MODE mode,const bool redraw=false);
   void              SetVisibleBars(void);
   void              SetWindowsTotal(void);
   void              SetFirstVisibleBars(void);
   void              SetWidthInBars(void);
   void              SetWidthInPixels(void);
   void              SetMaximizedFlag(void);
   void              SetMinimizedFlag(void);
   void              SetExpertName(void);
   void              SetScriptName(void);

//--- Create the list of chart windows
   void              CreateWindowsList(void);

public:
Na seção pública da classe declaramos um método para atualizar as propriedades do objeto-gráfico e suas subjanelas:
//--- Update the chart object and its list of indicator windows
   void              Refresh(void);

//--- Constructors
                     CChartObj(){;}
                     CChartObj(const long chart_id);
Ao organizar o trabalho com o método que retorna o número total de janelas do gráfico, descobri que, após uma solicitação desses dados, sempre temos que configurá-los nas propriedades do objeto. Por isso, decidi combinar no método a solicitação desses dados e seu registro na propriedade do objeto.
No método WindowsTotal() inserimos a consulta e a definição da propriedade de número de janelas realizadas no método SetWindowsTotal() e, em seguida, o incluímos o retorno do valor recém-recebido e armazenado nas propriedades do objeto. Removeremos a implementação do método Visible():
//--- Return the number of bars on a chart that are available for display
   int               VisibleBars(void)                               const { return (int)this.GetProperty(CHART_PROP_VISIBLE_BARS);       }

//--- Return the total number of chart windows including indicator subwindows
   int               WindowsTotal(void)
                       {
                        this.SetWindowsTotal();
                        return (int)this.GetProperty(CHART_PROP_WINDOWS_TOTAL);
                       }

//--- Return the window visibility
   bool              Visible(void)                                   const { return (bool)this.GetProperty(CHART_PROP_WINDOW_IS_VISIBLE); }
Vamos adicionar mais um método que retorna um sinalizador que indica a prevalência de dado objeto-gráfico - o gráfico ao qual está anexado o programa criado com base na biblioteca:
//--- Emulate a tick (chart updates - similar to the terminal Refresh command)
   void              EmulateTick(void)                                     { ::ChartSetSymbolPeriod(this.ID(),this.Symbol(),this.Timeframe());}

//--- Return the flag indicating that the chart object belongs to the program chart
   bool              IsMainChart(void)                               const { return(this.m_chart_id==CBaseObj::GetMainChartID());            }
//--- Return the chart window specified by index
   CChartWnd        *GetWindowByIndex(const int index)               const { return this.m_list_wnd.At(index);                               }
No objeto base de todos os objetos da biblioteca CBaseObj há uma variável m_chart_id_main que armazena o identificador do gráfico no qual o programa está sendo executado. Em seu construtor, esta variável é definida como o valor retornado pela função ChartID(), e o valor do identificador do gráfico atual é retornado pelo método GetMainChartID() da classe CBaseObj, que retorna o valor escrito na variável m_chart_id_main. Assim, devolvemos o sinalizador que indica que o identificador do gráfico atual corresponde ao identificador da janela principal do programa. Se os identificadores corresponderem, o método retornará true, caso contrário, false.
Do um construtor paramétrico excluímos a linha na qual é definido o valor de visibilidade da janela do gráfico atual:
//+------------------------------------------------------------------+
//| Parametric constructor                                           |
//+------------------------------------------------------------------+
CChartObj::CChartObj(const long chart_id)
  {
//--- Set chart ID to the base object
   CBaseObj::SetChartID(chart_id);
//--- Set integer properties
   this.SetProperty(CHART_PROP_ID,chart_id);                                                             // Chart ID
   this.SetProperty(CHART_PROP_TIMEFRAME,::ChartPeriod(this.ID()));                                      // Chart timeframe
   this.SetProperty(CHART_PROP_SHOW,::ChartGetInteger(this.ID(),CHART_SHOW));                            // Price chart drawing attribute
   this.SetProperty(CHART_PROP_IS_OBJECT,::ChartGetInteger(this.ID(),CHART_IS_OBJECT));                  // Chart object identification attribute
   this.SetProperty(CHART_PROP_BRING_TO_TOP,false);                                                      // Show chart above all others
   this.SetProperty(CHART_PROP_CONTEXT_MENU,::ChartGetInteger(this.ID(),CHART_CONTEXT_MENU));            // Access to the context menu using the right click
   this.SetProperty(CHART_PROP_CROSSHAIR_TOOL,::ChartGetInteger(this.ID(),CHART_CROSSHAIR_TOOL));        // Access the Crosshair tool by pressing the middle mouse button
   this.SetProperty(CHART_PROP_MOUSE_SCROLL,::ChartGetInteger(this.ID(),CHART_MOUSE_SCROLL));            // Scroll the chart horizontally using the left mouse button
   this.SetProperty(CHART_PROP_EVENT_MOUSE_WHEEL,::ChartGetInteger(this.ID(),CHART_EVENT_MOUSE_WHEEL));  // Send messages about mouse wheel events to all MQL5 programs on a chart
   this.SetProperty(CHART_PROP_EVENT_MOUSE_MOVE,::ChartGetInteger(this.ID(),CHART_EVENT_MOUSE_MOVE));    // Send messages about mouse button click and movement events to all MQL5 programs on a chart
   this.SetProperty(CHART_PROP_EVENT_OBJECT_CREATE,::ChartGetInteger(this.ID(),CHART_EVENT_OBJECT_CREATE)); // Send messages about the graphical object creation event to all MQL5 programs on a chart
   this.SetProperty(CHART_PROP_EVENT_OBJECT_DELETE,::ChartGetInteger(this.ID(),CHART_EVENT_OBJECT_DELETE)); // Send messages about the graphical object destruction event to all MQL5 programs on a chart
   this.SetProperty(CHART_PROP_MODE,::ChartGetInteger(this.ID(),CHART_MODE));                            // Type of the chart (candlesticks, bars or line)
   this.SetProperty(CHART_PROP_FOREGROUND,::ChartGetInteger(this.ID(),CHART_FOREGROUND));                // Price chart in the foreground
   this.SetProperty(CHART_PROP_SHIFT,::ChartGetInteger(this.ID(),CHART_SHIFT));                          // Mode of shift of the price chart from the right border
   this.SetProperty(CHART_PROP_AUTOSCROLL,::ChartGetInteger(this.ID(),CHART_AUTOSCROLL));                // The mode of automatic shift to the right border of the chart
   this.SetProperty(CHART_PROP_KEYBOARD_CONTROL,::ChartGetInteger(this.ID(),CHART_KEYBOARD_CONTROL));    // Allow managing the chart using a keyboard
   this.SetProperty(CHART_PROP_QUICK_NAVIGATION,::ChartGetInteger(this.ID(),CHART_QUICK_NAVIGATION));    // Allow the chart to intercept Space and Enter key strokes to activate the quick navigation bar
   this.SetProperty(CHART_PROP_SCALE,::ChartGetInteger(this.ID(),CHART_SCALE));                          // Scale
   this.SetProperty(CHART_PROP_SCALEFIX,::ChartGetInteger(this.ID(),CHART_SCALEFIX));                    // Fixed scale mode
   this.SetProperty(CHART_PROP_SCALEFIX_11,::ChartGetInteger(this.ID(),CHART_SCALEFIX_11));              // 1:1 scale mode
   this.SetProperty(CHART_PROP_SCALE_PT_PER_BAR,::ChartGetInteger(this.ID(),CHART_SCALE_PT_PER_BAR));    // Mode for specifying the scale in points per bar
   this.SetProperty(CHART_PROP_SHOW_TICKER,::ChartGetInteger(this.ID(),CHART_SHOW_TICKER));              // Display a symbol ticker in the upper left corner
   this.SetProperty(CHART_PROP_SHOW_OHLC,::ChartGetInteger(this.ID(),CHART_SHOW_OHLC));                  // Display OHLC values in the upper left corner
   this.SetProperty(CHART_PROP_SHOW_BID_LINE,::ChartGetInteger(this.ID(),CHART_SHOW_BID_LINE));          // Display Bid value as a horizontal line on the chart
   this.SetProperty(CHART_PROP_SHOW_ASK_LINE,::ChartGetInteger(this.ID(),CHART_SHOW_ASK_LINE));          // Display Ask value as a horizontal line on the chart
   this.SetProperty(CHART_PROP_SHOW_LAST_LINE,::ChartGetInteger(this.ID(),CHART_SHOW_LAST_LINE));        // Display Last value as a horizontal line on the chart
   this.SetProperty(CHART_PROP_SHOW_PERIOD_SEP,::ChartGetInteger(this.ID(),CHART_SHOW_PERIOD_SEP));      // Display vertical separators between adjacent periods
   this.SetProperty(CHART_PROP_SHOW_GRID,::ChartGetInteger(this.ID(),CHART_SHOW_GRID));                  // Display the chart grid
   this.SetProperty(CHART_PROP_SHOW_VOLUMES,::ChartGetInteger(this.ID(),CHART_SHOW_VOLUMES));            // Display volumes on the chart
   this.SetProperty(CHART_PROP_SHOW_OBJECT_DESCR,::ChartGetInteger(this.ID(),CHART_SHOW_OBJECT_DESCR));  // Display text descriptions of the objects
   this.SetProperty(CHART_PROP_VISIBLE_BARS,::ChartGetInteger(this.ID(),CHART_VISIBLE_BARS));            // Number of bars on a chart that are available for display
   this.SetProperty(CHART_PROP_WINDOWS_TOTAL,::ChartGetInteger(this.ID(),CHART_WINDOWS_TOTAL));          // The total number of chart windows including indicator subwindows
   this.SetProperty(CHART_PROP_WINDOW_IS_VISIBLE,::ChartGetInteger(this.ID(),CHART_WINDOW_IS_VISIBLE,0));// Window visibility
   this.SetProperty(CHART_PROP_WINDOW_HANDLE,::ChartGetInteger(this.ID(),CHART_WINDOW_HANDLE));          // Chart window handle
   this.SetProperty(CHART_PROP_WINDOW_YDISTANCE,::ChartGetInteger(this.ID(),CHART_WINDOW_YDISTANCE,0));  // Distance in Y axis pixels between the upper frame of the indicator subwindow and the upper frame of the chart main window
   this.SetProperty(CHART_PROP_FIRST_VISIBLE_BAR,::ChartGetInteger(this.ID(),CHART_FIRST_VISIBLE_BAR));  // Number of the first visible bar on the chart
   this.SetProperty(CHART_PROP_WIDTH_IN_BARS,::ChartGetInteger(this.ID(),CHART_WIDTH_IN_BARS));          // Chart width in bars
   this.SetProperty(CHART_PROP_WIDTH_IN_PIXELS,::ChartGetInteger(this.ID(),CHART_WIDTH_IN_PIXELS));      // Chart width in pixels
   this.SetProperty(CHART_PROP_HEIGHT_IN_PIXELS,::ChartGetInteger(this.ID(),CHART_HEIGHT_IN_PIXELS,0));  // Chart height in pixels
   this.SetProperty(CHART_PROP_COLOR_BACKGROUND,::ChartGetInteger(this.ID(),CHART_COLOR_BACKGROUND));    // Chart background color
   this.SetProperty(CHART_PROP_COLOR_FOREGROUND,::ChartGetInteger(this.ID(),CHART_COLOR_FOREGROUND));    // Color of axes, scale and OHLC line
   this.SetProperty(CHART_PROP_COLOR_GRID,::ChartGetInteger(this.ID(),CHART_COLOR_GRID));                // Grid color
   this.SetProperty(CHART_PROP_COLOR_VOLUME,::ChartGetInteger(this.ID(),CHART_COLOR_VOLUME));            // Color of volumes and position opening levels
   this.SetProperty(CHART_PROP_COLOR_CHART_UP,::ChartGetInteger(this.ID(),CHART_COLOR_CHART_UP));        // Color for the up bar, shadows and body borders of bullish candlesticks
   this.SetProperty(CHART_PROP_COLOR_CHART_DOWN,::ChartGetInteger(this.ID(),CHART_COLOR_CHART_DOWN));    // Color for the down bar, shadows and body borders of bearish candlesticks
   this.SetProperty(CHART_PROP_COLOR_CHART_LINE,::ChartGetInteger(this.ID(),CHART_COLOR_CHART_LINE));    // Color of the chart line and the Doji candlesticks
   this.SetProperty(CHART_PROP_COLOR_CANDLE_BULL,::ChartGetInteger(this.ID(),CHART_COLOR_CANDLE_BULL));  // Color of the bullish candle body
   this.SetProperty(CHART_PROP_COLOR_CANDLE_BEAR,::ChartGetInteger(this.ID(),CHART_COLOR_CANDLE_BEAR));  // Color of the bearish candle body
   this.SetProperty(CHART_PROP_COLOR_BID,::ChartGetInteger(this.ID(),CHART_COLOR_BID));                  // Bid price line color
   this.SetProperty(CHART_PROP_COLOR_ASK,::ChartGetInteger(this.ID(),CHART_COLOR_ASK));                  // Ask price line color
   this.SetProperty(CHART_PROP_COLOR_LAST,::ChartGetInteger(this.ID(),CHART_COLOR_LAST));                // Color of the last performed deal's price line (Last)
   this.SetProperty(CHART_PROP_COLOR_STOP_LEVEL,::ChartGetInteger(this.ID(),CHART_COLOR_STOP_LEVEL));    // Color of stop order levels (Stop Loss and Take Profit)
   this.SetProperty(CHART_PROP_SHOW_TRADE_LEVELS,::ChartGetInteger(this.ID(),CHART_SHOW_TRADE_LEVELS));  // Display trade levels on the chart (levels of open positions, Stop Loss, Take Profit and pending orders)
   this.SetProperty(CHART_PROP_DRAG_TRADE_LEVELS,::ChartGetInteger(this.ID(),CHART_DRAG_TRADE_LEVELS));  // Enable the ability to drag trading levels on a chart using mouse
   this.SetProperty(CHART_PROP_SHOW_DATE_SCALE,::ChartGetInteger(this.ID(),CHART_SHOW_DATE_SCALE));      // Display the time scale on the chart
   this.SetProperty(CHART_PROP_SHOW_PRICE_SCALE,::ChartGetInteger(this.ID(),CHART_SHOW_PRICE_SCALE));    // Display the price scale on the chart
   this.SetProperty(CHART_PROP_SHOW_ONE_CLICK,::ChartGetInteger(this.ID(),CHART_SHOW_ONE_CLICK));        // Display the quick trading panel on the chart
   this.SetProperty(CHART_PROP_IS_MAXIMIZED,::ChartGetInteger(this.ID(),CHART_IS_MAXIMIZED));            // Chart window maximized
   this.SetProperty(CHART_PROP_IS_MINIMIZED,::ChartGetInteger(this.ID(),CHART_IS_MINIMIZED));            // Chart window minimized
   this.SetProperty(CHART_PROP_IS_DOCKED,::ChartGetInteger(this.ID(),CHART_IS_DOCKED));                  // Chart window docked
   this.SetProperty(CHART_PROP_FLOAT_LEFT,::ChartGetInteger(this.ID(),CHART_FLOAT_LEFT));                // Left coordinate of the undocked chart window relative to the virtual screen
   this.SetProperty(CHART_PROP_FLOAT_TOP,::ChartGetInteger(this.ID(),CHART_FLOAT_TOP));                  // Upper coordinate of the undocked chart window relative to the virtual screen
   this.SetProperty(CHART_PROP_FLOAT_RIGHT,::ChartGetInteger(this.ID(),CHART_FLOAT_RIGHT));              // Right coordinate of the undocked chart window relative to the virtual screen
   this.SetProperty(CHART_PROP_FLOAT_BOTTOM,::ChartGetInteger(this.ID(),CHART_FLOAT_BOTTOM));            // Bottom coordinate of the undocked chart window relative to the virtual screen
//--- Set real properties
   this.SetProperty(CHART_PROP_SHIFT_SIZE,::ChartGetDouble(this.ID(),CHART_SHIFT_SIZE));                 // Shift size of the zero bar from the right border in %
   this.SetProperty(CHART_PROP_FIXED_POSITION,::ChartGetDouble(this.ID(),CHART_FIXED_POSITION));         // Chart fixed position from the left border in %
   this.SetProperty(CHART_PROP_FIXED_MAX,::ChartGetDouble(this.ID(),CHART_FIXED_MAX));                   // Fixed chart maximum
   this.SetProperty(CHART_PROP_FIXED_MIN,::ChartGetDouble(this.ID(),CHART_FIXED_MIN));                   // Fixed chart minimum
   this.SetProperty(CHART_PROP_POINTS_PER_BAR,::ChartGetDouble(this.ID(),CHART_POINTS_PER_BAR));         // Scale in points per bar
   this.SetProperty(CHART_PROP_PRICE_MIN,::ChartGetDouble(this.ID(),CHART_PRICE_MIN));                   // Chart minimum
   this.SetProperty(CHART_PROP_PRICE_MAX,::ChartGetDouble(this.ID(),CHART_PRICE_MAX));                   // Chart maximum
//--- Set string properties
   this.SetProperty(CHART_PROP_COMMENT,::ChartGetString(this.ID(),CHART_COMMENT));                       // Comment text on the chart
   this.SetProperty(CHART_PROP_EXPERT_NAME,::ChartGetString(this.ID(),CHART_EXPERT_NAME));               // name of an EA launched on the chart
   this.SetProperty(CHART_PROP_SCRIPT_NAME,::ChartGetString(this.ID(),CHART_SCRIPT_NAME));               // name of a script launched on the chart
   this.SetProperty(CHART_PROP_SYMBOL,::ChartSymbol(this.ID()));                                         // Chart symbol

   this.m_digits=(int)::SymbolInfoInteger(this.Symbol(),SYMBOL_DIGITS);
Mas em vez de um loop para criar objetos-janelas que pertencem a este gráfico
   this.m_digits=(int)::SymbolInfoInteger(this.Symbol(),SYMBOL_DIGITS);
   int total=this.WindowsTotal();
   for(int i=0;i<total;i++)
     {
      CChartWnd *wnd=new CChartWnd(m_chart_id,i);
      if(wnd==NULL)
         continue;
      m_list_wnd.Sort();
      if(!m_list_wnd.Add(wnd))
         delete wnd;
     }
escrevemos uma chamada de método que crie uma lista de janelas que pertencem a este gráfico:
   this.m_digits=(int)::SymbolInfoInteger(this.Symbol(),SYMBOL_DIGITS);
   this.CreateWindowsList();
Como resultado, o construtor paramétrico ficará assim:
//+------------------------------------------------------------------+
//| Parametric constructor                                           |
//+------------------------------------------------------------------+
CChartObj::CChartObj(const long chart_id)
  {
//--- Set chart ID to the base object
   CBaseObj::SetChartID(chart_id);
//--- Set integer properties
   this.SetProperty(CHART_PROP_ID,chart_id);                                                             // Chart ID
   this.SetProperty(CHART_PROP_TIMEFRAME,::ChartPeriod(this.ID()));                                      // Chart timeframe
   this.SetProperty(CHART_PROP_SHOW,::ChartGetInteger(this.ID(),CHART_SHOW));                            // Price chart drawing attribute
   this.SetProperty(CHART_PROP_IS_OBJECT,::ChartGetInteger(this.ID(),CHART_IS_OBJECT));                  // Chart object identification attribute
   this.SetProperty(CHART_PROP_BRING_TO_TOP,false);                                                      // Show chart above all others
   this.SetProperty(CHART_PROP_CONTEXT_MENU,::ChartGetInteger(this.ID(),CHART_CONTEXT_MENU));            // Access to the context menu using the right click
   this.SetProperty(CHART_PROP_CROSSHAIR_TOOL,::ChartGetInteger(this.ID(),CHART_CROSSHAIR_TOOL));        // Access the Crosshair tool by pressing the middle mouse button
   this.SetProperty(CHART_PROP_MOUSE_SCROLL,::ChartGetInteger(this.ID(),CHART_MOUSE_SCROLL));            // Scroll the chart horizontally using the left mouse button
   this.SetProperty(CHART_PROP_EVENT_MOUSE_WHEEL,::ChartGetInteger(this.ID(),CHART_EVENT_MOUSE_WHEEL));  // Send messages about mouse wheel events to all MQL5 programs on a chart
   this.SetProperty(CHART_PROP_EVENT_MOUSE_MOVE,::ChartGetInteger(this.ID(),CHART_EVENT_MOUSE_MOVE));    // Send messages about mouse button click and movement events to all MQL5 programs on a chart
   this.SetProperty(CHART_PROP_EVENT_OBJECT_CREATE,::ChartGetInteger(this.ID(),CHART_EVENT_OBJECT_CREATE)); // Send messages about the graphical object creation event to all MQL5 programs on a chart
   this.SetProperty(CHART_PROP_EVENT_OBJECT_DELETE,::ChartGetInteger(this.ID(),CHART_EVENT_OBJECT_DELETE)); // Send messages about the graphical object destruction event to all MQL5 programs on a chart
   this.SetProperty(CHART_PROP_MODE,::ChartGetInteger(this.ID(),CHART_MODE));                            // Type of the chart (candlesticks, bars or line)
   this.SetProperty(CHART_PROP_FOREGROUND,::ChartGetInteger(this.ID(),CHART_FOREGROUND));                // Price chart in the foreground
   this.SetProperty(CHART_PROP_SHIFT,::ChartGetInteger(this.ID(),CHART_SHIFT));                          // Mode of shift of the price chart from the right border
   this.SetProperty(CHART_PROP_AUTOSCROLL,::ChartGetInteger(this.ID(),CHART_AUTOSCROLL));                // The mode of automatic shift to the right border of the chart
   this.SetProperty(CHART_PROP_KEYBOARD_CONTROL,::ChartGetInteger(this.ID(),CHART_KEYBOARD_CONTROL));    // Allow managing the chart using a keyboard
   this.SetProperty(CHART_PROP_QUICK_NAVIGATION,::ChartGetInteger(this.ID(),CHART_QUICK_NAVIGATION));    // Allow the chart to intercept Space and Enter key strokes to activate the quick navigation bar
   this.SetProperty(CHART_PROP_SCALE,::ChartGetInteger(this.ID(),CHART_SCALE));                          // Scale
   this.SetProperty(CHART_PROP_SCALEFIX,::ChartGetInteger(this.ID(),CHART_SCALEFIX));                    // Fixed scale mode
   this.SetProperty(CHART_PROP_SCALEFIX_11,::ChartGetInteger(this.ID(),CHART_SCALEFIX_11));              // 1:1 scale mode
   this.SetProperty(CHART_PROP_SCALE_PT_PER_BAR,::ChartGetInteger(this.ID(),CHART_SCALE_PT_PER_BAR));    // Mode for specifying the scale in points per bar
   this.SetProperty(CHART_PROP_SHOW_TICKER,::ChartGetInteger(this.ID(),CHART_SHOW_TICKER));              // Display a symbol ticker in the upper left corner
   this.SetProperty(CHART_PROP_SHOW_OHLC,::ChartGetInteger(this.ID(),CHART_SHOW_OHLC));                  // Display OHLC values in the upper left corner
   this.SetProperty(CHART_PROP_SHOW_BID_LINE,::ChartGetInteger(this.ID(),CHART_SHOW_BID_LINE));          // Display Bid value as a horizontal line on the chart
   this.SetProperty(CHART_PROP_SHOW_ASK_LINE,::ChartGetInteger(this.ID(),CHART_SHOW_ASK_LINE));          // Display Ask value as a horizontal line on the chart
   this.SetProperty(CHART_PROP_SHOW_LAST_LINE,::ChartGetInteger(this.ID(),CHART_SHOW_LAST_LINE));        // Display Last value as a horizontal line on the chart
   this.SetProperty(CHART_PROP_SHOW_PERIOD_SEP,::ChartGetInteger(this.ID(),CHART_SHOW_PERIOD_SEP));      // Display vertical separators between adjacent periods
   this.SetProperty(CHART_PROP_SHOW_GRID,::ChartGetInteger(this.ID(),CHART_SHOW_GRID));                  // Display the chart grid
   this.SetProperty(CHART_PROP_SHOW_VOLUMES,::ChartGetInteger(this.ID(),CHART_SHOW_VOLUMES));            // Display volumes on the chart
   this.SetProperty(CHART_PROP_SHOW_OBJECT_DESCR,::ChartGetInteger(this.ID(),CHART_SHOW_OBJECT_DESCR));  // Display text descriptions of the objects
   this.SetProperty(CHART_PROP_VISIBLE_BARS,::ChartGetInteger(this.ID(),CHART_VISIBLE_BARS));            // Number of bars on a chart that are available for display
   this.SetProperty(CHART_PROP_WINDOWS_TOTAL,::ChartGetInteger(this.ID(),CHART_WINDOWS_TOTAL));          // The total number of chart windows including indicator subwindows
   this.SetProperty(CHART_PROP_WINDOW_HANDLE,::ChartGetInteger(this.ID(),CHART_WINDOW_HANDLE));          // Chart window handle
   this.SetProperty(CHART_PROP_WINDOW_YDISTANCE,::ChartGetInteger(this.ID(),CHART_WINDOW_YDISTANCE,0));  // Distance in Y axis pixels between the upper frame of the indicator subwindow and the upper frame of the chart main window
   this.SetProperty(CHART_PROP_FIRST_VISIBLE_BAR,::ChartGetInteger(this.ID(),CHART_FIRST_VISIBLE_BAR));  // Number of the first visible bar on the chart
   this.SetProperty(CHART_PROP_WIDTH_IN_BARS,::ChartGetInteger(this.ID(),CHART_WIDTH_IN_BARS));          // Chart width in bars
   this.SetProperty(CHART_PROP_WIDTH_IN_PIXELS,::ChartGetInteger(this.ID(),CHART_WIDTH_IN_PIXELS));      // Chart width in pixels
   this.SetProperty(CHART_PROP_HEIGHT_IN_PIXELS,::ChartGetInteger(this.ID(),CHART_HEIGHT_IN_PIXELS,0));  // Chart height in pixels
   this.SetProperty(CHART_PROP_COLOR_BACKGROUND,::ChartGetInteger(this.ID(),CHART_COLOR_BACKGROUND));    // Chart background color
   this.SetProperty(CHART_PROP_COLOR_FOREGROUND,::ChartGetInteger(this.ID(),CHART_COLOR_FOREGROUND));    // Color of axes, scale and OHLC line
   this.SetProperty(CHART_PROP_COLOR_GRID,::ChartGetInteger(this.ID(),CHART_COLOR_GRID));                // Grid color
   this.SetProperty(CHART_PROP_COLOR_VOLUME,::ChartGetInteger(this.ID(),CHART_COLOR_VOLUME));            // Color of volumes and position opening levels
   this.SetProperty(CHART_PROP_COLOR_CHART_UP,::ChartGetInteger(this.ID(),CHART_COLOR_CHART_UP));        // Color for the up bar, shadows and body borders of bullish candlesticks
   this.SetProperty(CHART_PROP_COLOR_CHART_DOWN,::ChartGetInteger(this.ID(),CHART_COLOR_CHART_DOWN));    // Color for the down bar, shadows and body borders of bearish candlesticks
   this.SetProperty(CHART_PROP_COLOR_CHART_LINE,::ChartGetInteger(this.ID(),CHART_COLOR_CHART_LINE));    // Color of the chart line and the Doji candlesticks
   this.SetProperty(CHART_PROP_COLOR_CANDLE_BULL,::ChartGetInteger(this.ID(),CHART_COLOR_CANDLE_BULL));  // Color of the bullish candle body
   this.SetProperty(CHART_PROP_COLOR_CANDLE_BEAR,::ChartGetInteger(this.ID(),CHART_COLOR_CANDLE_BEAR));  // Color of the bearish candle body
   this.SetProperty(CHART_PROP_COLOR_BID,::ChartGetInteger(this.ID(),CHART_COLOR_BID));                  // Bid price line color
   this.SetProperty(CHART_PROP_COLOR_ASK,::ChartGetInteger(this.ID(),CHART_COLOR_ASK));                  // Ask price line color
   this.SetProperty(CHART_PROP_COLOR_LAST,::ChartGetInteger(this.ID(),CHART_COLOR_LAST));                // Color of the last performed deal's price line (Last)
   this.SetProperty(CHART_PROP_COLOR_STOP_LEVEL,::ChartGetInteger(this.ID(),CHART_COLOR_STOP_LEVEL));    // Color of stop order levels (Stop Loss and Take Profit)
   this.SetProperty(CHART_PROP_SHOW_TRADE_LEVELS,::ChartGetInteger(this.ID(),CHART_SHOW_TRADE_LEVELS));  // Display trade levels on the chart (levels of open positions, Stop Loss, Take Profit and pending orders)
   this.SetProperty(CHART_PROP_DRAG_TRADE_LEVELS,::ChartGetInteger(this.ID(),CHART_DRAG_TRADE_LEVELS));  // Enable the ability to drag trading levels on a chart using mouse
   this.SetProperty(CHART_PROP_SHOW_DATE_SCALE,::ChartGetInteger(this.ID(),CHART_SHOW_DATE_SCALE));      // Display the time scale on the chart
   this.SetProperty(CHART_PROP_SHOW_PRICE_SCALE,::ChartGetInteger(this.ID(),CHART_SHOW_PRICE_SCALE));    // Display the price scale on the chart
   this.SetProperty(CHART_PROP_SHOW_ONE_CLICK,::ChartGetInteger(this.ID(),CHART_SHOW_ONE_CLICK));        // Display the quick trading panel on the chart
   this.SetProperty(CHART_PROP_IS_MAXIMIZED,::ChartGetInteger(this.ID(),CHART_IS_MAXIMIZED));            // Chart window maximized
   this.SetProperty(CHART_PROP_IS_MINIMIZED,::ChartGetInteger(this.ID(),CHART_IS_MINIMIZED));            // Chart window minimized
   this.SetProperty(CHART_PROP_IS_DOCKED,::ChartGetInteger(this.ID(),CHART_IS_DOCKED));                  // Chart window docked
   this.SetProperty(CHART_PROP_FLOAT_LEFT,::ChartGetInteger(this.ID(),CHART_FLOAT_LEFT));                // Left coordinate of the undocked chart window relative to the virtual screen
   this.SetProperty(CHART_PROP_FLOAT_TOP,::ChartGetInteger(this.ID(),CHART_FLOAT_TOP));                  // Upper coordinate of the undocked chart window relative to the virtual screen
   this.SetProperty(CHART_PROP_FLOAT_RIGHT,::ChartGetInteger(this.ID(),CHART_FLOAT_RIGHT));              // Right coordinate of the undocked chart window relative to the virtual screen
   this.SetProperty(CHART_PROP_FLOAT_BOTTOM,::ChartGetInteger(this.ID(),CHART_FLOAT_BOTTOM));            // Bottom coordinate of the undocked chart window relative to the virtual screen
//--- Set real properties
   this.SetProperty(CHART_PROP_SHIFT_SIZE,::ChartGetDouble(this.ID(),CHART_SHIFT_SIZE));                 // Shift size of the zero bar from the right border in %
   this.SetProperty(CHART_PROP_FIXED_POSITION,::ChartGetDouble(this.ID(),CHART_FIXED_POSITION));         // Chart fixed position from the left border in %
   this.SetProperty(CHART_PROP_FIXED_MAX,::ChartGetDouble(this.ID(),CHART_FIXED_MAX));                   // Fixed chart maximum
   this.SetProperty(CHART_PROP_FIXED_MIN,::ChartGetDouble(this.ID(),CHART_FIXED_MIN));                   // Fixed chart minimum
   this.SetProperty(CHART_PROP_POINTS_PER_BAR,::ChartGetDouble(this.ID(),CHART_POINTS_PER_BAR));         // Scale in points per bar
   this.SetProperty(CHART_PROP_PRICE_MIN,::ChartGetDouble(this.ID(),CHART_PRICE_MIN));                   // Chart minimum
   this.SetProperty(CHART_PROP_PRICE_MAX,::ChartGetDouble(this.ID(),CHART_PRICE_MAX));                   // Chart maximum
//--- Set string properties
   this.SetProperty(CHART_PROP_COMMENT,::ChartGetString(this.ID(),CHART_COMMENT));                       // Comment text on the chart
   this.SetProperty(CHART_PROP_EXPERT_NAME,::ChartGetString(this.ID(),CHART_EXPERT_NAME));               // name of an EA launched on the chart
   this.SetProperty(CHART_PROP_SCRIPT_NAME,::ChartGetString(this.ID(),CHART_SCRIPT_NAME));               // name of a script launched on the chart
   this.SetProperty(CHART_PROP_SYMBOL,::ChartSymbol(this.ID()));                                         // Chart symbol

   this.m_digits=(int)::SymbolInfoInteger(this.Symbol(),SYMBOL_DIGITS);
   this.CreateWindowsList();
  }
//+------------------------------------------------------------------+
Do método GetPropertyDescription() que retorna uma descrição da propriedade inteira de um objeto, removemos o bloco de código no qual é criada a descrição do parâmetro de visibilidade da janela - removemos esta propriedade do objeto:
      property==CHART_PROP_WINDOWS_TOTAL  ?  CMessage::Text(MSG_CHART_OBJ_WINDOWS_TOTAL)+
         (!this.SupportProperty(property) ?  ": "+CMessage::Text(MSG_LIB_PROP_NOT_SUPPORTED) :
          ": "+(string)this.GetProperty(property)
         )  :
      property==CHART_PROP_WINDOW_IS_VISIBLE  ?  CMessage::Text(MSG_CHART_OBJ_WINDOW_IS_VISIBLE)+
         (!this.SupportProperty(property) ?  ": "+CMessage::Text(MSG_LIB_PROP_NOT_SUPPORTED) :
          ": "+(this.GetProperty(property) ? CMessage::Text(MSG_LIB_TEXT_YES) : CMessage::Text(MSG_LIB_TEXT_NO))
         )  :
      property==CHART_PROP_WINDOW_HANDLE  ?  CMessage::Text(MSG_CHART_OBJ_WINDOW_HANDLE)+
         (!this.SupportProperty(property) ?  ": "+CMessage::Text(MSG_LIB_PROP_NOT_SUPPORTED) :
          ": "+(string)this.GetProperty(property)
         )  :
Nos métodos que imprimem no log os dados de todos os indicadores de todas as janelas do gráfico e as propriedades de todas as janelas do gráfico, substituímos o tamanho do loop pelo número de objetos-janelas do gráfico nas listas:
//+-------------------------------------------------------------------+
//| Display data of all indicators of all chart windows in the journal|
//+-------------------------------------------------------------------+
void CChartObj::PrintWndIndicators(void)
  {
   for(int i=0;i<this.m_list_wnd.Total();i++)
     {
      CChartWnd *wnd=m_list_wnd.At(i);
      if(wnd==NULL)
         continue;
      wnd.PrintIndicators(true);
     }
  }
//+------------------------------------------------------------------+
//| Display the properties of all chart windows in the journal       |
//+------------------------------------------------------------------+
void CChartObj::PrintWndParameters(void)
  {
   for(int i=0;i<this.m_list_wnd.Total();i++)
     {
      CChartWnd *wnd=m_list_wnd.At(i);
      if(wnd==NULL)
         continue;
      wnd.PrintParameters(true);
     }
  }
//+------------------------------------------------------------------+
Anteriormente, os loops eram contados até o valor retornado pelo método WindowsTotal(), o que não é totalmente correto - esse método retorna o valor real obtido do gráfico, enquanto as listas podem conter menos ou mais objetos do que realmente são. Isso acontece quando seu número muda no gráfico do terminal. Por isso, corrigimos o loop que percorria o número errado de objetos na lista.
Fora do corpo da classe vamos escrever a implementação do método que atualiza o objeto gráfico e a lista de janelas:
//+------------------------------------------------------------------+
//| Update the chart object and its window list                      |
//+------------------------------------------------------------------+
void CChartObj::Refresh(void)
  {
   int change=this.WindowsTotal()-this.m_list_wnd.Total();
   if(change==0)
      return;
   this.CreateWindowsList();
  }
//+------------------------------------------------------------------+
Aqui nós consideramos a diferença entre o número real de janelas do gráfico e o número de objetos-janelas na lista. Se a diferença for zero é porque não há mudanças, portanto deixamos o método, caso contrário, recriamos uma lista completa de todos os objetos-janelas do gráfico pertencentes a este objeto-gráfico. Recriar a lista é muito mais fácil do que procurar a diferença entre os objetos, procurar objetos da janela do gráfico ausentes e excluir os desnecessários ou adicionar novos à lista.
Vamos escrever a implementação do método que cria uma lista de objetos-janelas do gráfico pertencentes ao gráfico:
//+------------------------------------------------------------------+
//| Create the list of chart windows                                 |
//+------------------------------------------------------------------+
void CChartObj::CreateWindowsList(void)
  {
   this.m_list_wnd.Clear();
   int total=this.WindowsTotal();
   for(int i=0;i<total;i++)
     {
      CChartWnd *wnd=new CChartWnd(m_chart_id,i);
      if(wnd==NULL)
         continue;
      this.m_list_wnd.Sort();
      if(!m_list_wnd.Add(wnd))
         delete wnd;
     }
  }
//+------------------------------------------------------------------+
Aqui limpamos a lista de objetos-janelas, obtemos o número total de janelas do gráfico a partir de seus parâmetros no terminal e num loop percorrendo o número recebido de janelas criamos um novo objeto-janela e o adicionamos à lista. Se o objeto não puder ser adicionado à lista, vamos exclui-lo para evitar vazamentos de memória.
Assim fica concluída a modificação das classes da biblioteca.
Vamos começar a criar uma classe-coleção de objetos-gráficos.
Classe-coleção de objetos-gráficos
Da mesma forma que para o objeto-gráfico, onde verificamos a alteração no número de janelas do gráfico para ativar a sua atualização do número no objeto, na coleção de objetos-gráficos verificaremos a alteração no número de gráficos abertos para iniciar o processo de reconstrução da lista-coleção de objetos-gráficos.
Primeiro, verificaremos o número de janelas em objetos-gráficos já existentes, em seguida, verificaremos a mudança no número de gráficos abertos e, se a verificação der um resultado diferente de zero, começaremos a reconstruir a coleção de objetos-gráficos.
Na pasta da biblioteca \MQL5\Include\DoEasy\Collections\ChartObjCollection.mqh criamos a nova classe CChartObjCollection. A classe deve ser herdada da classe do objeto base de todos os objetos da biblioteca CBaseObj, mas o arquivo do objeto-gráfico deve ser anexado ao arquivo de classe-coleção de objetos-gráficos:
//+------------------------------------------------------------------+
//|                                           ChartObjCollection.mqh |
//|                                  Copyright 2021, MetaQuotes Ltd. |
//|                             https://mql5.com/en/users/artmedia70 |
//+------------------------------------------------------------------+
#property copyright "Copyright 2021, MetaQuotes Ltd."
#property link      "https://mql5.com/en/users/artmedia70"
#property version   "1.00"
//+------------------------------------------------------------------+
//| Include files                                                    |
//+------------------------------------------------------------------+
#include "ListObj.mqh"
#include "..\Services\Select.mqh"
#include "..\Objects\Chart\ChartObj.mqh"
//+------------------------------------------------------------------+
//| MQL5 signal object collection                                    |
//+------------------------------------------------------------------+
class CChartObjCollection : public CBaseObj
  {
  }
Na seção privada da classe declaramos a lista CListObj, que irá armazenar os objetos-gráficos, a variável para armazenar o valor anterior do número de gráficos abertos no terminal e os métodos auxiliares para organizar o trabalho da classe:
//+------------------------------------------------------------------+
//| MQL5 signal object collection                                    |
//+------------------------------------------------------------------+
class CChartObjCollection : public CBaseObj
  {
private:
   CListObj                m_list;                                   // List of chart objects
   int                     m_charts_total_prev;                      // Previous number of charts in the terminal
   //--- Return the number of charts in the terminal
   int                     ChartsTotal(void) const;
   //--- Return the flag indicating the existence of (1) a chart object and (2) a chart
   bool                    IsPresentChartObj(const long chart_id);
   bool                    IsPresentChart(const long chart_id);
   //--- Create a new chart object and add it to the list
   bool                    CreateNewChartObj(const long chart_id,const string source);
   //--- Find the missing chart object, create it and add it to the collection list
   bool                    FindAndCreateMissingChartObj(void);
   //--- Find a chart object not present in the terminal and remove it from the list
   void                    FindAndDeleteExcessChartObj(void);
public:
  }
Na seção pública da classe, colocaremos os métodos padrão para objetos de biblioteca:
public:
//--- Return (1) itself and (2) chart object collection list
   CChartObjCollection    *GetObject(void)                                 { return &this;                  }
   CArrayObj              *GetList(void)                                   { return &this.m_list;           }
   //--- Return the list by selected (1) integer, (2) real and (3) string properties meeting the compared criterion
   CArrayObj              *GetList(ENUM_CHART_PROP_INTEGER property,long value,ENUM_COMPARER_TYPE mode=EQUAL)  { return CSelect::ByChartProperty(this.GetList(),property,value,mode);  }
   CArrayObj              *GetList(ENUM_CHART_PROP_DOUBLE property,double value,ENUM_COMPARER_TYPE mode=EQUAL) { return CSelect::ByChartProperty(this.GetList(),property,value,mode);  }
   CArrayObj              *GetList(ENUM_CHART_PROP_STRING property,string value,ENUM_COMPARER_TYPE mode=EQUAL) { return CSelect::ByChartProperty(this.GetList(),property,value,mode);  }
//--- Return the number of chart objects in the list
   int                     DataTotal(void)                           const { return this.m_list.Total();    }
//--- Display (1) the complete and (2) short collection description in the journal
   void                    Print(void);
   void                    PrintShort(void);
//--- Constructor
                           CChartObjCollection();
e adicionamos métodos auxiliares:
//--- Return the pointer to the chart object (1) by ID and (2) by an index in the list
   CChartObj              *GetChart(const long id);
   CChartObj              *GetChart(const int index)                       { return this.m_list.At(index);  }
//--- Return the list of chart objects by (1) symbol and (2) timeframe
   CArrayObj              *GetChartsList(const string symbol)              { return this.GetList(CHART_PROP_SYMBOL,symbol,EQUAL);         }
   CArrayObj              *GetChartsList(const ENUM_TIMEFRAMES timeframe)  { return this.GetList(CHART_PROP_TIMEFRAME,timeframe,EQUAL);   }
//--- Return the chart ID with the program
   long                    GetMainChartID(void)                      const { return CBaseObj::GetMainChartID();   }
//--- Create the collection list of chart objects
   bool                    CreateCollection(void);
//--- Update (1) the chart object collection list and (2) the specified chart object
   void                    Refresh(void);
   void                    Refresh(const long chart_id);

  };
//+------------------------------------------------------------------+
Vejamos a implementação de alguns dos métodos de classe.
No construtor da classe limpamos a lista de objetos da coleção, definimos o sinalizador de lista classificada, atribuímos à lista o identificador da coleção de objetos-gráficos e salvamos o valor do número de gráficos atualmente abertos no terminal:
//+------------------------------------------------------------------+
//| Constructor                                                      |
//+------------------------------------------------------------------+
CChartObjCollection::CChartObjCollection()
  {
   this.m_list.Clear();
   this.m_list.Sort();
   this.m_list.Type(COLLECTION_CHARTS_ID);
   this.m_charts_total_prev=this.ChartsTotal();
  }
//+------------------------------------------------------------------+
Em MQL, não há função para retornar o número de gráficos abertos e não se pode criar um loop para percorrer a matriz pronta de gráficos abertos e obter cada gráfico pelo índice de loop. Mas há uma função que retorna o identificador do primeiro gráfico aberto ChartFirst() e uma função que retorna o identificador do próximo gráfico após o especificado ChartNext(). Assim, podemos criar um ciclo para todos os gráficos abertos, um por um obtendo cada gráfico com base no identificador do anterior. A ajuda para a função ChartNext() tem um exemplo de geração desse tipo de loop:
//--- variables for chart identifiers
   long currChart,prevChart=ChartFirst();
   int i=0,limit=100;
   Print("ChartFirst = ",ChartSymbol(prevChart)," ID = ",prevChart);
   while(i<limit)// we probably have no more than 100 open charts
     {
      currChart=ChartNext(prevChart); // get new chart on the basis of the previous one
      if(currChart<0) break;          // the end of chart list is reached
      Print(i,ChartSymbol(currChart)," ID =",currChart);
      prevChart=currChart;// memorize identifier of the current chart for ChartNext()
      i++;// do not forget to increase the counter
     }
É com base nesse loop que criaremos nossos métodos para trabalhar com gráficos abertos do terminal do cliente.
Método que cria uma lista-coleção de objetos-gráficos:
//+------------------------------------------------------------------+
//| Create the collection list of chart objects                      |
//+------------------------------------------------------------------+
bool CChartObjCollection::CreateCollection(void)
  {
   //--- Clear the list and set the flag of sorting by the chart ID
   m_list.Clear();
   m_list.Sort(SORT_BY_CHART_ID);
   //--- Declare the variables and get the first chart ID
   long curr_chart,prev_chart=::ChartFirst();
   int i=0;
   //--- Create the first chart object and add it to the list
   if(!this.CreateNewChartObj(prev_chart,DFUN))
      return false;
   //--- In the loop by the total number of terminal charts (not more than 100)
   while(i<CHARTS_MAX)
     {
      //--- based on the previous one, get the new chart
      curr_chart=::ChartNext(prev_chart);
      //--- When reaching the end of the chart list, complete the loop
      if(curr_chart<0) break;
      //--- Create the chart object based on the current chart ID in the loop and add it to the list
      if(!this.CreateNewChartObj(curr_chart,DFUN))
         return false;
      //--- remember the current chart ID for ChartNext() and increase the loop counter
      prev_chart=curr_chart;
      i++;
     }
   //--- Filled in the list successfully
   return true;
  }
//+------------------------------------------------------------------+
Aqui, toda a lógica do método é descrita nos comentários ao código. Em suma, primeiro limpamos a lista-coleção de objetos previamente adicionados, depois no loop acima obtemos cada gráfico aberto por seu identificador, criamos um novo objeto-gráfico e o adicionamos à lista-coleção.
Método que atualiza a lista-coleção de objetos-gráficos:
//+------------------------------------------------------------------+
//| Update the collection list of chart objects                      |
//+------------------------------------------------------------------+
void CChartObjCollection::Refresh(void)
  {
   //--- Get the number of open charts in the terminal and
   int charts_total=this.ChartsTotal();
   //--- calculate the difference between the number of open charts in the terminal
   //--- and chart objects in the collection list. These values are displayed in the chart comment
   int change=charts_total-this.m_list.Total();
   Comment(DFUN,", list total=",DataTotal(),", charts total=",charts_total,", change=",change);
   //--- If there are no changes, leave
   if(change==0)
      return;
   //--- If a chart is added in the terminal
   if(change>0)
     {
      //--- Find the missing chart object, create and add it to the collection list
      this.FindAndCreateMissingChartObj();
      //--- Get the current chart and return to it since
      //--- adding a new chart switches the focus to it
      CChartObj *chart=this.GetChart(GetMainChartID());
      if(chart!=NULL)
         chart.SetBringToTopON(true);
     }
   //--- If a chart is removed in the terminal
   else if(change<0)
    {
     //--- Find an extra chart object in the collection list and remove it from the list
     this.FindAndDeleteExcessChartObj();
    }
   //--- In the loop by the number of chart objects in the list,
   for(int i=0;i<this.m_list.Total();i++)
     {
      //--- get the next chart object and
      CChartObj *chart=this.m_list.At(i);
      if(chart==NULL)
         continue;
      //--- update it
      chart.Refresh();
     }
  }
//+------------------------------------------------------------------+
Toda a lógica do método é descrita nos comentários ao código. Resumindo: primeiro, verificamos a mudança no número de gráficos abertos no terminal do cliente. Se for adicionado um gráfico, chamamos o método FindAndCreateMissingChartObj() para pesquisar, criar e adicionar à lista-coleção o objeto-gráfico ausente. Depois disso, o foco muda para o gráfico atual com o programa (uma vez que a adição de um novo gráfico ao terminal muda o foco para ele). Se o gráfico for removido do terminal do cliente, chamamos o método no qual é procurado um objeto-gráfico extra e removido da lista. Finalmente, todos os objetos-gráficos são atualizados - o método Refresh() do objeto-gráfico verifica a alteração no número de janelas anexadas ao gráfico e altera seu número na lista de janelas se alguma alteração for encontrada.
Método que atualiza o objeto-gráfico especificado pelo identificador do gráfico:
//+------------------------------------------------------------------+
//| Update the specified chart object                                |
//+------------------------------------------------------------------+
void CChartObjCollection::Refresh(const long chart_id)
  {
   CChartObj *chart=this.GetChart(chart_id);
   if(chart==NULL)
      return;
   chart.Refresh();
  }
//+------------------------------------------------------------------+
Aqui: obtemos o objeto-gráfico da lista-coleção por identificador e o atualizamos.
O método que registra no log uma descrição completa da coleção:
//+------------------------------------------------------------------+
//| Display complete collection description to the journal           |
//+------------------------------------------------------------------+
void CChartObjCollection::Print(void)
  {
   //--- Display the header in the journal and print all chart objects in full
   ::Print(CMessage::Text(MSG_CHART_COLLECTION_TEXT_CHART_COLLECTION),":");
   for(int i=0;i<this.m_list.Total();i++)
     {
      CChartObj *chart=this.m_list.At(i);
      if(chart==NULL)
         continue;
      chart.Print();
     }
  }
//+------------------------------------------------------------------+
Aqui: primeiro imprimimos o título, em seguida, num loop percorrendo o número total de objetos na lista-coleção obtemos outro objeto-gráfico e imprimimos sua descrição completa.
O método que registra no log uma breve descrição da coleção:
//+------------------------------------------------------------------+
//| Display the short collection description in the journal          |
//+------------------------------------------------------------------+
void CChartObjCollection::PrintShort(void)
  {
   //--- Display the header in the journal and print short descriptions of chart objects
   ::Print(CMessage::Text(MSG_CHART_COLLECTION_TEXT_CHART_COLLECTION),":");
   for(int i=0;i<this.m_list.Total();i++)
     {
      CChartObj *chart=this.m_list.At(i);
      if(chart==NULL)
         continue;
      chart.PrintShort(true);
     }
  }
//+------------------------------------------------------------------+
A lógica do método é como a anterior, exceto que no log são exibidas descrições curtas dos objetos-gráficos.
Método que retorna o número de gráficos no terminal:
//+------------------------------------------------------------------+
//| Return the number of charts in the terminal                      |
//+------------------------------------------------------------------+
int CChartObjCollection::ChartsTotal(void) const
  {
   //--- Declare the variables and get the first chart ID
   long currChart,prevChart=::ChartFirst();
   int res=1; // We definitely have one chart - the current one
   //--- In the loop by the total number of terminal charts (not more than 100)
   while(res<CHARTS_MAX)
     {
      //--- based on the previous one, get the new chart
      currChart=::ChartNext(prevChart);
      //--- When reaching the end of the chart list, complete the loop
      if(currChart<0) break;
      prevChart=currChart;
      res++;
     }
   //--- Return the obtained loop counter
   return res;
  }
//+------------------------------------------------------------------+
A lógica do método é descrita nos comentários no código. Resumindo: definitivamente temos um gráfico aberto, e nosso programa está sendo executado nele. Por isso, o contador de loops começa a partir de um. Mais adiante no loop, obtemos cada gráfico com base no anterior, enquanto o contador aumenta. Como resultado, após o loop, retornamos o valor do contador obtido.
Método que cria um novo objeto-gráfico e o adiciona à lista-coleção:
//+------------------------------------------------------------------+
//| Create a new chart object and add it to the list                 |
//+------------------------------------------------------------------+
bool CChartObjCollection::CreateNewChartObj(const long chart_id,const string source)
  {
   ::ResetLastError();
   CChartObj *chart_obj=new CChartObj(chart_id);
   if(chart_obj==NULL)
     {
      CMessage::ToLog(source,MSG_CHART_COLLECTION_ERR_FAILED_CREATE_CHART_OBJ,true);
      return false;
     }
   this.m_list.Sort(SORT_BY_CHART_ID);
   if(!this.m_list.InsertSort(chart_obj))
     {
      CMessage::ToLog(source,MSG_CHART_COLLECTION_ERR_FAILED_ADD_CHART,true);
      delete chart_obj;
      return false;
     }
   return true;
  }
//+------------------------------------------------------------------+
Aqui: para o método (chart_id) é passado o identificador do gráfico cujo objeto-gráfico precisa ser criado e é passado o nome (source) do método a partir do qual foi chamado este método. Criamos um novo objeto-gráfico, e se não for possível criá-lo, exibimos uma mensagem sobre isso e retornamos false. Se o objeto for criado com sucesso, definimos (para a lista de coleção) o sinalizador de lista classificada por identificadores dos gráficos e tentamos adicionar um objeto a uma lista classificada. Se não for possível adicionar um objeto à lista, imprimimos uma mensagem, excluímos o objeto recém-criado e retornamos false. Se tudo correr bem, devolvemos true.
Método que retorna um ponteiro para o objeto-gráfico pelo identificador do gráfico:
//+------------------------------------------------------------------+
//| Return the pointer to the chart object by ID                     |
//+------------------------------------------------------------------+
CChartObj *CChartObjCollection::GetChart(const long id)
  {
   CArrayObj *list=CSelect::ByChartProperty(GetList(),CHART_PROP_ID,id,EQUAL);
   return(list!=NULL ? list.At(0) : NULL);
  }
//+------------------------------------------------------------------+
Aqui: obtemos uma lista de objetos-gráfico com a propriedade "identificador do gráfico" igual ao valor passado para o método (pode haver apenas um objeto-gráfico na lista, uma vez que os identificadores de gráficos são únicos). Se o objeto for recebido numa nova lista de um elemento, nós o devolvemos. Em todos os outros casos, nós retornamos NULL - o objeto não foi recebido.
Método que retorna o sinalizador que indica a existência do objeto-gráfico:
//+------------------------------------------------------------------+
//| Return the flag indicating the existence of a chart object       |
//+------------------------------------------------------------------+
bool CChartObjCollection::IsPresentChartObj(const long chart_id)
  {
   return(this.GetChart(chart_id)!=NULL);
  }
//+------------------------------------------------------------------+
Aqui: se o objeto com o identificador especificado puder ser obtido da lista-coleção (resultado da consulta não é igual a NULL), então será retornado true. Caso contrário, false.
Método que retorna o sinalizador que indica existência do gráfico no terminal do cliente:
//+------------------------------------------------------------------+
//| Return the flag indicating the existence of a chart              |
//+------------------------------------------------------------------+
bool CChartObjCollection::IsPresentChart(const long chart_id)
  {
   //--- Declare the variables and get the first chart ID
   long curr_chart,prev_chart=::ChartFirst();
   //--- If the IDs match, return 'true'
   if(prev_chart==chart_id)
      return true;
   int i=0;
   //--- In the loop by the total number of terminal charts (not more than 100)
   while(i<CHARTS_MAX)
     {
      //--- based on the previous one, get the new chart
      curr_chart=::ChartNext(prev_chart);
      //--- When reaching the end of the chart list, complete the loop
      if(curr_chart<0) break;
      //--- If the IDs match, return 'true'
      if(curr_chart==chart_id)
         return true;
      //--- remember the current chart ID for ChartNext() and increase the loop counter
      prev_chart=curr_chart;
      i++;
     }
   return false;
  }
//+------------------------------------------------------------------+
Aqui, num loop percorrendo os gráficos do terminal obtidos com base no identificador do gráfico anterior, verificamos se o identificador do gráfico atualmente selecionado no loop corresponde ao valor passado para o método. Se os valores corresponderem, existe um gráfico com este identificador, retornamos true.
No final do ciclo, retornamos false - o gráfico com o identificador solicitado não foi encontrado.
Um método que procura um objeto-gráfico ausente, cria e o adiciona à lista de coleção:
//+------------------------------------------------------------------+
//| Find a missing chart object,                                     |
//| create it and add to the collection list                         |
//+------------------------------------------------------------------+
bool CChartObjCollection::FindAndCreateMissingChartObj(void)
  {
   //--- Declare the variables and get the first chart ID
   long curr_chart,prev_chart=::ChartFirst();
   int i=0;
   //--- If the first chart object is not in the list, attempt to create and add it to the list
   if(!this.IsPresentChartObj(prev_chart) && !this.CreateNewChartObj(prev_chart,DFUN))
      return false;
   //--- In the loop by the total number of terminal charts (not more than 100), look for the rest of the charts
   while(i<CHARTS_MAX)
     {
      //--- based on the previous one, get the new chart
      curr_chart=::ChartNext(prev_chart);
      //--- When reaching the end of the chart list, complete the loop
      if(curr_chart<0) break;
      //--- If the object is not in the list, attempt to create and add it to the list
      if(!this.IsPresentChartObj(curr_chart) && !this.CreateNewChartObj(curr_chart,DFUN))
         return false;
      //--- remember the current chart ID for ChartNext() and increase the loop counter
      prev_chart=curr_chart;
      i++;
     }
   return true;
  }
//+------------------------------------------------------------------+
Aqui também usamos o loop através dos gráficos com base no identificador do gráfico anterior. Primeiro, determinamos a presença/ausência do objeto-gráfico com o programa na lista-coleção, e depoisnum loop por todos os outros gráficos também procuramos os objetos que faltam nos gráficos existentes no terminal e os adicionamos à lista de coleção.
Método que procura e remove um objeto-gráfico da lista que está ausente no terminal, mas está presente na lista-coleção:
//+-----------------------------------------------------------------------------+
//|Find a chart object not present in the terminal and remove it from the list  |
//+-----------------------------------------------------------------------------+
void CChartObjCollection::FindAndDeleteExcessChartObj(void)
  {
   for(int i=this.m_list.Total()-1;i>WRONG_VALUE;i--)
     {
      CChartObj *chart=this.m_list.At(i);
      if(chart==NULL)
         continue;
      if(!this.IsPresentChart(chart.ID()))
        {
         m_list.Delete(i);
        }
     }
  }
//+------------------------------------------------------------------+
Aqui: num loop reverso através de todos os objetos-gráficos na lista de coleção obtemos outro objeto-gráfico, e se não houver nenhum gráfico com um identificador como o objeto-gráfico no terminal do cliente, removemos este objeto da lista-coleção.
Assim concluímos a criação da primeira versão da classe-coleção de objetos-gráficos.
Agora precisamos anexar à classe principal da biblioteca CEngine o arquivo da classe-coleção criada de objetos-gráficos e criar métodos nela para acessar os métodos da classe-coleção de objetos-gráficos - para que possamos trabalhar com eles a partir de nossos programas.
No arquivo \MQL5\Include\DoEasy\Engine.mqh da classe CEngine anexamos o arquivo da classe-coleção de objetos-gráficos recém-criada:
//+------------------------------------------------------------------+
//|                                                       Engine.mqh |
//|                        Copyright 2020, MetaQuotes Software Corp. |
//|                             https://mql5.com/en/users/artmedia70 |
//+------------------------------------------------------------------+
#property copyright "Copyright 2020, MetaQuotes Software Corp."
#property link      "https://mql5.com/en/users/artmedia70"
#property version   "1.00"
//+------------------------------------------------------------------+
//| Include files                                                    |
//+------------------------------------------------------------------+
#include "Services\TimerCounter.mqh"
#include "Collections\HistoryCollection.mqh"
#include "Collections\MarketCollection.mqh"
#include "Collections\EventsCollection.mqh"
#include "Collections\AccountsCollection.mqh"
#include "Collections\SymbolsCollection.mqh"
#include "Collections\ResourceCollection.mqh"
#include "Collections\TimeSeriesCollection.mqh"
#include "Collections\BuffersCollection.mqh"
#include "Collections\IndicatorsCollection.mqh"
#include "Collections\TickSeriesCollection.mqh"
#include "Collections\BookSeriesCollection.mqh"
#include "Collections\MQLSignalsCollection.mqh"
#include "Collections\ChartObjCollection.mqh"
#include "TradingControl.mqh"
//+------------------------------------------------------------------+
Na seção privada da classe declaramos um objeto da classe-coleção de gráficos:
//+------------------------------------------------------------------+
//| Library basis class                                              |
//+------------------------------------------------------------------+
class CEngine
  {
private:
   CHistoryCollection   m_history;                       // Collection of historical orders and deals
   CMarketCollection    m_market;                        // Collection of market orders and deals
   CEventsCollection    m_events;                        // Event collection
   CAccountsCollection  m_accounts;                      // Account collection
   CSymbolsCollection   m_symbols;                       // Symbol collection
   CTimeSeriesCollection m_time_series;                  // Timeseries collection
   CBuffersCollection   m_buffers;                       // Collection of indicator buffers
   CIndicatorsCollection m_indicators;                   // Indicator collection
   CTickSeriesCollection m_tick_series;                  // Collection of tick series
   CMBookSeriesCollection m_book_series;                 // Collection of DOM series
   CMQLSignalsCollection m_signals_mql5;                 // Collection of MQL5.com Signals service signals
   CChartObjCollection  m_charts;                        // Chart collection
   CResourceCollection  m_resource;                      // Resource list
   CTradingControl      m_trading;                       // Trading management object
   CPause               m_pause;                         // Pause object
   CArrayObj            m_list_counters;                 // List of timer counters
Na seção pública da classe, colocamos os métodos para acessar a classe-coleção de objetos-gráficos:
//--- Display (1) the complete, (2) short collection description in the journal and (3) parameters of the signal copying settings
   void                 SignalsMQL5Print(void)                                         { m_signals_mql5.Print();                             }
   void                 SignalsMQL5PrintShort(const bool list=false,const bool paid=true,const bool free=true)
                                                                                       { m_signals_mql5.PrintShort(list,paid,free);          }
   void                 SignalsMQL5CurrentSubscriptionParameters(void)                 { this.m_signals_mql5.CurrentSubscriptionParameters();}

//--- Current the chart collection
   bool                 ChartCreateCollection(void)                                    { return this.m_charts.CreateCollection();            }
//--- Return (1) the chart collection and (2) the list of charts from the chart collection
   CChartObjCollection *GetChartObjCollection(void)                                    { return &this.m_charts;                              }
   CArrayObj           *GetListCharts(void)                                            { return this.m_charts.GetList();                     }

//--- Return (1) the specified chart object and (2) the chart object with the program
   CChartObj           *ChartGetChartObj(const long chart_id)                          { return this.m_charts.GetChart(chart_id);            }
   CChartObj           *ChartGetMainChart(void)                                        { return this.m_charts.GetChart(this.m_charts.GetMainChartID());}

//--- Update (1) the chart specified by ID and (2) all charts
   void                 ChartRefresh(const long chart_id)                              { this.m_charts.Refresh(chart_id);                    }
   void                 ChartsRefreshAll(void)                                         { this.m_charts.Refresh();                            }

//--- Return the list of chart objects by (1) symbol and (2) timeframe
   CArrayObj           *ChartGetChartsList(const string symbol)                        { return this.m_charts.GetChartsList(symbol);         }
   CArrayObj           *ChartGetChartsList(const ENUM_TIMEFRAMES timeframe)            { return this.m_charts.GetChartsList(timeframe);      }

//--- Return (1) the buffer collection and (2) the buffer list from the collection
Todos os métodos recém-adicionados simplesmente retornam o resultado da chamada dos métodos correspondentes da coleção de objetos-gráficos que acabamos de discutir acima. Todos esses métodos estarão disponíveis em nossos programas baseados na biblioteca.
No construtor da classe adicionamos a criação de um novo contador, para uma classe-coleção de objetos-gráficos:
//+------------------------------------------------------------------+
//| CEngine constructor                                              |
//+------------------------------------------------------------------+
CEngine::CEngine() : m_first_start(true),
                     m_last_trade_event(TRADE_EVENT_NO_EVENT),
                     m_last_account_event(WRONG_VALUE),
                     m_last_symbol_event(WRONG_VALUE),
                     m_global_error(ERR_SUCCESS)
  {
   this.m_is_hedge=#ifdef __MQL4__ true #else bool(::AccountInfoInteger(ACCOUNT_MARGIN_MODE)==ACCOUNT_MARGIN_MODE_RETAIL_HEDGING) #endif;
   this.m_is_tester=::MQLInfoInteger(MQL_TESTER);
   this.m_program=(ENUM_PROGRAM_TYPE)::MQLInfoInteger(MQL_PROGRAM_TYPE);
   this.m_name=::MQLInfoString(MQL_PROGRAM_NAME);

   this.m_list_counters.Sort();
   this.m_list_counters.Clear();
   this.CreateCounter(COLLECTION_ORD_COUNTER_ID,COLLECTION_ORD_COUNTER_STEP,COLLECTION_ORD_PAUSE);
   this.CreateCounter(COLLECTION_ACC_COUNTER_ID,COLLECTION_ACC_COUNTER_STEP,COLLECTION_ACC_PAUSE);
   this.CreateCounter(COLLECTION_SYM_COUNTER_ID1,COLLECTION_SYM_COUNTER_STEP1,COLLECTION_SYM_PAUSE1);
   this.CreateCounter(COLLECTION_SYM_COUNTER_ID2,COLLECTION_SYM_COUNTER_STEP2,COLLECTION_SYM_PAUSE2);
   this.CreateCounter(COLLECTION_REQ_COUNTER_ID,COLLECTION_REQ_COUNTER_STEP,COLLECTION_REQ_PAUSE);
   this.CreateCounter(COLLECTION_TS_COUNTER_ID,COLLECTION_TS_COUNTER_STEP,COLLECTION_TS_PAUSE);
   this.CreateCounter(COLLECTION_IND_TS_COUNTER_ID,COLLECTION_IND_TS_COUNTER_STEP,COLLECTION_IND_TS_PAUSE);
   this.CreateCounter(COLLECTION_TICKS_COUNTER_ID,COLLECTION_TICKS_COUNTER_STEP,COLLECTION_TICKS_PAUSE);
   this.CreateCounter(COLLECTION_CHARTS_COUNTER_ID,COLLECTION_CHARTS_COUNTER_STEP,COLLECTION_CHARTS_PAUSE);

   ::ResetLastError();
   #ifdef __MQL5__
      if(!::EventSetMillisecondTimer(TIMER_FREQUENCY))
        {
         ::Print(DFUN_ERR_LINE,CMessage::Text(MSG_LIB_SYS_FAILED_CREATE_TIMER),(string)::GetLastError());
         this.m_global_error=::GetLastError();
        }
   //---__MQL4__
   #else
      if(!this.IsTester() && !::EventSetMillisecondTimer(TIMER_FREQUENCY))
        {
         ::Print(DFUN_ERR_LINE,CMessage::Text(MSG_LIB_SYS_FAILED_CREATE_TIMER),(string)::GetLastError());
         this.m_global_error=::GetLastError();
        }
   #endif
   //---
  }
//+------------------------------------------------------------------+
No temporizador da classe, adicionamos um bloco de código para trabalhar com uma coleção de objetos-gráficos:
//+------------------------------------------------------------------+
//| CEngine timer                                                    |
//+------------------------------------------------------------------+
void CEngine::OnTimer(SDataCalculate &data_calculate)
  {
//--- If this is not a tester, work with collection events by timer
   if(!this.IsTester())
     {
   //--- Timer of the collections of historical orders and deals, as well as of market orders and positions
      int index=this.CounterIndex(COLLECTION_ORD_COUNTER_ID);
      CTimerCounter* cnt1=this.m_list_counters.At(index);
      if(cnt1!=NULL)
        {
         //--- If unpaused, work with the order, deal and position collections events
         if(cnt1.IsTimeDone())
            this.TradeEventsControl();
        }
   //--- Account collection timer
      index=this.CounterIndex(COLLECTION_ACC_COUNTER_ID);
      CTimerCounter* cnt2=this.m_list_counters.At(index);
      if(cnt2!=NULL)
        {
         //--- If unpaused, work with the account collection events
         if(cnt2.IsTimeDone())
            this.AccountEventsControl();
        }
   //--- Timer 1 of the symbol collection (updating symbol quote data in the collection)
      index=this.CounterIndex(COLLECTION_SYM_COUNTER_ID1);
      CTimerCounter* cnt3=this.m_list_counters.At(index);
      if(cnt3!=NULL)
        {
         //--- If the pause is over, update quote data of all symbols in the collection
         if(cnt3.IsTimeDone())
            this.m_symbols.RefreshRates();
        }
   //--- Timer 2 of the symbol collection (updating all data of all symbols in the collection and tracking symbl and symbol search events in the market watch window)
      index=this.CounterIndex(COLLECTION_SYM_COUNTER_ID2);
      CTimerCounter* cnt4=this.m_list_counters.At(index);
      if(cnt4!=NULL)
        {
         //--- If the pause is over
         if(cnt4.IsTimeDone())
           {
            //--- update data and work with events of all symbols in the collection
            this.SymbolEventsControl();
            //--- When working with the market watch list, check the market watch window events
            if(this.m_symbols.ModeSymbolsList()==SYMBOLS_MODE_MARKET_WATCH)
               this.MarketWatchEventsControl();
           }
        }
   //--- Trading class timer
      index=this.CounterIndex(COLLECTION_REQ_COUNTER_ID);
      CTimerCounter* cnt5=this.m_list_counters.At(index);
      if(cnt5!=NULL)
        {
         //--- If unpaused, work with the list of pending requests
         if(cnt5.IsTimeDone())
            this.m_trading.OnTimer();
        }
   //--- Timeseries collection timer
      index=this.CounterIndex(COLLECTION_TS_COUNTER_ID);
      CTimerCounter* cnt6=this.m_list_counters.At(index);
      if(cnt6!=NULL)
        {
         //--- If the pause is over, work with the timeseries list (update all except the current one)
         if(cnt6.IsTimeDone())
            this.SeriesRefreshAllExceptCurrent(data_calculate);
        }

   //--- Timer of timeseries collection of indicator buffer data
      index=this.CounterIndex(COLLECTION_IND_TS_COUNTER_ID);
      CTimerCounter* cnt7=this.m_list_counters.At(index);
      if(cnt7!=NULL)
        {
         //--- If the pause is over, work with the timeseries list of indicator data (update all except for the current one)
         if(cnt7.IsTimeDone())
            this.IndicatorSeriesRefreshAll();
        }
   //--- Tick series collection timer
      index=this.CounterIndex(COLLECTION_TICKS_COUNTER_ID);
      CTimerCounter* cnt8=this.m_list_counters.At(index);
      if(cnt8!=NULL)
        {
         //--- If the pause is over, work with the tick series list (update all except the current one)
         if(cnt8.IsTimeDone())
            this.TickSeriesRefreshAllExceptCurrent();
        }
   //--- Chart collection timer
      index=this.CounterIndex(COLLECTION_CHARTS_COUNTER_ID);
      CTimerCounter* cnt9=this.m_list_counters.At(index);
      if(cnt9!=NULL)
        {
         //--- If unpaused, work with the chart list
         if(cnt9.IsTimeDone())
            this.ChartsRefreshAll();
        }
     }
//--- If this is a tester, work with collection events by tick
   else
     {
      //--- work with events of collections of orders, deals and positions by tick
      this.TradeEventsControl();
      //--- work with events of collections of accounts by tick
      this.AccountEventsControl();
      //--- update quote data of all collection symbols by tick
      this.m_symbols.RefreshRates();
      //--- work with events of all symbols in the collection by tick
      this.SymbolEventsControl();
      //--- work with the list of pending orders by tick
      this.m_trading.OnTimer();
      //--- work with the timeseries list by tick
      this.SeriesRefresh(data_calculate);
      //--- work with the timeseries list of indicator buffers by tick
      this.IndicatorSeriesRefreshAll();
      //--- work with the list of tick series by tick
      this.TickSeriesRefreshAll();
     }
  }
//+------------------------------------------------------------------+
Assim que o contador do temporizador de coleção fizer a contagem regressiva de meio segundo, o método para atualizar todos os objetos-gráficos será chamado em sua coleção. Assim, automatizamos o rastreamento das mudanças no número de gráficos no terminal e nas janelas anexadas a cada gráfico aberto.
Vamos testar a classe criada hoje.
Teste
Para o teste, vamos pegar o EA do último artigo e o salvar numa nova pasta \MQL5\Experts\TestDoEasy\Part69\ com o novo nome TestDoEasyPart69.mq5.
Na verdade, não mudaremos muito a lógica do Expert Advisor anterior, exibiremos da mesma maneira breves descrições de todos os objetos-gráficos cujos gráficos estão abertos no terminal, e para o gráfico principal exibiremos sua descrição completa. Além disso, na classe-coleção de objetos-gráficos, no método de atualização de lista de coleção, adicionamos a saída de um comentário no gráfico informando quantos objetos-gráficos temos na coleção, quantos gráficos estão abertos no terminal e qual é a diferença em número. Removeremos este comentário de depuração mais tarde. Hoje vamos verificar o trabalho da classe-coleção de objetos-gráficos.
Em primeiro lugar removemos o anexo do arquivo de classe do objeto-gráfico do código do EA:
//+------------------------------------------------------------------+
//|                                             TestDoEasyPart68.mq5 |
//|                        Copyright 2021, MetaQuotes Software Corp. |
//|                             https://mql5.com/en/users/artmedia70 |
//+------------------------------------------------------------------+
#property copyright "Copyright 2021, MetaQuotes Software Corp."
#property link      "https://mql5.com/en/users/artmedia70"
#property version   "1.00"
//--- includes
#include <DoEasy\Engine.mqh>
#include <DoEasy\Objects\Chart\ChartObj.mqh>
//--- enums
Agora temos uma classe-coleção de objetos-gráficos anexados ao objeto principal da biblioteca e todas as classes de gráficos e suas coleções estão disponíveis a partir dela.
No bloco de variáveis de entrada adicionamos uma variável que indica um sinalizador de uso da classe-coleção de objetos-gráficos no programa:
//--- input variables
input    ushort            InpMagic             =  123;  // Magic number
input    double            InpLots              =  0.1;  // Lots
input    uint              InpStopLoss          =  150;  // StopLoss in points
input    uint              InpTakeProfit        =  150;  // TakeProfit in points
input    uint              InpDistance          =  50;   // Pending orders distance (points)
input    uint              InpDistanceSL        =  50;   // StopLimit orders distance (points)
input    uint              InpDistancePReq      =  50;   // Distance for Pending Request's activate (points)
input    uint              InpBarsDelayPReq     =  5;    // Bars delay for Pending Request's activate (current timeframe)
input    uint              InpSlippage          =  5;    // Slippage in points
input    uint              InpSpreadMultiplier  =  1;    // Spread multiplier for adjusting stop-orders by StopLevel
input    uchar             InpTotalAttempts     =  5;    // Number of trading attempts
sinput   double            InpWithdrawal        =  10;   // Withdrawal funds (in tester)

sinput   uint              InpButtShiftX        =  0;    // Buttons X shift
sinput   uint              InpButtShiftY        =  10;   // Buttons Y shift

input    uint              InpTrailingStop      =  50;   // Trailing Stop (points)
input    uint              InpTrailingStep      =  20;   // Trailing Step (points)
input    uint              InpTrailingStart     =  0;    // Trailing Start (points)
input    uint              InpStopLossModify    =  20;   // StopLoss for modification (points)
input    uint              InpTakeProfitModify  =  60;   // TakeProfit for modification (points)

sinput   ENUM_SYMBOLS_MODE InpModeUsedSymbols   =  SYMBOLS_MODE_CURRENT;            // Mode of used symbols list
sinput   string            InpUsedSymbols       =  "EURUSD,AUDUSD,EURAUD,EURCAD,EURGBP,EURJPY,EURUSD,GBPUSD,NZDUSD,USDCAD,USDJPY";  // List of used symbols (comma - separator)
sinput   ENUM_TIMEFRAMES_MODE InpModeUsedTFs    =  TIMEFRAMES_MODE_LIST;            // Mode of used timeframes list
sinput   string            InpUsedTFs           =  "M1,M5,M15,M30,H1,H4,D1,W1,MN1"; // List of used timeframes (comma - separator)

sinput   ENUM_INPUT_YES_NO InpUseBook           =  INPUT_YES;                       // Use Depth of Market
sinput   ENUM_INPUT_YES_NO InpUseMqlSignals     =  INPUT_YES;                       // Use signal service
sinput   ENUM_INPUT_YES_NO InpUseCharts         =  INPUT_YES;                       // Use Charts control
sinput   ENUM_INPUT_YES_NO InpUseSounds         =  INPUT_YES;                       // Use sounds

//--- global variables
Do manipulador OnTick() do EA removemos o bloco de código, em que criamos uma lista de objetos-gráficos e exibimos suas descrições no log:
//+------------------------------------------------------------------+
//| Expert tick function                                             |
//+------------------------------------------------------------------+
void OnTick()
  {
//--- Handle the NewTick event in the library
   engine.OnTick(rates_data);

//--- If working in the tester
   if(MQLInfoInteger(MQL_TESTER))
     {
      engine.OnTimer(rates_data);   // Working in the timer
      PressButtonsControl();        // Button pressing control
      engine.EventsHandling();      // Working with events
     }

//--- If the trailing flag is set
   if(trailing_on)
     {
      TrailingPositions();          // Trailing positions
      TrailingOrders();             // Trailing pending orders
     }

//--- If it is the first launch
   static bool done=false;
   if(!done)
     {
      //--- Create the list object for storing chart objects
      CArrayObj *list=new CArrayObj();
      if(list==NULL)
         return;
      //--- Declare the variables and get the first chart ID
      long currChart,prevChart=ChartFirst();
      int i=0;
      //--- Create the chart object and add it to the list
      CChartObj *chart_first=new CChartObj(prevChart);
      list.Add(chart_first);
      //--- In the loop by the total number of terminal charts (not more than 100)
      while(i<CHARTS_MAX)
        {
         //--- based on the previous one, get the new chart
         currChart=ChartNext(prevChart);
         //--- When reaching the end of the chart list, complete the loop
         if(currChart<0) break;
         //--- Create the chart object based on the current chart ID in the loop and add it to the list
         CChartObj *chart=new CChartObj(currChart);
         list.Add(chart);
         //--- remember the current chart ID for ChartNext() and increase the loop counter
         prevChart=currChart;
         i++;
        }
      Print("");
      //--- From the filled list in the loop, receive the next chart object and display its short description
      int total=list.Total();
      for(int j=0;j<total;j++)
        {
         CChartObj *chart_obj=list.At(j);
         if(chart_obj!=NULL)
            chart_obj.PrintShort();
        }
      Print("");
      //--- Display the full description of the current chart: in the loop by all objects of the created list
      for(int j=0;j<total;j++)
        {
         //--- get the next chart object and
         CChartObj *chart_obj=list.At(j);
         //--- if its symbol matches the current chart symbol, display its full description in the journal
         if(chart_obj!=NULL && chart_obj.Symbol()==Symbol())
            chart_obj.Print();
        }
      //--- Destroy the list of chart objects
      delete list;
      done=true;
     }
//---
  }
//+------------------------------------------------------------------+
Agora essas linhas de código realizarão tudo da mesma maneira:
//+------------------------------------------------------------------+
//| Expert tick function                                             |
//+------------------------------------------------------------------+
void OnTick()
  {
//--- Handle the NewTick event in the library
   engine.OnTick(rates_data);

//--- If working in the tester
   if(MQLInfoInteger(MQL_TESTER))
     {
      engine.OnTimer(rates_data);   // Working in the timer
      PressButtonsControl();        // Button pressing control
      engine.EventsHandling();      // Working with events
     }

//--- If the trailing flag is set
   if(trailing_on)
     {
      TrailingPositions();          // Trailing positions
      TrailingOrders();             // Trailing pending orders
     }

//--- If it is the first launch
   static bool done=false;
   if(!done)
     {
      //--- Get the chart with the EA from the collection and display its full description
      CChartObj *chart_main=engine.ChartGetMainChart();
      Print("");
      chart_main.Print();
      done=true;
     }
//---
  }
//+------------------------------------------------------------------+
Aqui, exibimos apenas a descrição completa do gráfico no qual o EA está sendo executado. Exibiremos descrições curtas de todos os objetos-gráficos da coleção na função OnInitDoEasy() neste bloco de código:
//--- If working with signals is not enabled or failed to create the signal collection,
//--- disable copying deals by subscription
   else
      engine.SignalsMQL5CurrentSetSubscriptionEnableOFF();

//--- Create the chart collection
//--- If working with charts and the chart collection is created
   if(InpUseCharts && engine.ChartCreateCollection())
     {
      //--- Check created chart objects - display the short collection description in the journal
      engine.GetChartObjCollection().PrintShort();
     }

//--- Create resource text files
No manipulador OnBookEvent() do Expert Advisor comentamos a saída de informações de depuração no gráfico da classe-coleção de livros de ofertas, já que agora não precisamos ver esta informação (embora esteja presente devido ao comportamento às vezes estranho do terminal ao trabalhar com o livro de ofertas - o EA às vezes não responde por um longo tempo, e esta informação - que frequentemente altera seus valores - permite que você veja o trabalho do Expert Advisor), e a saída deste comentário nos impedirá de ver as alterações registradas pela classe-coleção de objetos-gráficos.
//+------------------------------------------------------------------+
//| OnBookEvent function                                             |
//+------------------------------------------------------------------+
void OnBookEvent(const string& symbol)
  {
   static bool first=true;
   //--- Leave if failed to update the symbol snapshot series
   if(!engine.OnBookEvent(symbol))
      return;
   //--- Work by the current symbol
   if(symbol==Symbol())
     {
      //--- Get the DOM snapshot series of the current symbol
      CMBookSeries *book_series=engine.GetMBookSeries(symbol);
      if(book_series==NULL)
         return;
      //--- Get the last DOM snapshot object from the DOM snapshot series object
      CMBookSnapshot *book=book_series.GetLastMBook();
      if(book==NULL)
         return;
      //--- Get the very first and last DOM order objects from the DOM snapshot object
      CMarketBookOrd *ord_0=book.GetMBookByListIndex(0);
      CMarketBookOrd *ord_N=book.GetMBookByListIndex(book.DataTotal()-1);
      if(ord_0==NULL || ord_N==NULL) return;
      //--- Display the time of the current DOM snapshot in the chart comment,
      //--- the maximum number of displayed orders in DOM for a symbol,
      //--- the obtained number of orders in the current DOM snapshot,
      //--- the total number of DOM snapshots set in the series list and
      //--- the highest and lowest orders of the current DOM snapshot
      //Comment
      //  (
      //   DFUN,book.Symbol(),": ",TimeMSCtoString(book.Time()),
      //   //", symbol book size=",sym.TicksBookdepth(),
      //   ", last book data total: ",book.DataTotal(),
      //   ", series books total: ",book_series.DataTotal(),
      //   "\nMax: ",ord_N.Header(),"\nMin: ",ord_0.Header()
      //  );
      //--- Display the first DOM snapshot in the journal
      if(first)
        {
         //--- series description
         book_series.Print();
         //--- snapshot description
         book.Print();
         first=false;
        }
     }
  }
//+------------------------------------------------------------------+
Compilemos o EA. Vamos abrir quatro gráficos no terminal (no primeiro vamos iniciar o Expert Advisor) e criar o mesmo ambiente que criamos durante o teste no artigo anterior:
À janela principal do gráfico do EA adicionamos o indicador de fractais + adicionamos uma janela de um indicador, por exemplo, DeMarker, nela colocaremos outro, por exemplo, AMA, calculado sobre os dados DeMarker.
No segundo gráfico, colocamos uma janela do estocástica...
Após iniciar o Expert Advisor, o log mostrará dados sobre os objetos criados da coleção de objetos-gráficos e sobre o gráfico do programa:
Chart collection:
- Main chart window EURUSD H4 ID: 131733844391938630, HWND: 920114, Subwindows: 1
- Main chart window GBPUSD H4 ID: 131733844391938633, HWND: 592798, Subwindows: No
- Main chart window AUDUSD H1 ID: 131733844391938634, HWND: 527424, Subwindows: 2
- Main chart window USDRUB H4 ID: 131733844391938635, HWND: 920468, Subwindows: No
Subscribed to Depth of Market EURUSD
Library initialization time: 00:00:05.922

============= The beginning of the parameter list (Main chart window EURUSD H4) =============
Chart ID: 131733844391938630
Timeframe: H4
Drawing attributes of a price chart: Yes
Object "Chart": No
Chart on top of other charts: No
Accessing the context menu by pressing the right mouse button: Yes
Accessing the "Crosshair tool" by pressing the middle mouse button: Yes
Scrolling the chart horizontally using the left mouse button: Yes
Sending messages about mouse wheel events to all mql5 programs on a chart: No
Send notifications of mouse move and mouse click events to all mql5 programs on a chart: No
Send a notification of an event of new object creation to all mql5-programs on a chart: No
Send a notification of an event of object deletion to all mql5-programs on a chart: No
Chart type: Display as Japanese candlesticks
Price chart in the foreground: No
Price chart indent from the right border: Yes
Automatic moving to the right border of the chart: Yes
Managing the chart using a keyboard: Yes
Allowed to intercept Space and Enter key presses on the chart to activate the quick navigation bar: Yes
Scale: 2
Fixed scale mode: No
Scale 1:1 mode: No
Scale to be specified in points per bar: No
Display a symbol ticker in the upper left corner: Yes
Display OHLC values in the upper left corner: Yes
Display Bid values as a horizontal line in a chart: Yes
Display Ask values as a horizontal line in a chart: Yes
Display Last values as a horizontal line in a chart: No
Display vertical separators between adjacent periods: No
Display grid in the chart: No
Display volume in the chart: Trade volumes
Display textual descriptions of objects: Yes
The number of bars on the chart that can be displayed: 137
The total number of chart windows, including indicator subwindows: 2
Chart window handle: 920114
Number of the first visible bar in the chart: 136
Chart width in bars: 168
Chart width in pixels: 670
 Main chart window:
 - Chart height in pixels: 293
 Chart subwindow 1:
 - The distance between the upper frame of the indicator subwindow and the upper frame of the main chart window: 295
 - Chart height in pixels: 21
Chart background color: clrWhite
Color of axes, scales and OHLC line: clrBlack
Grid color: clrSilver
Color of volumes and position opening levels: clrGreen
Color for the up bar, shadows and body borders of bull candlesticks: clrBlack
Color for the down bar, shadows and body borders of bear candlesticks: clrBlack
Line chart color and color of "Doji" Japanese candlesticks: clrBlack
Body color of a bull candlestick: clrWhite
Body color of a bear candlestick: clrBlack
Bid price level color: clrLightSkyBlue
Ask price level color: clrCoral
Line color of the last executed deal price (Last): clrSilver
Color of stop order levels (Stop Loss and Take Profit): clrOrangeRed
Displaying trade levels in the chart (levels of open positions, Stop Loss, Take Profit and pending orders): Yes
Permission to drag trading levels on a chart with a mouse: Yes
Showing the time scale on a chart: Yes
Showing the price scale on a chart: Yes
Showing the "One click trading" panel on a chart: No
Chart window is maximized: Yes
Chart window is minimized: No
The chart window is docked: Yes
The left coordinate of the undocked chart window relative to the virtual screen: 2028
The top coordinate of the undocked chart window relative to the virtual screen: 100
The right coordinate of the undocked chart window relative to the virtual screen: 2654
The bottom coordinate of the undocked chart window relative to the virtual screen: 329
------
The size of the zero bar indent from the right border in percents: 18.93
Chart fixed position from the left border in percent value: 0.00
Fixed  chart maximum: 1.21320
Fixed  chart minimum : 1.16950
Scale in points per bar: 1.00
Chart minimum: 1.16950
Chart maximum: 1.21320
------
Text of a comment in a chart: ""
The name of the Expert Advisor running on the chart: "TestDoEasyPart69"
The name of the script running on the chart: ""
Indicators in the main chart window:
- Indicator Fractals
Indicators in the chart window 1:
- Indicator DeM(14)
- Indicator AMA(14,2,30)
Symbol: "EURUSD"
============= End of the parameter list (Main chart window EURUSD H4) =============
Em seguida, primeiro adicionaremos alguns gráficos e, em seguida, excluiremos os adicionados. O comentário no gráfico refletirá as mudanças atuais no número de objetos-gráficos na coleção, o número de gráficos abertos no terminal e o valor da diferença na comparação do número de gráficos e objetos:
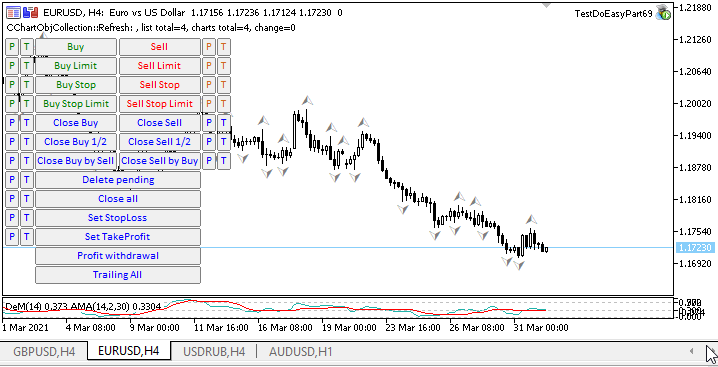
O que vem agora?
No próximo artigo, continuaremos trabalhando com a coleção de objetos-gráficos para expandir sua funcionalidade.
Todos os arquivos da versão atual da biblioteca e o arquivo do EA de teste para MQL5 estão anexados abaixo. Você pode baixá-los e testar tudo sozinho.
Se você tiver perguntas, comentários e sugestões, poderá expressá-los nos comentários do artigo.
*Artigos desta série:
Outras classes na biblioteca DoEasy (Parte 67): classe de objeto-gráfico
Outras classes na biblioteca DoEasy (Parte 68): classe de objeto-gráfico e classes de objetos-indicadores na janela do gráfico
Traduzido do russo pela MetaQuotes Ltd.
Artigo original: https://www.mql5.com/ru/articles/9260
 Conselhos de um programador profissional (Parte I): Armazenamento, depuração e compilação de códigos Trabalho com projetos e registros
 Swaps (Parte I): bloqueio e posições sintéticas
 Redes neurais de maneira fácil (Parte 13): normalização em lote
- Aplicativos de negociação gratuitos
- 8 000+ sinais para cópia
- Notícias econômicas para análise dos mercados financeiros
Você concorda com a política do site e com os termos de uso