Auftrag beendet
Spezifikation
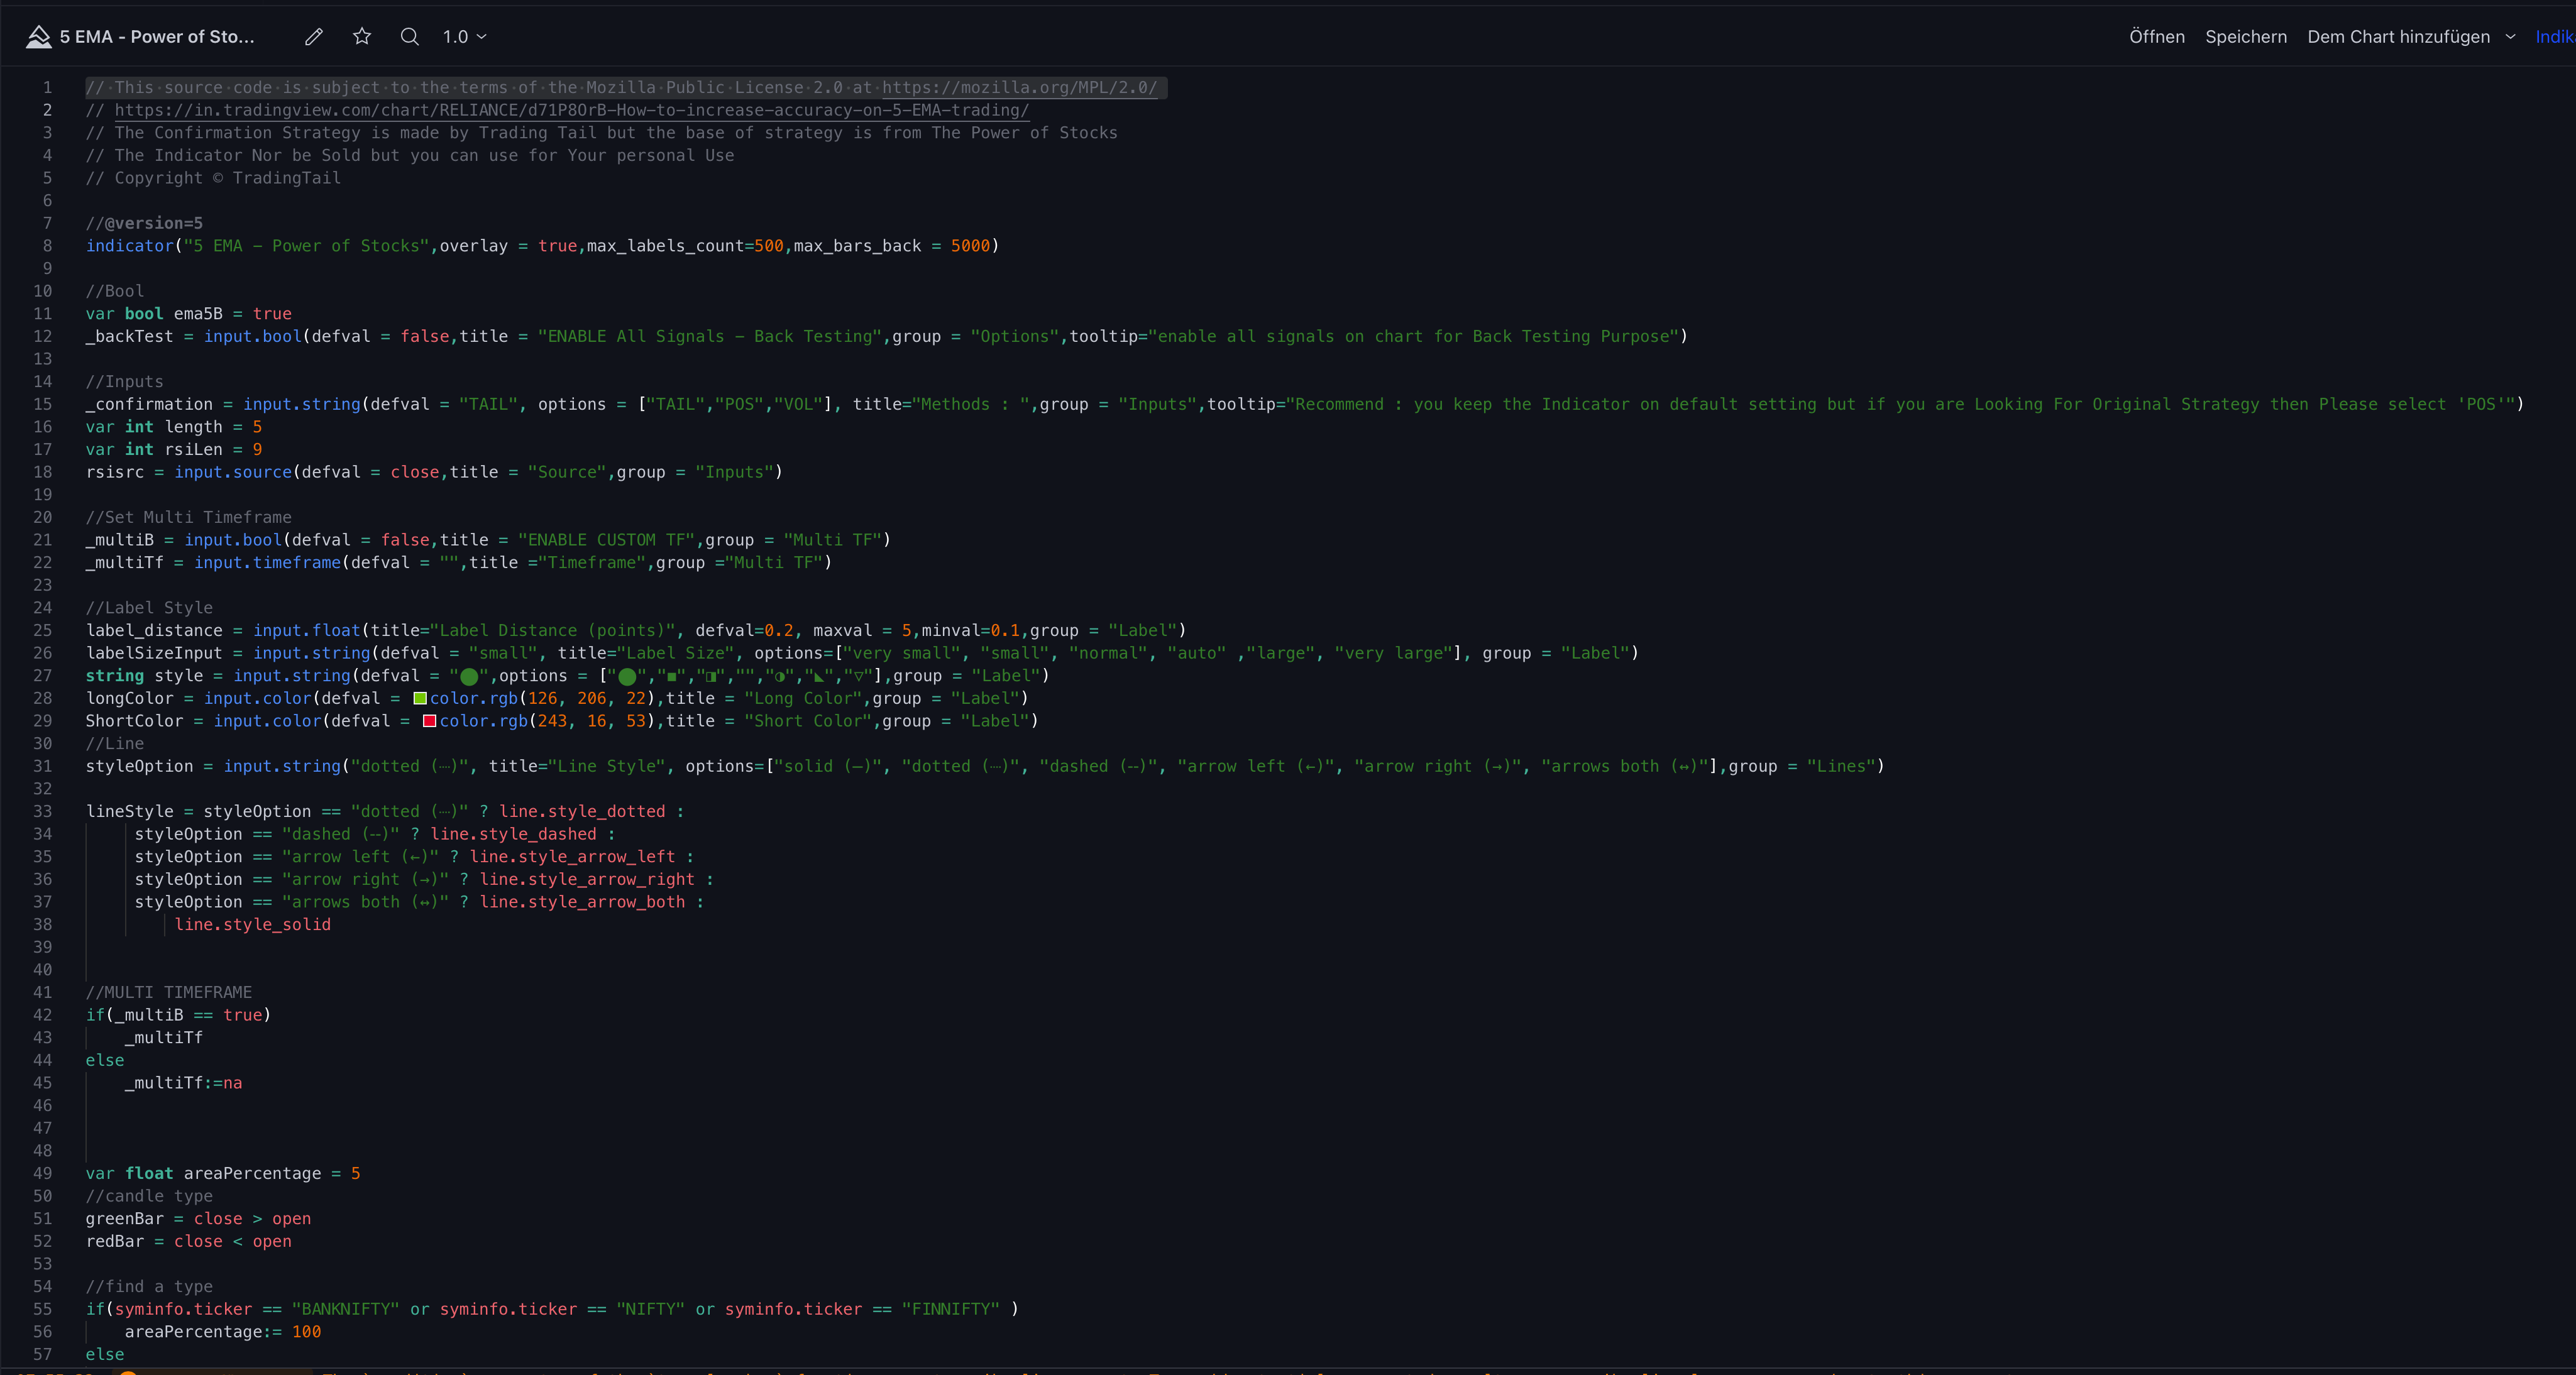
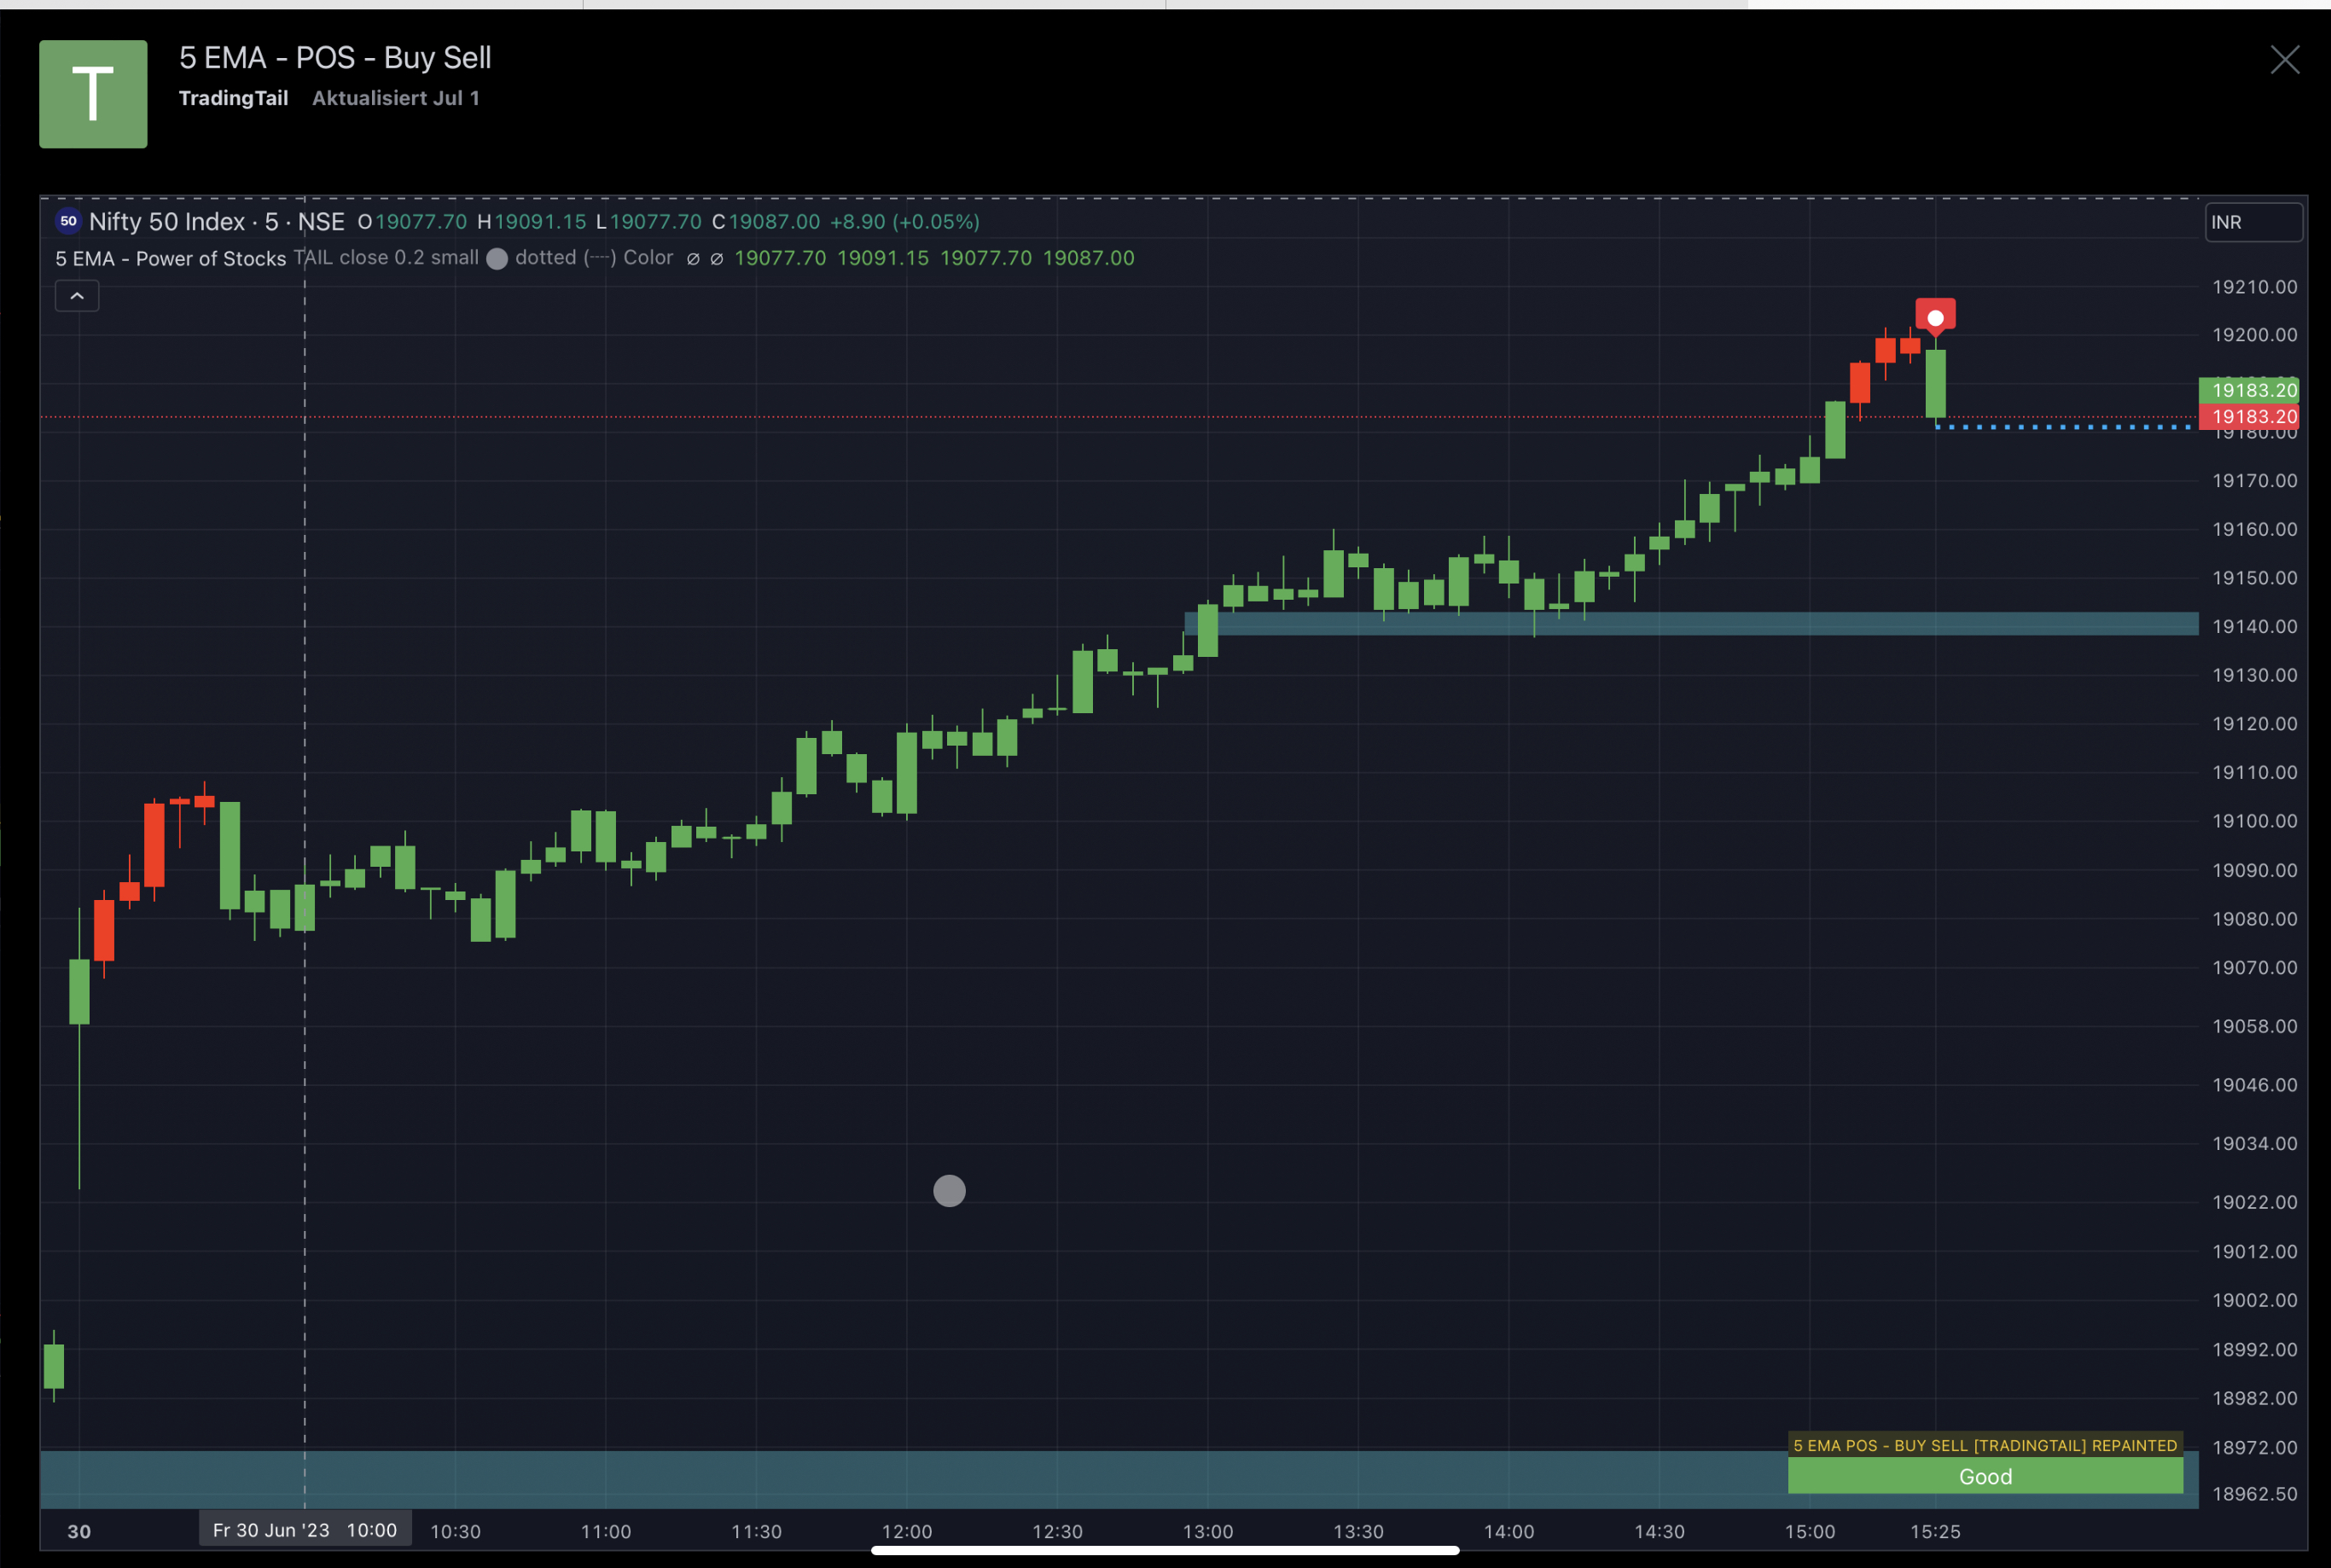
Ich suche Deutschsprachige Entwickler, der mir den Indikator aus Tradingview für den MT5 erstellt. Seine Bezeichnung ist 5 EMA - Power of Stocks von Trading Tail ( ). Der Quellcode ist bereits beigefügt, muss in MT5 umgewandelt werden. Des weiteren soll ein Alarm verfügbar sein.
// This source code is subject to the terms of the Mozilla Public License 2.0 athttps://mozilla.org/MPL/2.0/
//
// The Confirmation Strategy is made by Trading Tail but the base of strategy is from The Power of Stocks
// The Indicator Nor be Sold but you can use for Your personal Use
// Copyright © TradingTail
//@version=5
indicator("5 EMA - Power of Stocks",overlay = true,max_labels_count=500,max_bars_back = 5000)
//Bool
var bool ema5B = true
_backTest = input.bool(defval = false,title = "ENABLE All Signals - Back Testing",group = "Options",tooltip="enable all signals on chart for Back Testing Purpose")
//Inputs
_confirmation = input.string(defval = "TAIL", options = ["TAIL","POS","VOL"], title="Methods : ",group = "Inputs",tooltip="Recommend : you keep the Indicator on default setting but if you are Looking For Original Strategy then Please select 'POS'")
var int length = 5
var int rsiLen = 9
rsisrc = input.source(defval = close,title = "Source",group = "Inputs")
//Set Multi Timeframe
_multiB = input.bool(defval = false,title = "ENABLE CUSTOM TF",group = "Multi TF")
_multiTf = input.timeframe(defval = "",title ="Timeframe",group ="Multi TF")
//Label Style
label_distance = input.float(title="Label Distance (points)", defval=0.2, maxval = 5,minval=0.1,group = "Label")
labelSizeInput = input.string(defval = "small", title="Label Size", options=["very small", "small", "normal", "auto" ,"large", "very large"], group = "Label")
string style = input.string(defval = "⬤",options = ["⬤","◼","◨","","◑","◣","▽"],group = "Label")
longColor = input.color(defval = color.rgb(126, 206, 22),title = "Long Color",group = "Label")
ShortColor = input.color(defval = color.rgb(243, 16, 53),title = "Short Color",group = "Label")
//Line
styleOption = input.string("dotted (┈)", title="Line Style", options=["solid (─)", "dotted (┈)", "dashed (╌)", "arrow left (←)", "arrow right (→)", "arrows both (↔)"],group = "Lines")
lineStyle = styleOption == "dotted (┈)" ? line.style_dotted :
styleOption == "dashed (╌)" ? line.style_dashed :
styleOption == "arrow left (←)" ? line.style_arrow_left :
styleOption == "arrow right (→)" ? line.style_arrow_right :
styleOption == "arrows both (↔)" ? line.style_arrow_both :
line.style_solid
//MULTI TIMEFRAME
if(_multiB == true)
_multiTf
else
_multiTf:=na
var float areaPercentage = 5
//candle type
greenBar = close > open
redBar = close < open
//find a type
if(syminfo.ticker == "BANKNIFTY" or syminfo.ticker == "NIFTY" or syminfo.ticker == "FINNIFTY" )
areaPercentage:= 100
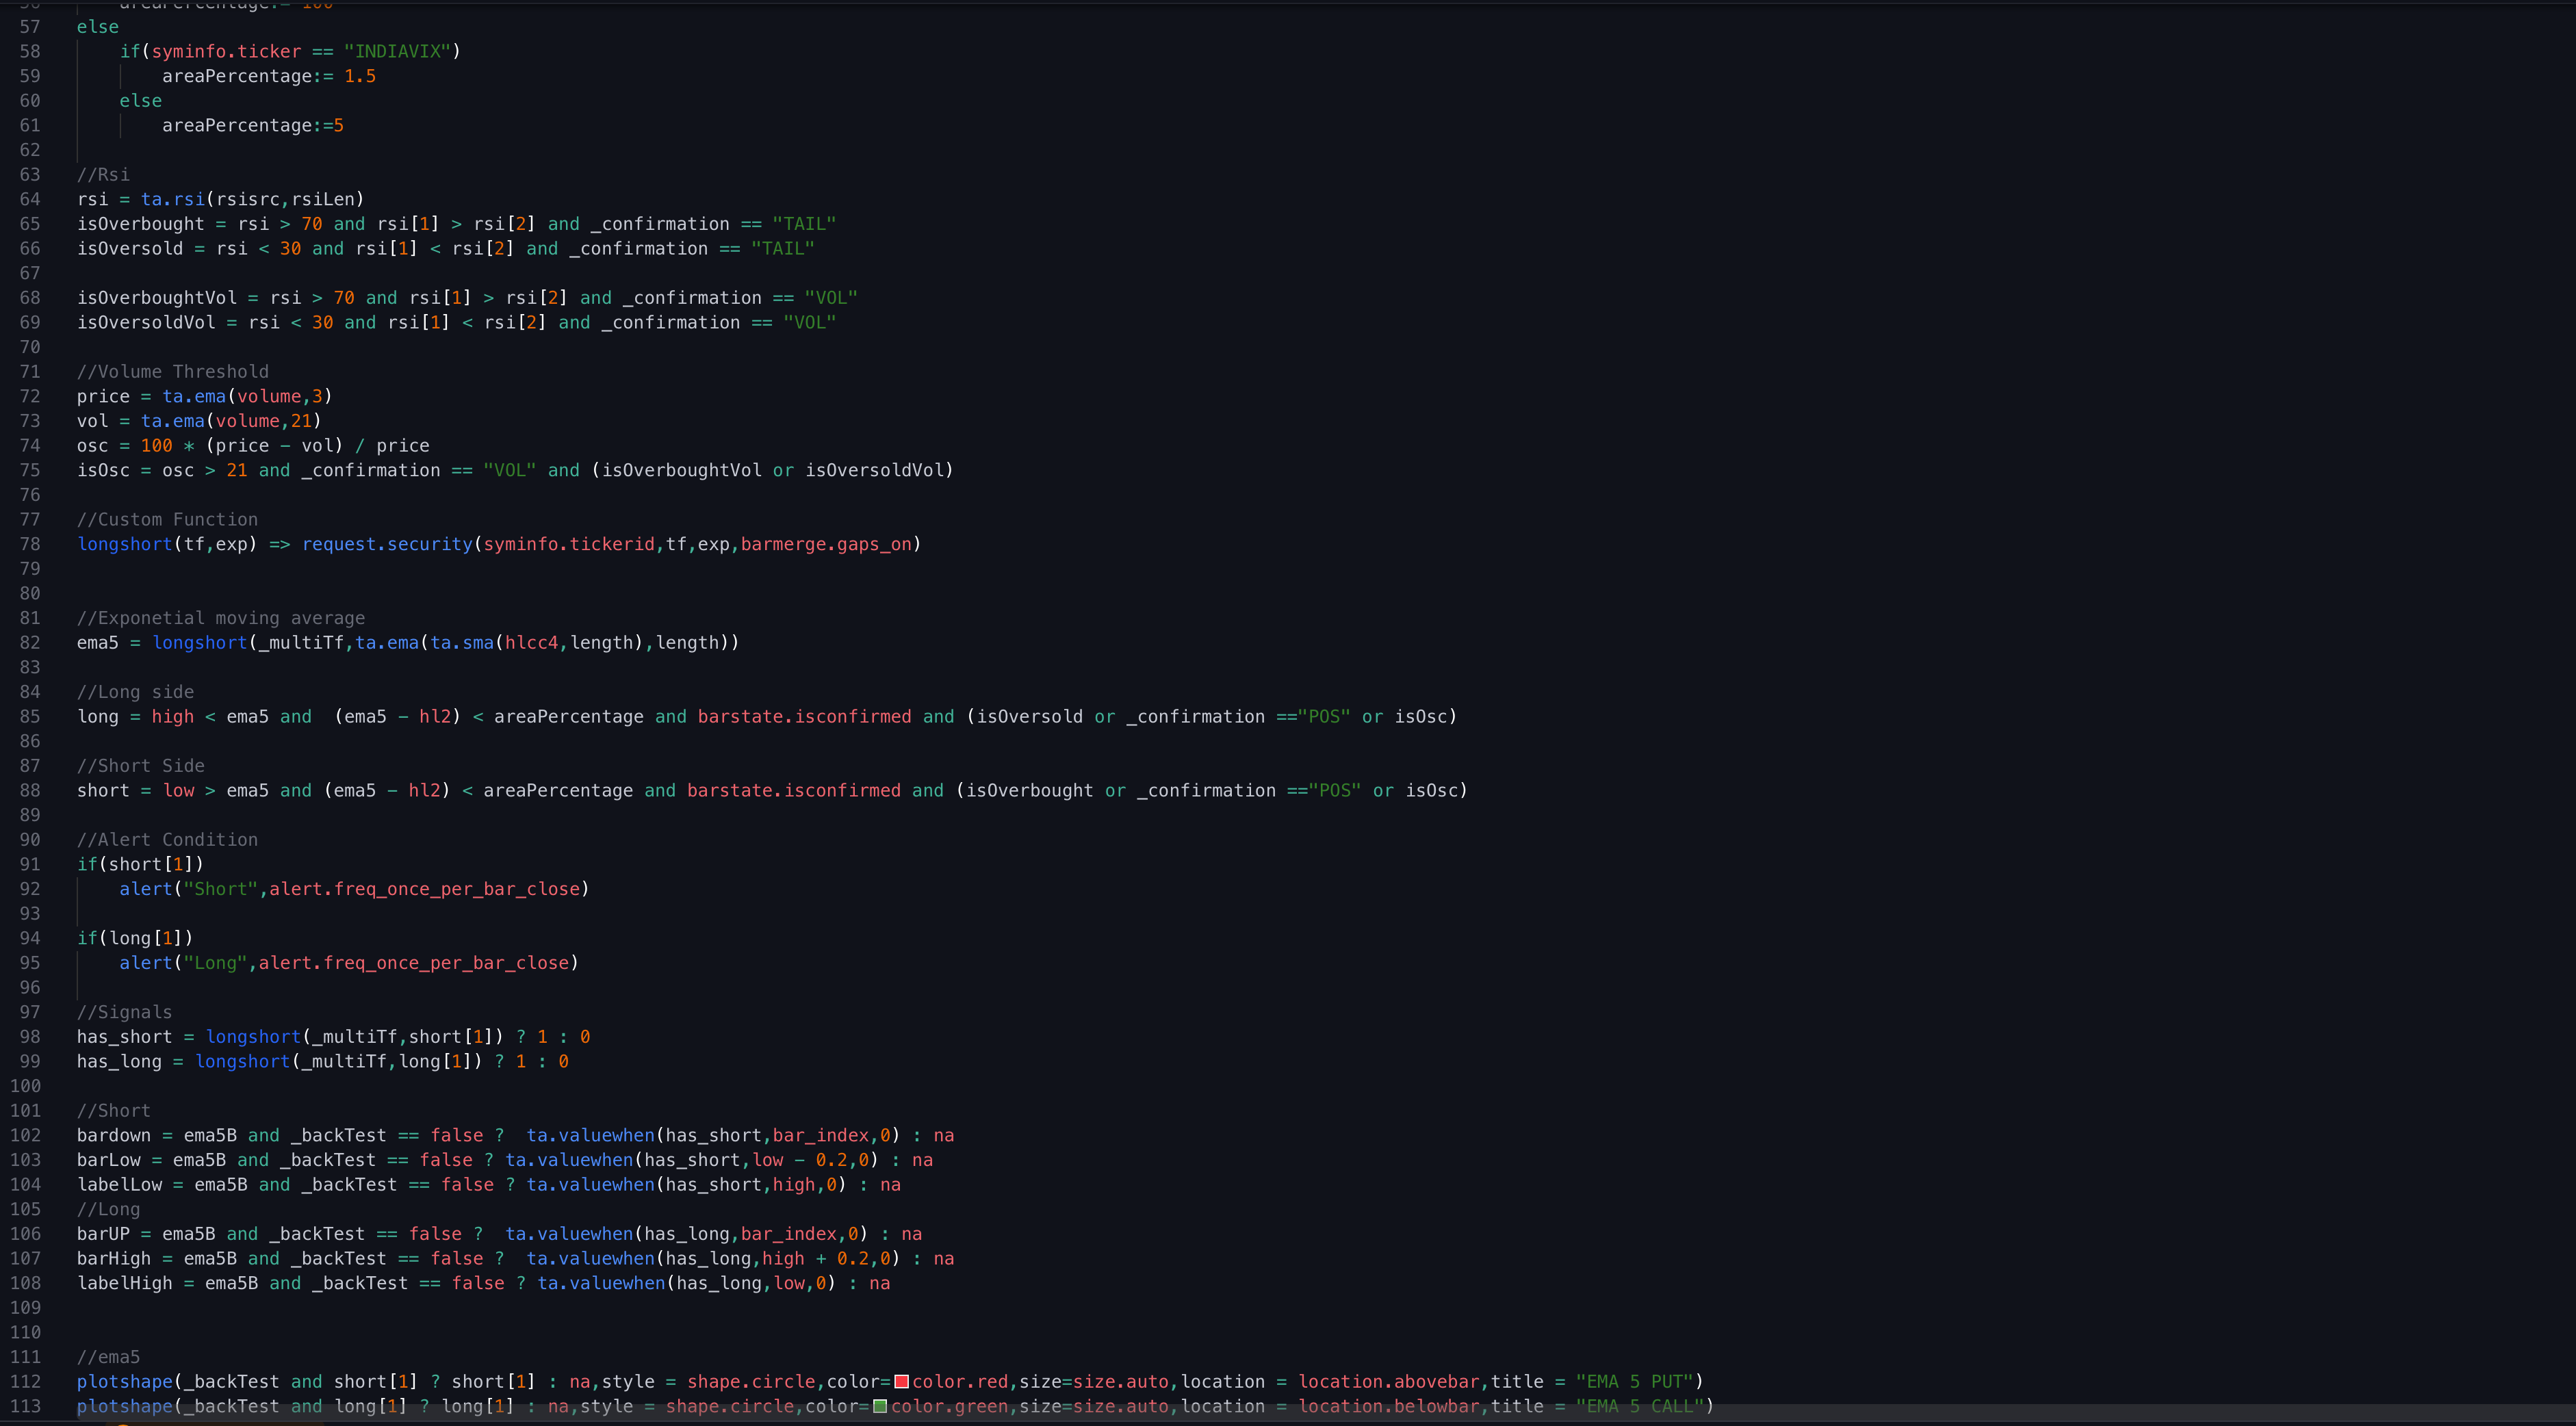
else
if(syminfo.ticker == "INDIAVIX")
areaPercentage:= 1.5
else
areaPercentage:=5
//Rsi
rsi = ta.rsi(rsisrc,rsiLen)
isOverbought = rsi > 70 and rsi[1] > rsi[2] and _confirmation == "TAIL"
isOversold = rsi < 30 and rsi[1] < rsi[2] and _confirmation == "TAIL"
isOverboughtVol = rsi > 70 and rsi[1] > rsi[2] and _confirmation == "VOL"
isOversoldVol = rsi < 30 and rsi[1] < rsi[2] and _confirmation == "VOL"
//Volume Threshold
price = ta.ema(volume,3)
vol = ta.ema(volume,21)
osc = 100 * (price - vol) / price
isOsc = osc > 21 and _confirmation == "VOL" and (isOverboughtVol or isOversoldVol)
//Custom Function
longshort(tf,exp) => request.security(syminfo.tickerid,tf,exp,barmerge.gaps_on)
//Exponetial moving average
ema5 = longshort(_multiTf,ta.ema(ta.sma(hlcc4,length),length))
//Long side
long = high < ema5 and (ema5 - hl2) < areaPercentage and barstate.isconfirmed and (isOversold or _confirmation =="POS" or isOsc)
//Short Side
short = low > ema5 and (ema5 - hl2) < areaPercentage and barstate.isconfirmed and (isOverbought or _confirmation =="POS" or isOsc)
//Alert Condition
if(short[1])
alert("Short",alert.freq_once_per_bar_close)
if(long[1])
alert("Long",alert.freq_once_per_bar_close)
//Signals
has_short = longshort(_multiTf,short[1]) ? 1 : 0
has_long = longshort(_multiTf,long[1]) ? 1 : 0
//Short
bardown = ema5B and _backTest == false ? ta.valuewhen(has_short,bar_index,0) : na
barLow = ema5B and _backTest == false ? ta.valuewhen(has_short,low - 0.2,0) : na
labelLow = ema5B and _backTest == false ? ta.valuewhen(has_short,high,0) : na
//Long
barUP = ema5B and _backTest == false ? ta.valuewhen(has_long,bar_index,0) : na
barHigh = ema5B and _backTest == false ? ta.valuewhen(has_long,high + 0.2,0) : na
labelHigh = ema5B and _backTest == false ? ta.valuewhen(has_long,low,0) : na
//ema5
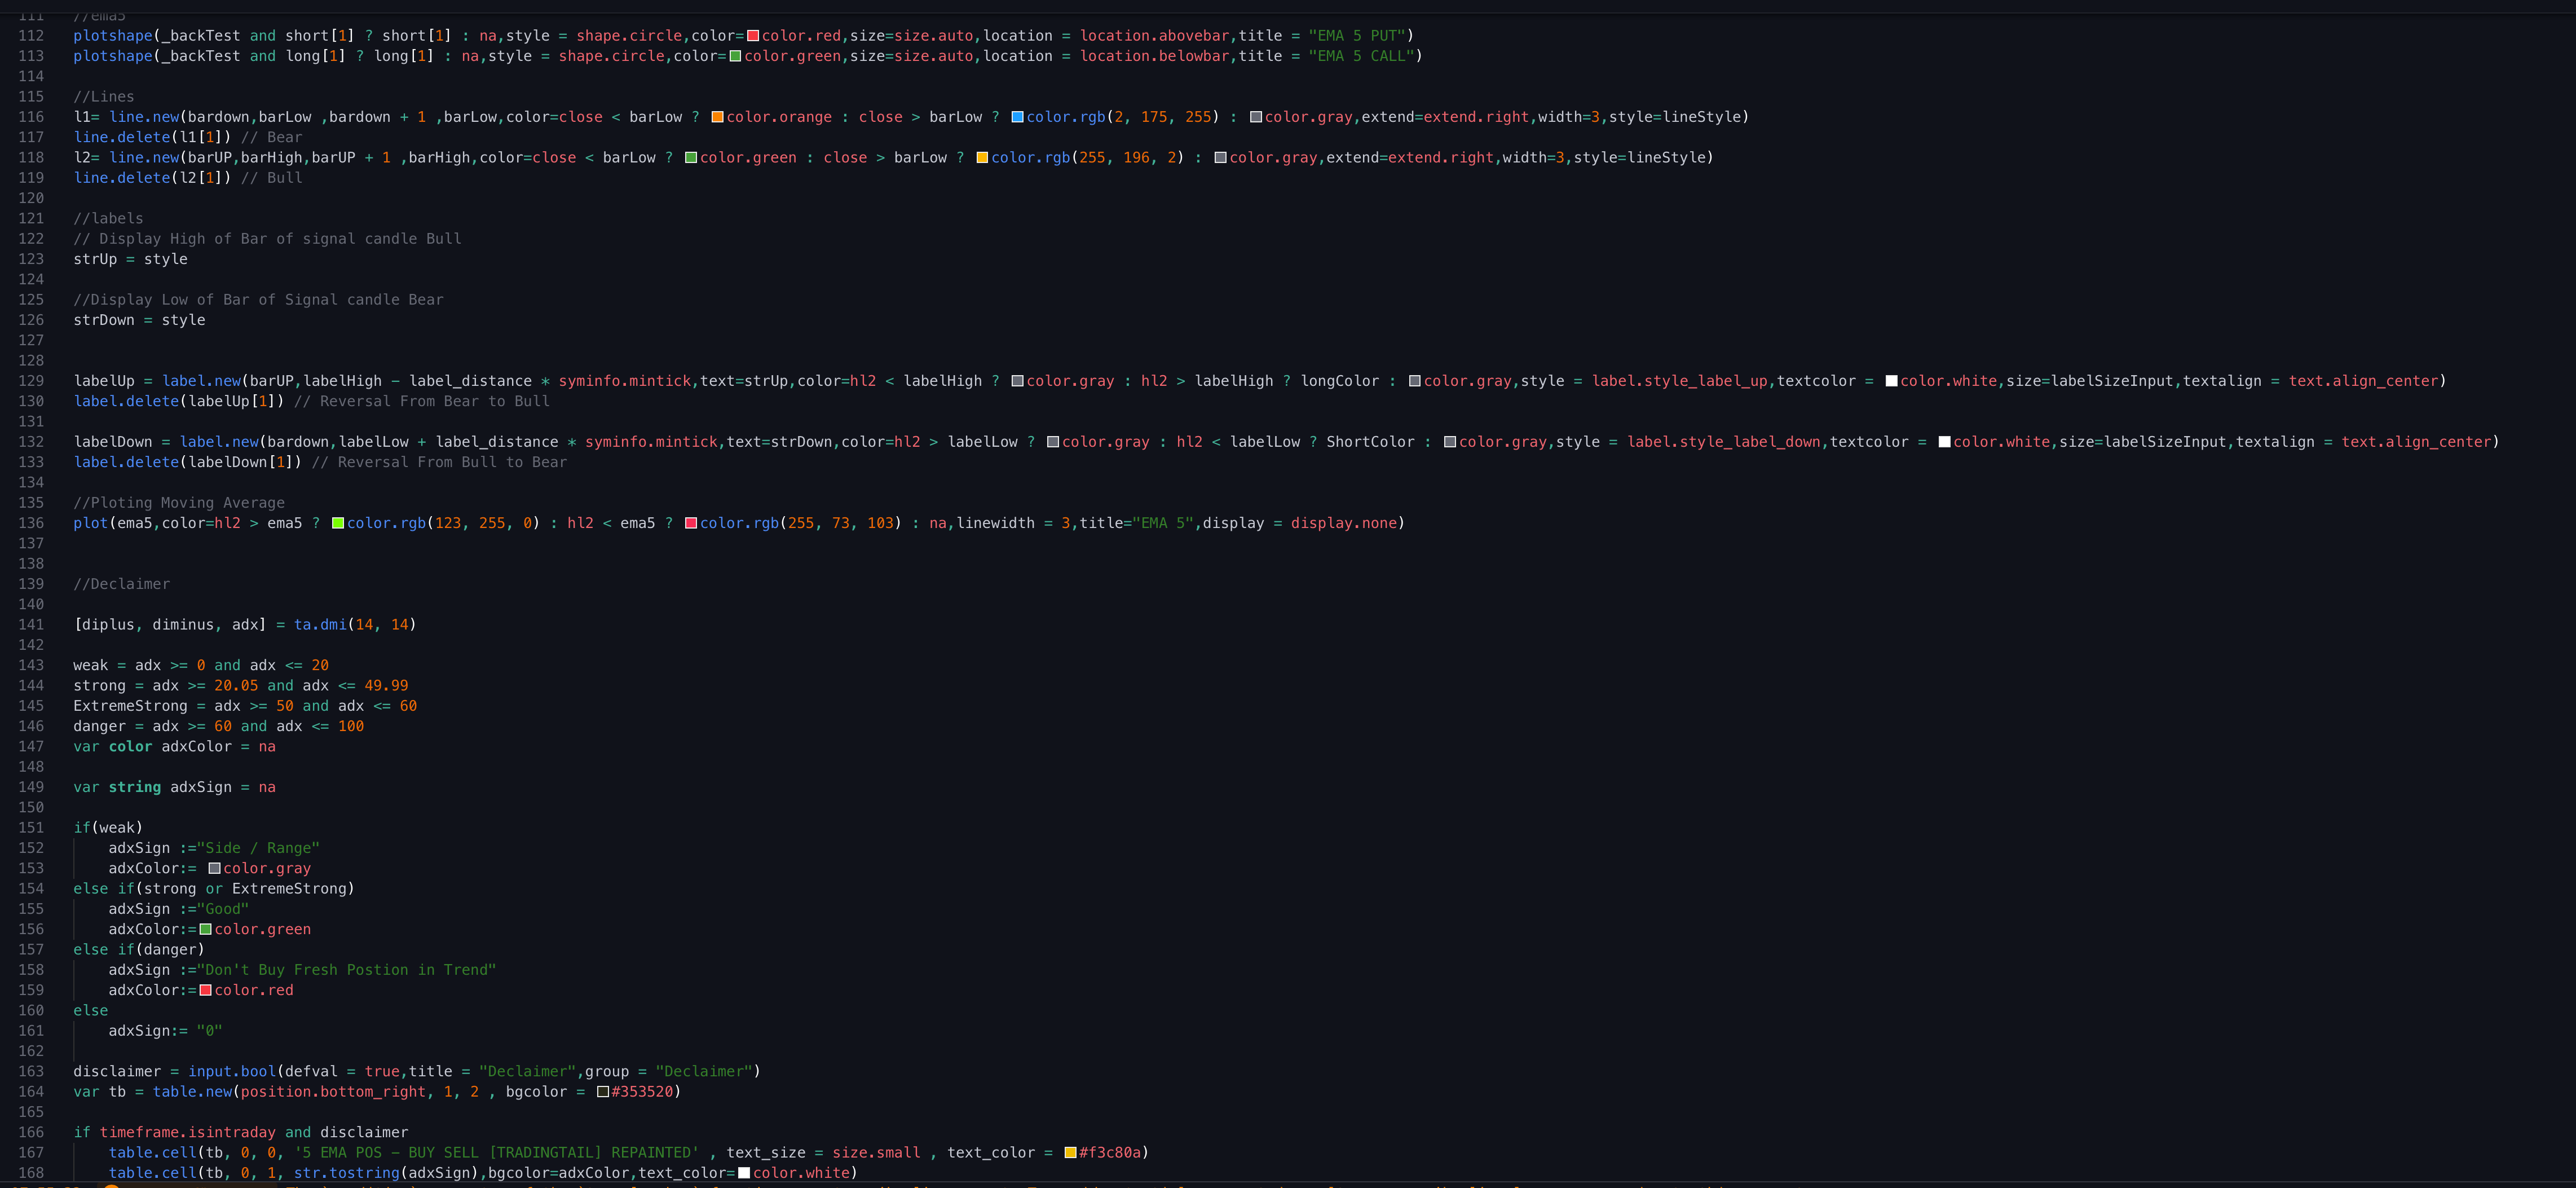
plotshape(_backTest and short[1] ? short[1] : na,style = shape.circle,color=color.red,size=size.auto,location = location.abovebar,title = "EMA 5 PUT")
plotshape(_backTest and long[1] ? long[1] : na,style = shape.circle,color=color.green,size=size.auto,location = location.belowbar,title = "EMA 5 CALL")
//Lines
l1= line.new(bardown,barLow ,bardown + 1 ,barLow,color=close < barLow ? color.orange : close > barLow ? color.rgb(2, 175, 255) : color.gray,extend=extend.right,width=3,style=lineStyle)
line.delete(l1[1]) // Bear
l2= line.new(barUP,barHigh,barUP + 1 ,barHigh,color=close < barLow ? color.green : close > barLow ? color.rgb(255, 196, 2) : color.gray,extend=extend.right,width=3,style=lineStyle)
line.delete(l2[1]) // Bull
//labels
// Display High of Bar of signal candle Bull
strUp = style
//Display Low of Bar of Signal candle Bear
strDown = style
labelUp = label.new(barUP,labelHigh - label_distance * syminfo.mintick,text=strUp,color=hl2 < labelHigh ? color.gray : hl2 > labelHigh ? longColor : color.gray,style = label.style_label_up,textcolor = color.white,size=labelSizeInput,textalign = text.align_center)
label.delete(labelUp[1]) // Reversal From Bear to Bull
labelDown = label.new(bardown,labelLow + label_distance * syminfo.mintick,text=strDown,color=hl2 > labelLow ? color.gray : hl2 < labelLow ? ShortColor : color.gray,style = label.style_label_down,textcolor = color.white,size=labelSizeInput,textalign = text.align_center)
label.delete(labelDown[1]) // Reversal From Bull to Bear
//Ploting Moving Average
plot(ema5,color=hl2 > ema5 ? color.rgb(123, 255, 0) : hl2 < ema5 ? color.rgb(255, 73, 103) : na,linewidth = 3,title="EMA 5",display = display.none)
//Declaimer
[diplus, diminus, adx] = ta.dmi(14, 14)
weak = adx >= 0 and adx <= 20
strong = adx >= 20.05 and adx <= 49.99
ExtremeStrong = adx >= 50 and adx <= 60
danger = adx >= 60 and adx <= 100
var color adxColor = na
var string adxSign = na
if(weak)
adxSign :="Side / Range"
adxColor:= color.gray
else if(strong or ExtremeStrong)
adxSign :="Good"
adxColor:=color.green
else if(danger)
adxSign :="Don't Buy Fresh Postion in Trend"
adxColor:=color.red
else
adxSign:= "0"
disclaimer = input.bool(defval = true,title = "Declaimer",group = "Declaimer")
var tb = table.new(position.bottom_right, 1, 2 , bgcolor = #353520)
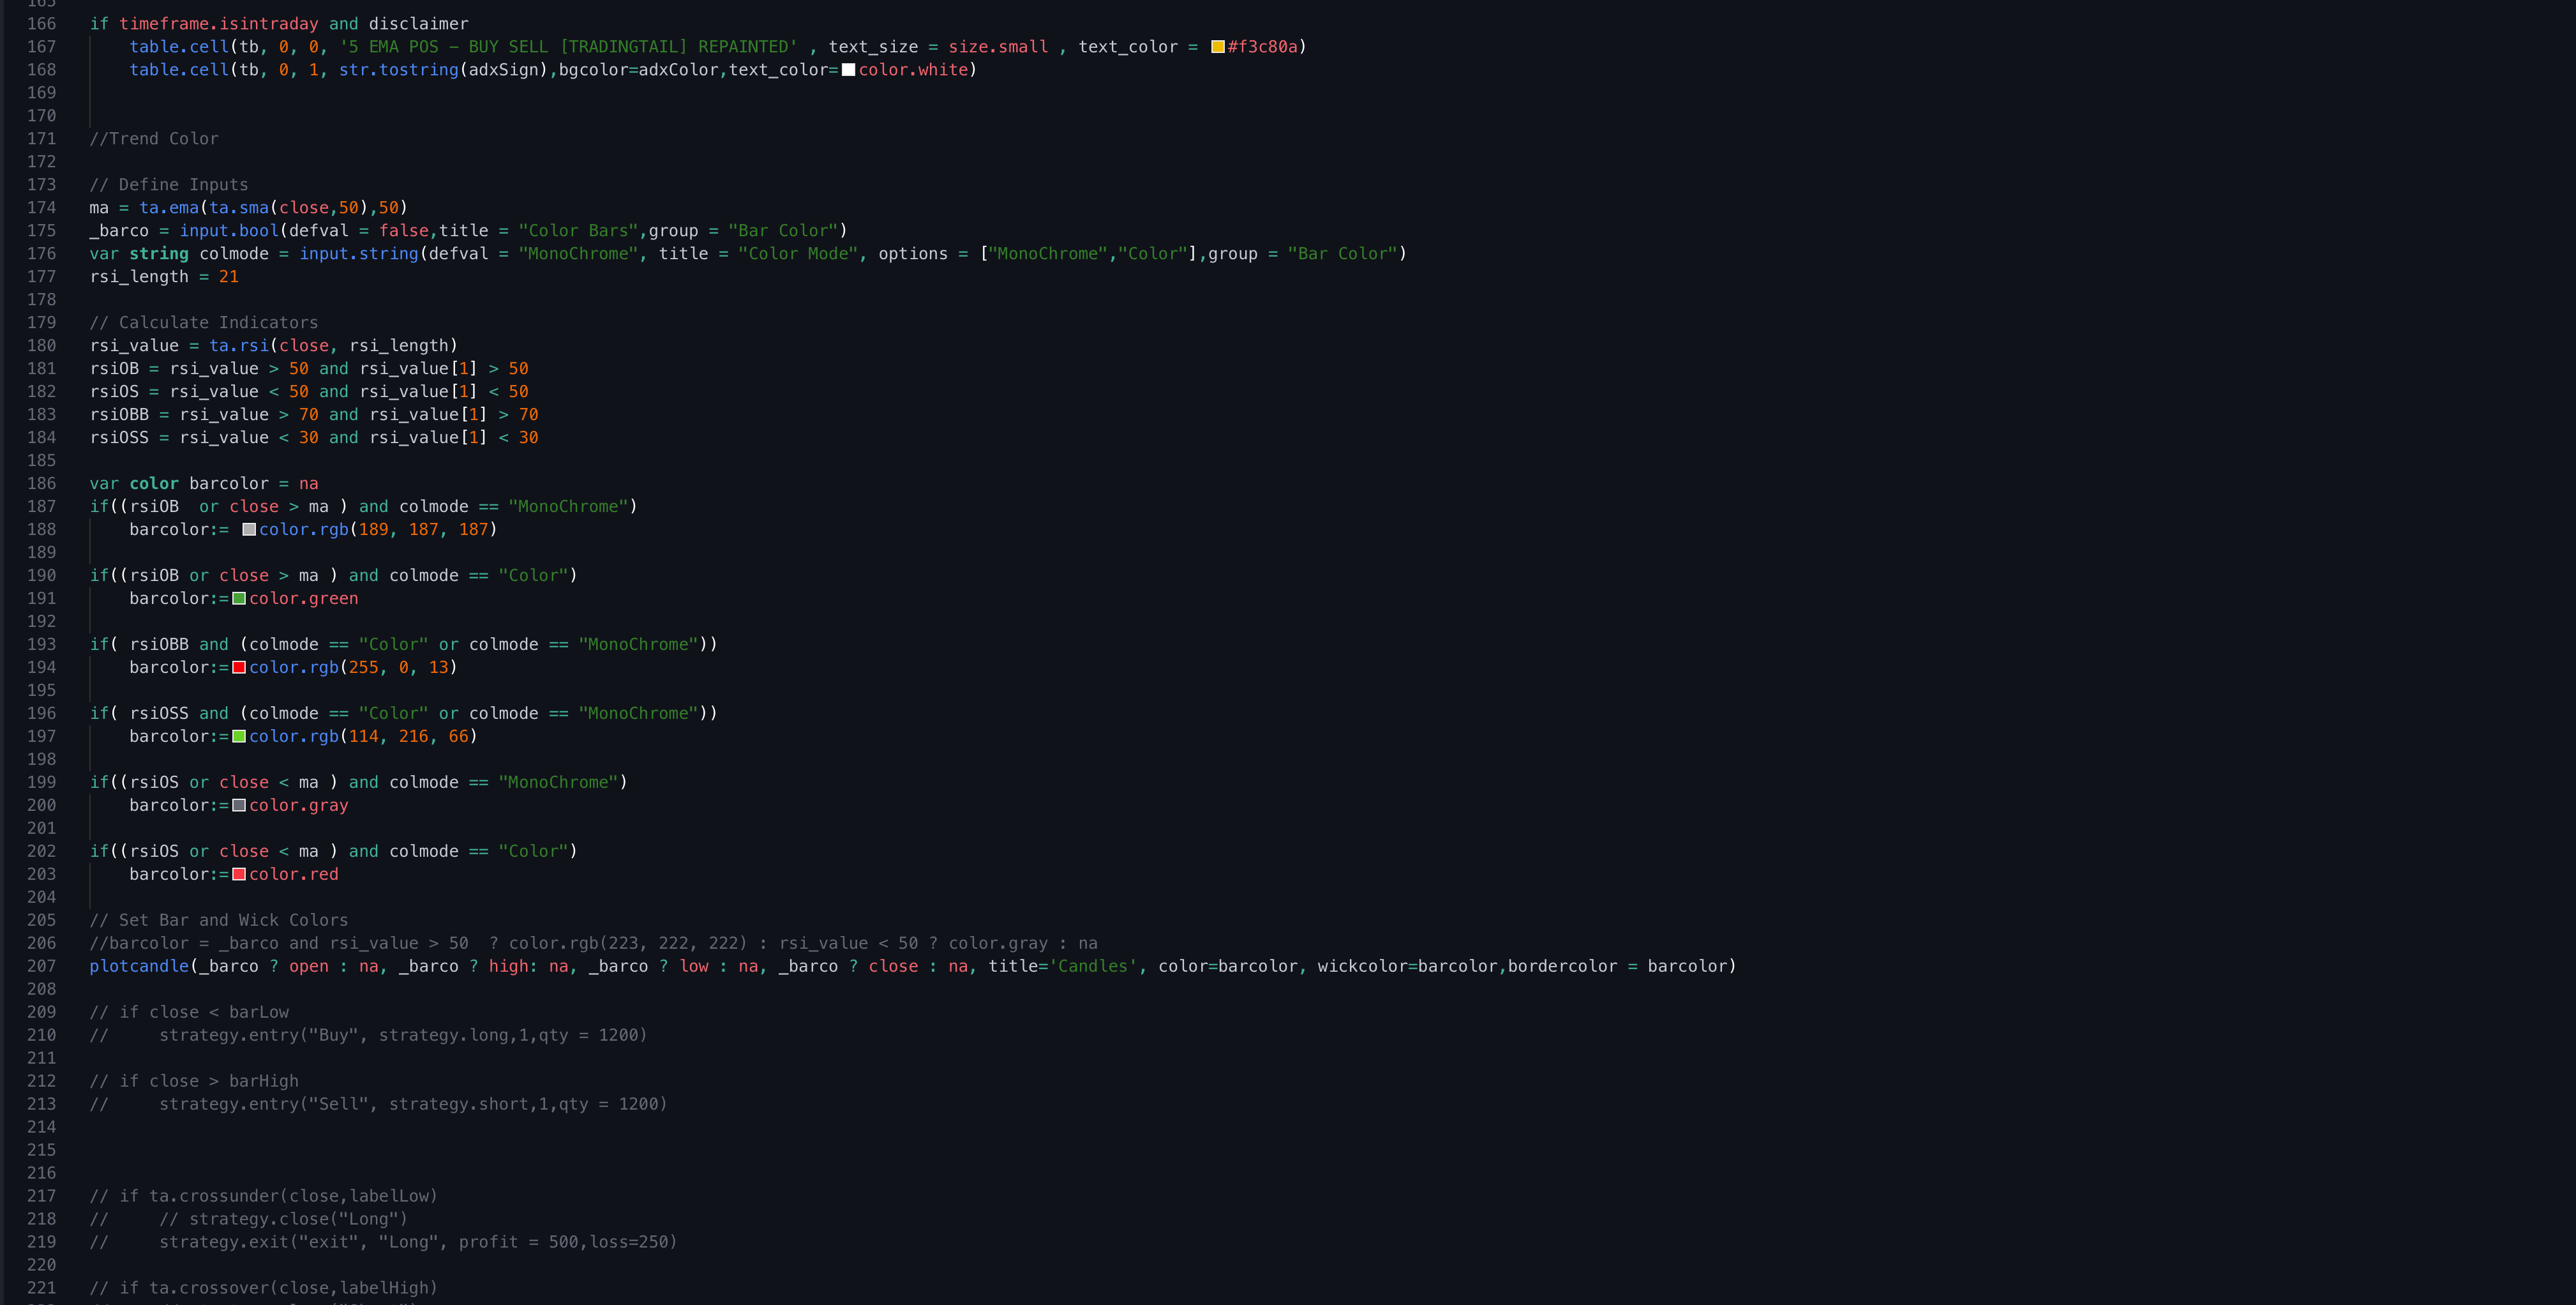
if timeframe.isintraday and disclaimer
table.cell(tb, 0, 0, '5 EMA POS - BUY SELL [TRADINGTAIL] REPAINTED' , text_size = size.small , text_color = #f3c80a)
table.cell(tb, 0, 1, str.tostring(adxSign),bgcolor=adxColor,text_color=color.white)
//Trend Color
// Define Inputs
ma = ta.ema(ta.sma(close,50),50)
_barco = input.bool(defval = false,title = "Color Bars",group = "Bar Color")
var string colmode = input.string(defval = "MonoChrome", title = "Color Mode", options = ["MonoChrome","Color"],group = "Bar Color")
rsi_length = 21
// Calculate Indicators
rsi_value = ta.rsi(close, rsi_length)
rsiOB = rsi_value > 50 and rsi_value[1] > 50
rsiOS = rsi_value < 50 and rsi_value[1] < 50
rsiOBB = rsi_value > 70 and rsi_value[1] > 70
rsiOSS = rsi_value < 30 and rsi_value[1] < 30
var color barcolor = na
if((rsiOB or close > ma ) and colmode == "MonoChrome")
barcolor:= color.rgb(189, 187, 187)
if((rsiOB or close > ma ) and colmode == "Color")
barcolor:=color.green
if( rsiOBB and (colmode == "Color" or colmode == "MonoChrome"))
barcolor:=color.rgb(255, 0, 13)
if( rsiOSS and (colmode == "Color" or colmode == "MonoChrome"))
barcolor:=color.rgb(114, 216, 66)
if((rsiOS or close < ma ) and colmode == "MonoChrome")
barcolor:=color.gray
if((rsiOS or close < ma ) and colmode == "Color")
barcolor:=color.red
// Set Bar and Wick Colors
//barcolor = _barco and rsi_value > 50 ? color.rgb(223, 222, 222) : rsi_value < 50 ? color.gray : na
plotcandle(_barco ? open : na, _barco ? high: na, _barco ? low : na, _barco ? close : na, title='Candles', color=barcolor, wickcolor=barcolor,bordercolor = barcolor)
// if close < barLow
// strategy.entry("Buy", strategy.long,1,qty = 1200)
// if close > barHigh
// strategy.entry("Sell", strategy.short,1,qty = 1200)
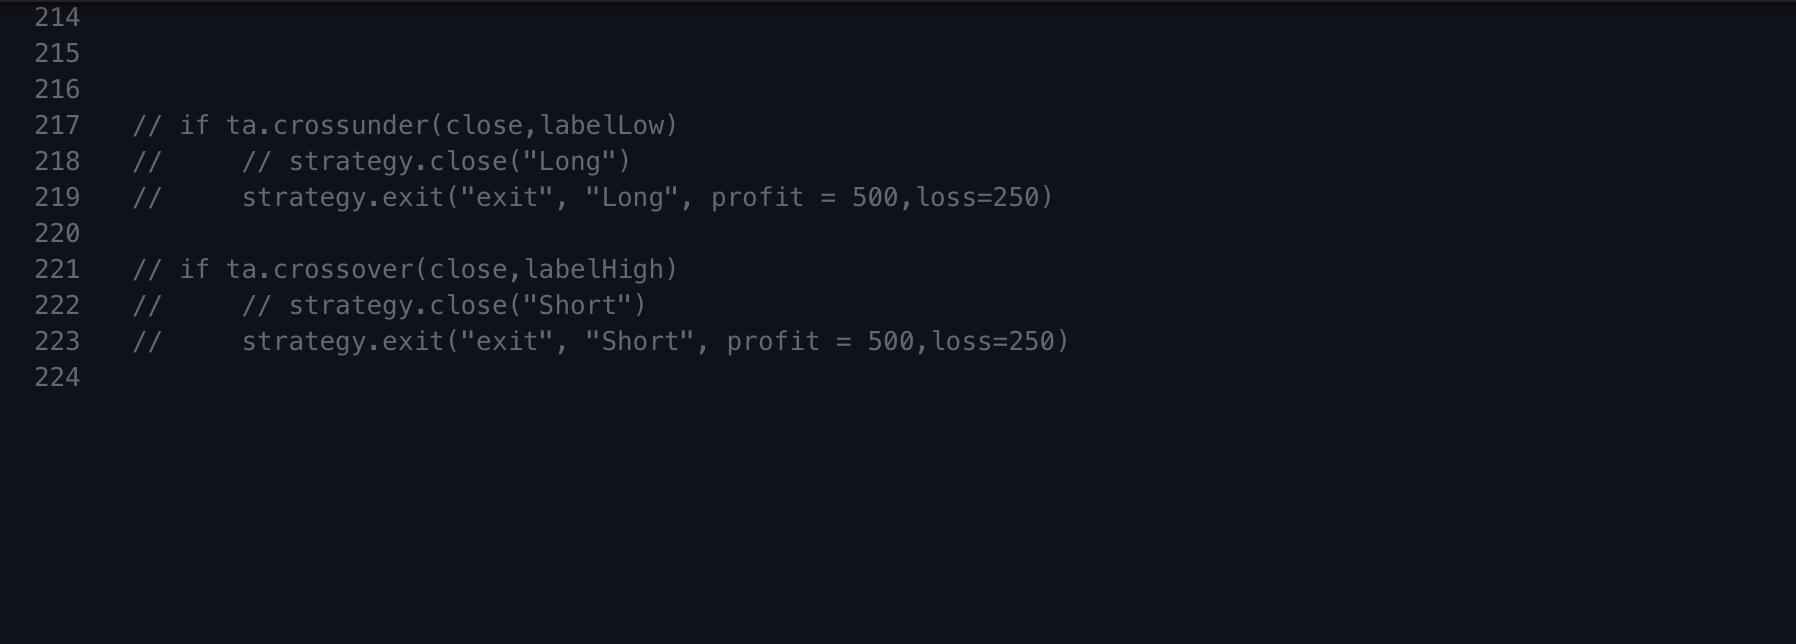
// if ta.crossunder(close,labelLow)
// // strategy.close("Long")
// strategy.exit("exit", "Long", profit = 500,loss=250)
// if ta.crossover(close,labelHigh)
// // strategy.close("Short")
// strategy.exit("exit", "Short", profit = 500,loss=250)