Pivot Lines Pro
- 指标
- Makarii Gubaydullin
- 版本: 1.0
- 激活: 10
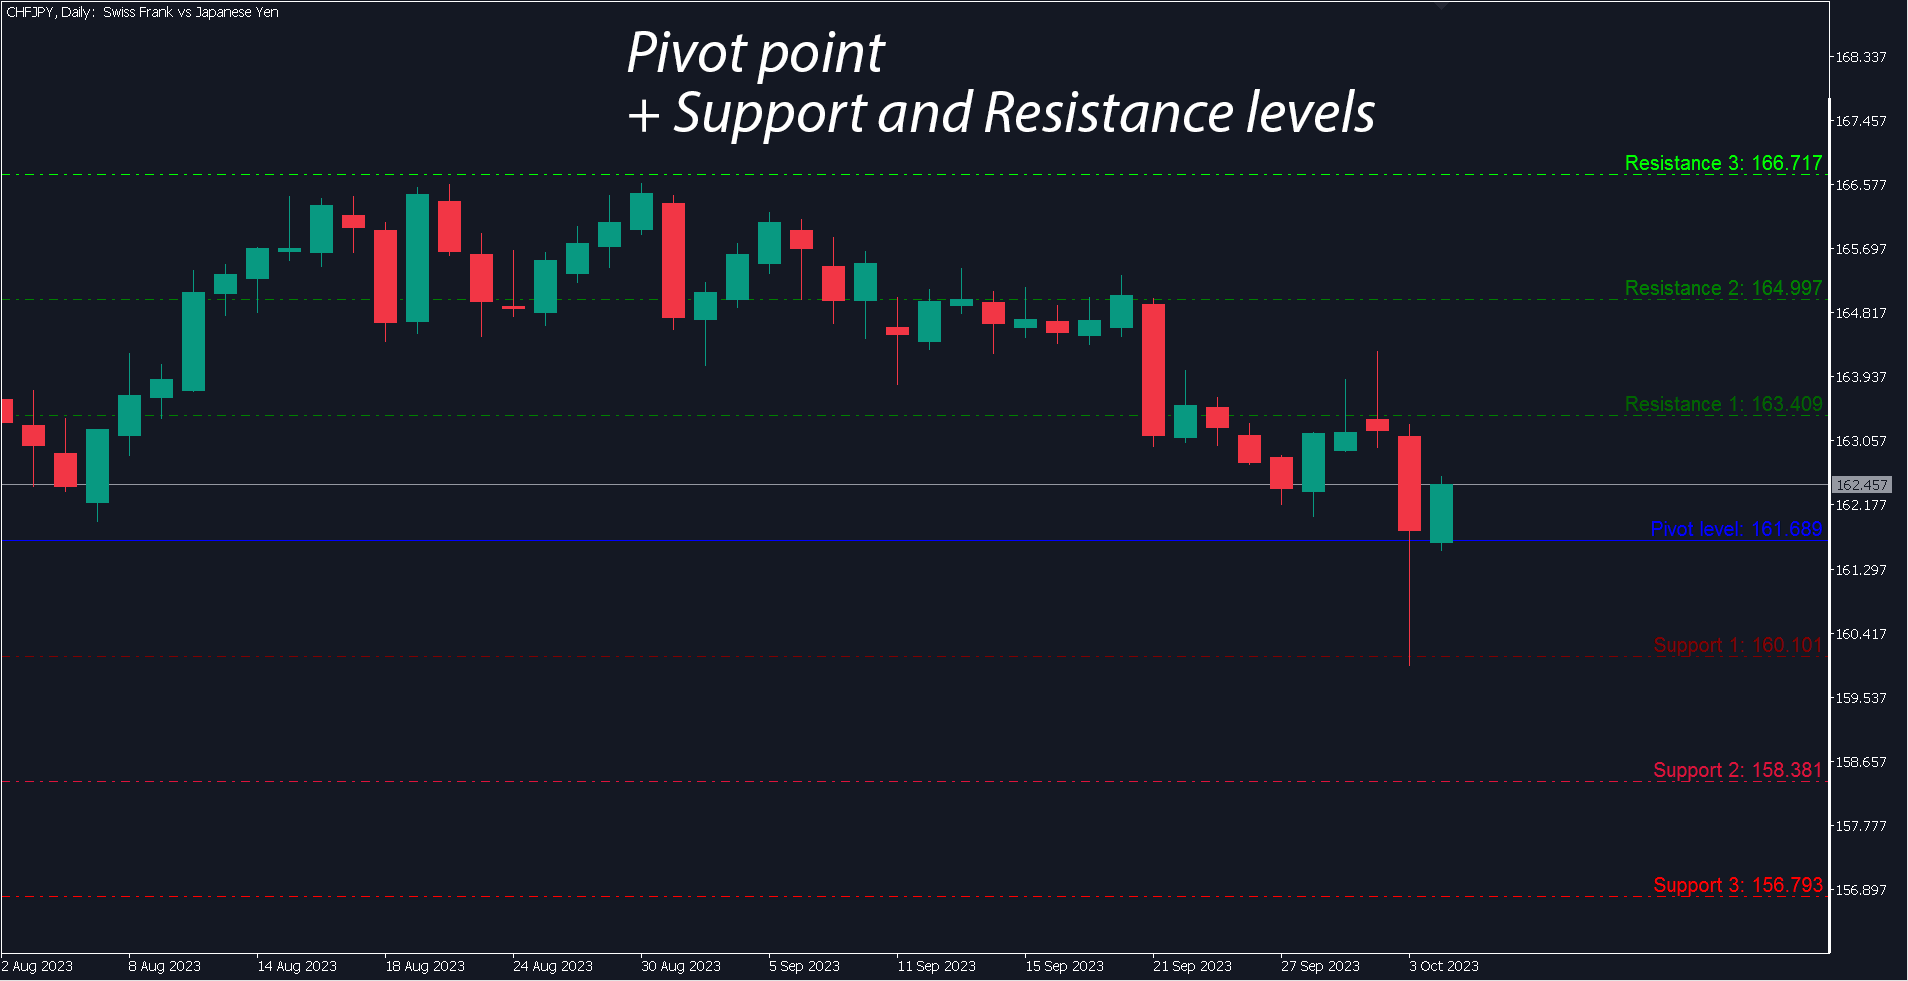
A Pivot point is used to determine the overall market trend.
The pivot level itself is the average of the high and low, and the closing price from the previous bar.
On the next bar trading above the pivot point is thought to indicate ongoing bullish sentiment, while trading below the pivot point indicates bearish sentiment.
The pivot point is the basis for the indicator, but it also includes other support and resistance levels that are projected based on the pivot point.
All these levels help you to see where the price can be rejected.
My #1 Utility: includes 65+ functions | Contact me if you have any questions | MT4 version
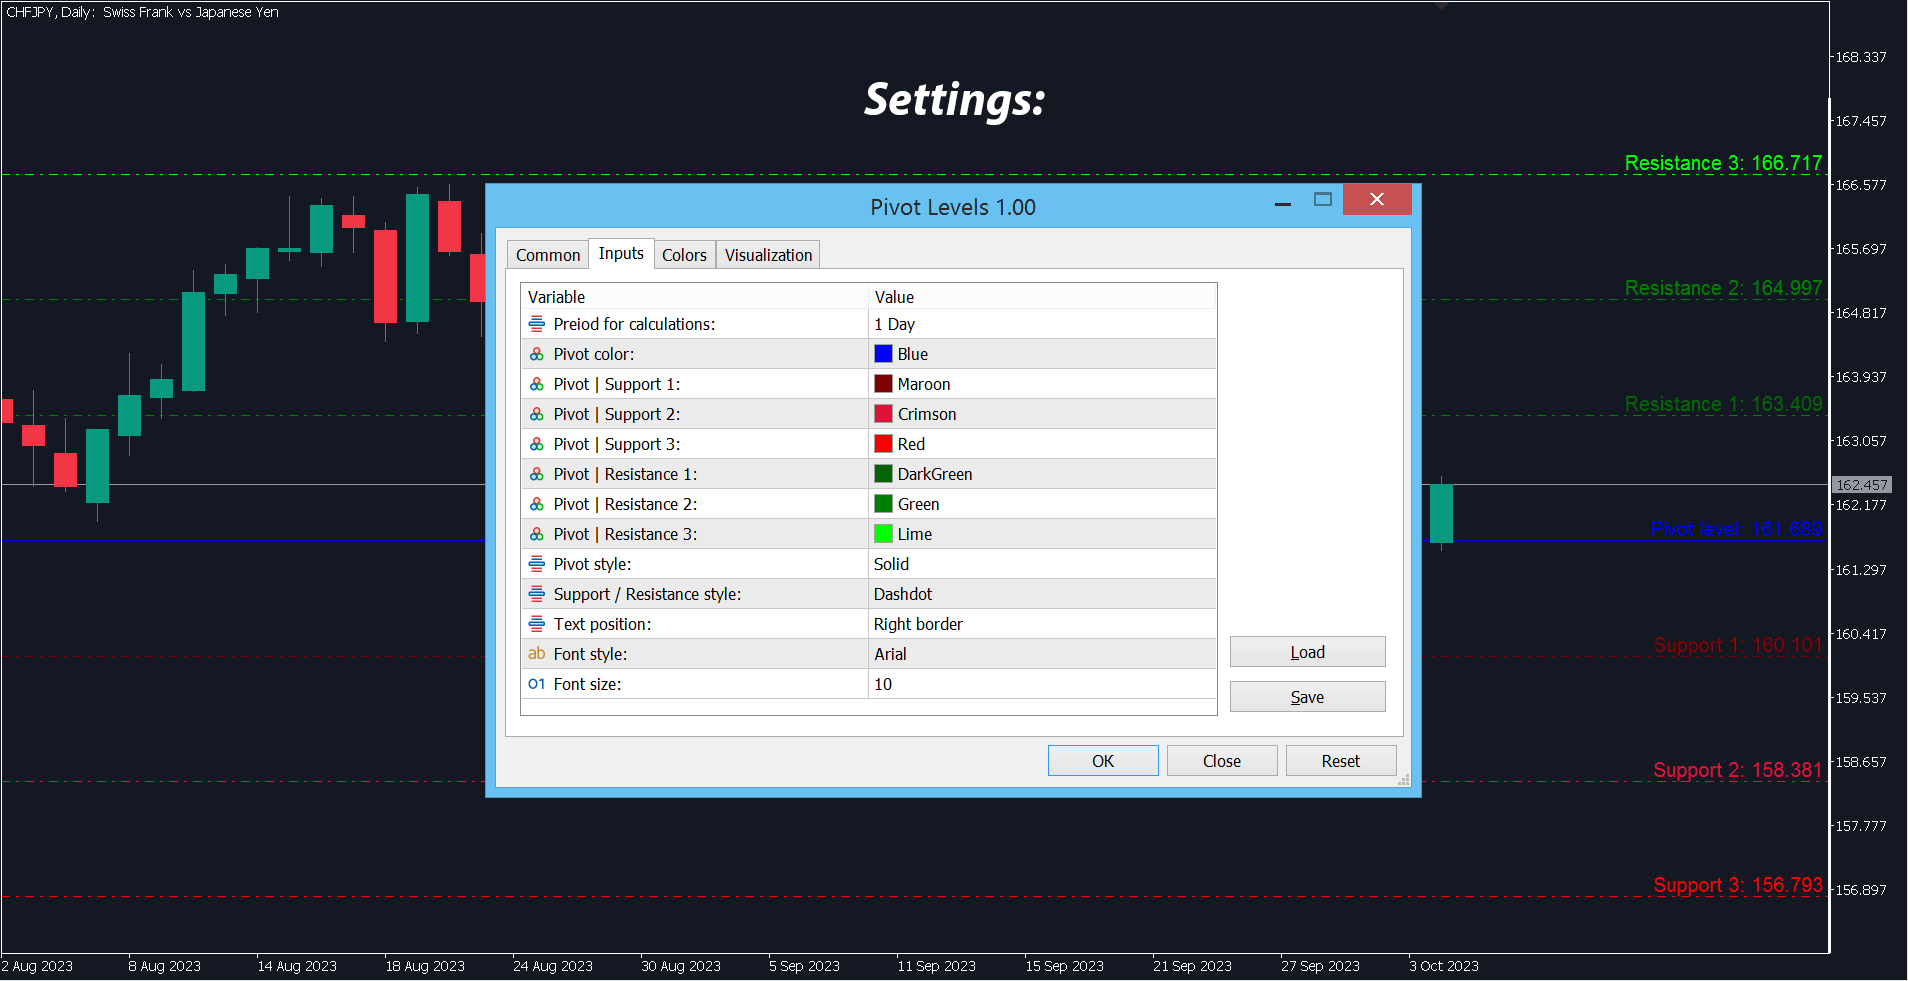
In the settings of the indicator, you can configure:
- Period to be used for calculations (the classical method involves calculation on a daily timeframe)
- Line colors and styles
- Text position
-
Font style and size
The program file must be placed in the "Indicators" directory.