• 概述
  • 评论
  • 评论

ADX and DMI applied to Heiken Ashi

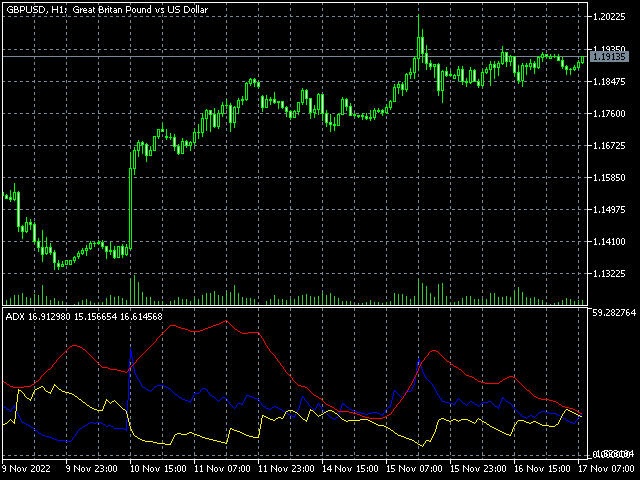
This is a two in one indicator implementation of Average Directional Index based on heiken ashi and normal candles.

Normal candles and Heiken Ashi is selectable via input tab. The other inputs are ADX smoothing and DI length.

This indicator lets you read the buffers:

+di: buffer 6

-di: buffer 7

-adx: buffer 10

Note: This is a non-repaint indicator with light load processing.

- You can message in private chat for further changes you need.


推荐产品
To download MT4 version please click here . - This is the exact conversion from TradingView: "Linear Regression Candles" By "ugurvu". - The overall look of the indicator is like Heiken Ashi. - It can be used as a trend confirmation indicator to detect the right trend direction. - This indicator lets you read the buffers for Candles' OHLC. - This is a non-repaint and light processing load indicator - You can message in private chat for further changes you need. Thanks
Market Performance
Kambiz Shahriarynasab
You can identify the strength of the main forex currencies with this tool. You can combine it with different styles and get the best strategy out of it. It has very high power. It can be customized. MT4 version This indicator will have many updates and special settings will be added to it. You can contact us via Instagram, Telegram, WhatsApp, email or here. We are ready to answer you.
KT Advance Ichimoku
KEENBASE SOFTWARE SOLUTIONS
KT Advance Ichimoku plot the arrows and provide alerts for the four trading strategies based on Ichimoku Kinko Hyo indicator. The generated signals can be filtered by other Ichimoku elements.  Four Strategies based on the Ichimoku Kinko Hyo 1.Tenkan-Kijun Cross Buy Arrow: When Tenkan-Sen cross above the Kijun-Sen. Sell Arrow: When Tenkan-Sen cross below the Kijun-Sen. 2.Kumo Cloud Breakout Buy Arrow: When price close above the Kumo cloud.  Sell Arrow: When price close below the Kumo cloud.
To get access to MT4 version click here . This is the exact conversion from "Nadaraya-Watson Envelope" by " LuxAlgo ". (with non-repaint input option) This is not a light-load processing indicator if repaint input is set to true . All input options are available.  Buffers are available for processing in EAs. I changed default input setup to non-repaint mode for better performance required for mql market validation procedure . Here is the source code of a simple Expert Advisor operating based on
RubdFx Perfect Reversal , The reversal indicator is used to determine areas of support and resistance by Drawing an arrow with a level of supply and demand ( ReversalZones ). - You will catch more swings by reducing the period, and less swings if you increase period - Mobile, computer and email alerts available . it is not pushed by price which means the arrow will stay in one place,suitable for scalping and long term trading  Also Compatible with all forex paris , BUY RULES;  open a buy positio
To download the MT4 version of Donchian Candles please click   here . You may also check this link . This is inspired by TradingView: "Donchian Trend Ribbon" By "LonesomeTheBlue". This indicator merges Ribbon data into   chart   Candles. The result is one of the coolest indicators out there to detect trend direction and strength. As a trader you always need such indicator to avoid getting chopped in range markets. - You can message in private chat for further changes you need. The indicator is l
The rubdfx divergence indicator is a technical analysis tool that compares a security's price movement. It is used to identify potential changes in the price trend of a security. The indicator can be applied to any type of chart, including bar charts and candlestick charts. The algorithm is based on MACD, which has been modified to detect multiple positive and negative divergences. Settings  ___settings___ * fastEMA * slowEMA * signalSMA *Alerts:   True/False     #Indicator Usage B
The chaos wave
Letlhogo Mokgatle
This is the best indicator we have created by far, this indicator replicates the well known heiken ashi indicator,  but with a more precise entry point, this indicator can work on all time-frames and is strong on all the time frames , this indicator does not repaint nor does it lag , this indicator strategy combined with price action will change your trading experience , elevate your experience to the next level.
This indicator closes the positions when Profit. This way you can achieve a goal without determine Take Profit.  Parameters: Profit: the amount of Dolllars you want to close when profit.  Just determine Profit section and open new positions. If Any of your positions reaches above Profit , Indicator will close automatically and you will recieve your Profit. 
Contact me for instruction, any questions! Introduction The breakout and retest strategy is traded support and resistance levels. it involves price breaking through a previous level.  The break and retest strategy is designed to help traders do two main things, the first is to avoid false breakouts. Many false breakouts start with a candlestick that breaks out of a level but ends with an immediate candlestick that brings the price back into the level. The second thing that the breakout and re
RoboTick Signal
Mahir Okan Ortakoy
Hello, In this indicator, I started with a simple moving average crossover algorithm. However, in order ot get more succesfull results, I created different scenarios by basin the intersections and aptimized values of the moving averages on opening, closing, high and low values. I am presenting you with the most stable version of the moving averages that you have probably seen in any environment. We added a bit of volume into it. In my opinion, adding the Bollinger Band indicator from the ready-
TradingwievHeikenAshi
Volkan Mustafaoglu
Heikin Ashi Heikin Ashi is a charting technique that can be used to predict future price movements. It is similar to traditional candlestick charts. However, unlike a regular candlestick chart, the Heikin Ashi chart attempts to filter out some of the market noise by smoothing out strong price swings to better identify trend movements in the market. To create Heiken Ashi, a formula is used in which price data is entered, while ordinary candles are built only on bare numbers, without using any
The indicator monitors the Dinapoli MACD trend in multiple timeframes for the all markets filtered and shows the results on Dashboard. Key Features Indicator can be used for all markets Monitors every timeframe, from 1 Min to Monthly Parameters UseMarketWatch: Set true to copy all symbols available in market watch MarketWatchCount : Set the number of symbols that you want to copy from the market watch list. CustomSymbols: Enter the custom symbols that you want to be available in dashboard.
KT Price Border MT5
KEENBASE SOFTWARE SOLUTIONS
KT Price Border creates a three-band price envelope that identifies potential swing high and low areas in the market. These levels can also be used as dynamic market support and resistance. The mid-band can also be used to identify the trend direction. As a result, it also functions as a trend-following indicator. In addition, its ease of use and more straightforward conveyance of trade signals significantly benefit new traders. Features It works well on most of the Forex currency pairs. It
WT Vwap Bands
Ricardo Almeida Branco
The WT Vwap Bands indicator is an indicator that combines price and volume, helping to show whether the price is within the "fair price", overbought or oversold. The indicator code was designed for performance and has already been tested in a real trading account. In addition to the visual inputs (color, thickness and line style), the user can define a% value that depends on the price. The default values work with the most distant band at 1% of the price and then dividing this distan
Patternist
Ziya Gurkan Badem
* Corrected and accelerated zigzag. (You can change the range) * The zigzag is updated with each new candle/bar. * If you want, by activating the button, only when you click the button, it searches for a pattern. If you do it automatically, it searches every time the chart is refreshed. * 17 frequently used harmonic patterns and a special pattern that you can define your own proportions. * You can keep the chart simple with the price display. You can make a triangle representation if you want. *
SuperTrendCCI
Volkan Mustafaoglu
The best quality application of the famous Super Trend indicator that requires no introduction. It is completely faithful to the original algorithm and powered by the CCI indicator. - easy to trade - It implements all kinds of warnings. - It implements a multi-timezone dashboard. - It cannot be repainted or backpainted. Input parameters - ATR Period – This is the average true range period. - ATR Multiplier - The ATR multiplier that defines the trend. - CCI - Makes trend following powerful. -
The indicator scans for Dinapoli thrust pattern in multiple timeframes for a specific market. Key Features Indicator can be used for all markets It can scan for thrust pattern on W1, D1, H4, H1, M30, M15 and M5 timeframes Ability to choose number of bars required above/below displaced moving average to define thrust Able to move display label on chart by single click Parameters Minimum Bars: Least amount of bars to account for Thrust DMA Period: Moving average period DMA Shift: Number or bars re
Scanner and Dashboard for Money Flow Index MT5 The Money Flow Index (MFI) is a technical oscillator that uses price and volume data for identifying overbought or oversold signals in an asset. It can also be used to spot divergences which warn of a trend change in price. The oscillator moves between 0 and 100. Advantages of the Scanner: - Full Alert Options. - Multi Timefrare  - Works for all instruments including Currencies, Indices, Commodities, Cryptocurrencies and Stocks. - Fully customisab
Market Steps MT5
Mahdi Ebrahimzadeh
市场步骤指标是基于江恩时间/价格相关性设计和建立的,并通过外汇市场的价格行动特定规则进行优化。它使用市场订单流的概念来预测潜在的高订单量的价格区域。 指标水平可用于交易本身,或作为一个组合来过滤其他策略/指标的错误信号。每个交易者都需要这样一个强大的工具,在图表上拥有多时间框架(TF)区域和价格运动的潜力。你可以在测试器模式下测试它的力量,看看它的水平如何支配图表上的价格。 指标的优势。 用两个不同的区域来标示图表,为不同的TFs指定趋势和范围市场。 价格行动交易者可以使用它来识别不同TFs/价格区的订单流,或验证FTR(失败返回)/FTC(失败继续)。 市场的波动区和流动区将出现在图表上,以便于未来的价格变动。 通过该指标,可以很容易地决定SL/TP、追踪、平衡和利润保存。 价格反转或延续可以很容易地被验证。 该指标的水平可以作为马丁格尔或网格水平使用,概率更高。
There are many linear regression indicators out there, most of them draw lines or channels, but this one actually draws a chart. The beauty of the indicator like Heiken Ashi is it removes a lot of market noise. 4 (OHLC) arrays are filled with Linear Regression(LR) values of each price for the LR period (default=14). The period of the Linear Regression is adjustable dependant on the market conditions. The SMA (default=14) also has period adjustment. Candles are generated with Green for 'Up' cand
Stormer RSI 2
Ricardo Rodrigues Lucca
This strategy was learned from Stormer to be used on B3. Basically, 15 minutes before closing the market, it will check RSI and decided if it will open an position. This strategy do not define a stop loss. If the take profit reach the entry price it will close at market the position. The same happens if the maximal number of days is reached. It is created to brazilian people, so all configuration are in portuguese. Sorry Activations allowed have been set to 50.
The indicator scans for TD Combo signals in multiple timeframes for the all markets filtered and shows the results on Dashboard. Key Features Dashboard can be used for all markets It can scan for signals on MN1, W1, D1, H4, H1, M30, M15 ,M5, M1 timeframes Parameters UseMarketWatch: Set true to copy all symbols available in market watch MarketWatchCount : Set the number of symbols that you want to copy from the market watch list. CustomSymbols: Enter the custom symbols that you want to be availa
Market Session Pro
Kambiz Shahriarynasab
The  Market Sessions Indicator for MT5 helps you  predict market turnarounds  by detecting major supply and demand areas. These pivot points tend to occur after a new session has started and the previous one is still open. It is also used to gauge how many points or pips the market moves on average during a session. This helps us to place better our take profits and stop losses. The indicator works on all forex pairs, gold, silver, commodities, stocks, indices and any other instrument that your
The Tree
Mr Navee Koonlert
This is EA optimizer for EURUSD Currency at M30 timeframe. The EA use Simple MA & Paraboric SAR for find Spot to open order. and usd ichimoku kinko hyo & Momentum For Confirm the trend of Price. This EA don't use  martingale method. Recommendations:  Currency pair: EURUSD Timeframe: M30 Minimum deposit : $100 Account type: Any Use low spread forex brokers Input Setting: every 500 USD use 0.2 Lot
The indicator determines a special pattern of Joe Dinapoli. It gives very high probability buy and sell signals. Indicator does not repaint. Indicator Usage Buy Signal ''B'' Entry : Market buy order at signal bar close Stop : Low of signal bar Take Profit : First swing high Sell Signal ''S'' Entry : Market sell order at signal bar close Stop : High of signal bar Take Profit : First swing low Indicator Parameters Fast EMA : External Parameter (should be kept as default) Slow EMA: External Param
Average Cross System
Muhammed Emin Ugur
The Average Cross System indicator is a versatile tool designed for traders using the MetaTrader 4 (MT4) platform. This indicator provides a straightforward yet effective way to identify potential buy and sell signals based on moving average crossovers, a widely used technical analysis strategy. Key Features: Moving Average Crossovers: The heart of the Average Cross System is the detection of moving average crossovers. It automatically identifies when a shorter-term moving average crosses above
FREE
Pick and Roll
Marta Gonzalez
Pick and Roll   it is a Secure Automated Software for trade 28 pairs ​​simultaneously. P ick and Roll It is optimized for 28 pairs of forex market Pick and Roll  system operation: 1: PREVIOUS   TREND 2: CONSOLIDATION 3:   RUPTURE D o not use this robot at the same time as others, it is a multi-value robot, therefore it manages 28 pairs simultaneously. The architecture is a Fully Automatic Autonomous Robot Expert capable of independently analyzing the market and making trading decisions   
AI Moving Average
Polyware Yazilim Hizmetleri Limited Sirketi
Добро пожаловать в новую эпоху торговли с индикатором AI Moving Average, передовым индикатором MetaTrader 5, разработанным для предоставления трейдерам предсказательной информации о движениях рынка. Этот инструмент сочетает в себе мощь ИИ с надежностью экспоненциального скользящего среднего без запаздывания для точных и своевременных прогнозов будущих ценовых тенденций. Инновационная модель линейной регрессии Индикатор AI Moving Average использует модель машинного обучения линейной регрессии для
FREE
Market Noise 市場噪音是確定價格圖表上的市場階段的指標,並且還可以在累積或派發階段發生時區分清晰平滑的趨勢運動和嘈雜的平坦運動。 每個階段都適合自己的交易類型:趨勢適合趨勢追蹤系統,平坦適合激進型交易。 當市場噪音開始時,您可以決定退出交易。 同樣,反之亦然,一旦噪音結束,您就需要關閉激進的交易系統。 有人可以使用兩種類型的交易策略進行交易,從一種策略切換到另一種策略。 因此,該指標在交易決策領域中扮演了好助手的角色。 任何價格變動都可以分為兩個部分 - 選定時間段內的總體價格變動以及該時間段內以價格波動形式出現的噪音。 同時,不同時期的不同市場可以表現出噪音和趨勢成分之間廣泛的相互關係(圖1)。 價格變動的噪音水平越高,辨別潛在趨勢的方向和強度就越困難。 因此,在這種情況下有必要使用較慢的趨勢識別方法。 另一方面,在低噪音水平的市場中,主要趨勢很容易確定,並且更快的確定趨勢的方法是合理的,確保價格方向變化的交易訊號的滯後最小。 為了確定市場狀態,使用高級效率比 (ER),該比率基於特定時期內總價格變動與噪音市場變動總和的指數比較。效率比 (ER) 可以變化從0到1。
该产品的买家也购买
TPSpro RFI Levels MT5
Roman Podpora
4.73 (11)
指示       俄罗斯 -        英语   建议 与指示器一起使用     -       TPSpro 趋势专业版 -   MT4版本       交易中的一个关键要素是做出买卖交易工具决定的区域或水平。尽管主要参与者试图隐藏他们在市场中的存在,但他们不可避免地会留下痕迹。我们的任务是学习如何识别这些痕迹并正确解释它们。 主要功能: 向卖家和买家显示活跃区域! 该指标显示所有正确的初始买入和卖出脉冲水平/区域。激活这些水平/区域后,开始寻找切入点,水平会改变颜色并填充特定阴影。此外,还会显示箭头,以便更直观地了解情况。 显示更高时间范围内的级别/区域(MTF 模式) 添加了使用更高时间间隔显示级别/区域的功能。此外,该指标还具有自动趋势检测功能(   TPSproTREND PRO   )。 用于交易的单独专业的逐步算法。 该算法专为日内交易而设计,既可顺势交易,也可逆势交易。每个活动模板均提供详细说明。 适用于多种时间范围 。 TPSpro RFI 水平指标可用于图表上的任何时间范围,从一分钟(M1)开始一直到每月(MN)。 图形和声音警报。 该指标提供图形和声音指示
首先,值得强调的是,这个交易系统是一个非重绘、非重画和非滞后的指标,这使得它非常适合手动和机器人交易。 在线课程,手册和下载预设。 “智能趋势交易系统 MT5”是专为新手和经验丰富的交易者量身定制的综合交易解决方案。它结合了超过 10 个优质指标,具有 7 多个强大的交易策略,使其成为适用于各种市场条件的多功能选择。 趋势跟随策略:提供精确的入场和止损管理,以有效地跟随趋势。 反转策略:识别潜在的趋势反转,使交易者能够利用区域市场的机会。 剃头策略:专为快速准确的日内交易和短期交易而设计。 稳定性:所有指标都不会重绘、不会重画和不会滞后,确保可靠的信号。 定制:支持自定义策略,以满足个人交易偏好。超过 7 种策略和组合可帮助您找到最佳策略。 信号清晰度:提供箭头信号,以指示清晰的入场和退出点。 实时警报:通过交易进出警报使交易者保持了解。 深入分析:提供更高时间框架的趋势分析和实时交易监控。 自适应颜色编码:利用蜡烛颜色编码来显示成交量、趋势和反转蜡烛信号。通过蜡烛颜色分析市场方向。 “智能趋势交易系统 MT5”赋予交易者必要的工具,以便在各种市场条件下做出明智和战略性的交易决策。无论
Atomic Analyst MT5
Issam Kassas
4.42 (19)
首先值得强调的是,该交易指标是非重绘、非延迟的指标,这使其成为手动和机器人交易的理想选择。 用户手册:设置、输入和策略。 Atomic Analyst是一种PA价格行动指标,利用价格的力量和动量来寻找市场上更好的机会。配备了高级过滤器,可帮助去除噪音和假信号,并提高交易潜力。使用多层复杂的指标,Atomic Analyst扫描图表,并将复杂的数学计算转化为任何初学者都能理解并用来做出一致交易决策的简单信号和颜色。 “Atomic Analyst”是专为新手和经验丰富的交易者量身定制的综合交易解决方案。它将高级指标和一流功能融合为一体的交易策略,使其成为所有类型交易者的多功能选择。 日内交易和剥头皮策略:专为快速准确的日内交易和短期交易而设计。 日内和摆动交易策略:可用作追求价格大幅波动的日内和摆动交易者的可靠工具。 多货币和市场:凭借其可靠的精度,在不同的工具和市场上运作。 多个时间框架:可在多个时间框架上使用,性能良好。 稳定性:所有指标均不重绘、不重绘和不滞后,确保可靠的信号。 信号清晰度:提供箭头信号,用于清晰的入场和出场点。 实时警报:通过交易入场、SL和TP警报通知交
Trend Screener Pro MT5
STE S.S.COMPANY
4.87 (63)
使用趋势筛选指标释放趋势交易的力量:由模糊逻辑和多货币系统提供支持的终极趋势交易解决方案! 使用趋势筛选器(由模糊逻辑提供支持的革命性趋势指标)提升您的趋势交易。 它是一个强大的趋势跟踪指标,结合了超过 13 种高级工具和功能以及 3 种交易策略,使其成为使您的 Metatrader 成为趋势分析器的多功能选择。 限时优惠:趋势筛选指标终身仅需 50 美元。 ( 原价 250$ ) (优惠延长) 体验趋势筛选器 100% 无需重新绘制的准确性,确保您的交易决策不受过去价格变化的影响。 释放多时间框架和多货币功能的多功能性,使您能够以无与伦比的信心在外汇、商品、加密货币和指数领域进行交易。 利用 Trend Screener 的综合策略套件增强您的交易: - 趋势跟踪策略和趋势延续策略 :趋势筛选器的趋势跟踪策略提供清晰的趋势延续信号,让您有效捕捉趋势走势并管理风险。 - 反转策略和早期入场点策略 :趋势筛选器的反转策略可检测市场方向的潜在变化,使您能够预测趋势反转并利用疲弱的市场趋势。通过早期入场点,您可以在潜在的趋势变化之前定位自己 获取可观的利润。 - 倒卖策略: 趋势筛选器的倒卖
首先,值得强调的是,这个交易工具是非重绘、非重画和非滞后的指标,非常适合专业交易。 在线课程,用户手册和演示。 智能价格行动概念指标是一个非常强大的工具,既适用于新手,也适用于经验丰富的交易者。它将超过20个有用的指标合并到一个指标中,结合了高级交易思想,如内圈交易员分析和智能资金概念交易策略。该指标侧重于智能资金概念,提供有关大型机构交易方式的见解,帮助预测它们的动向。 它在流动性分析方面尤其擅长,有助于理解机构的交易方式。它擅长预测市场趋势,并仔细分析价格波动。通过将您的交易与机构策略对齐,您可以更准确地预测市场走向。该指标多才多艺,擅长分析市场结构,识别重要的订单区块,并识别各种模式。 它擅长识别BOS和CHoCH等模式,理解动量的转变,并突出显示供需强劲的关键区域。它还擅长发现强大的不平衡,并分析价格创造更高高点或更低低点的模式。如果您使用斐波那契回撤工具,该指标可以满足您的需求。它还可以识别相等的高点和低点,分析不同的时间框架,并通过仪表板显示数据。 对于使用更高级策略的交易者,该指标提供了工具,如公平价值差指标和优惠和折扣区域的识别。它特别关注高时间框架订单
Quantum Trend Sniper
Bogdan Ion Puscasu
4.8 (49)
介绍   量子趋势狙击指标 ,突破性的 MQL5 指标,正在改变您识别和交易趋势反转的方式!由拥有超过13年交易经验的资深交易员团队开发,     量子趋势狙击指标   旨在通过其创新的方式以极高的准确度识别趋势反转,将您的交易之旅推向新的高度。 ***购买量子趋势狙击指标,即可免费获得量子突破指标!*** 当量子突破指标识别出趋势反转时,它会向您发出警报和信号箭头,并建议您三个止盈水平。 它既适合新手交易者,也适合专业交易者。 量子 EA 通道:       点击这里 MT4版本:       点击这里 建议: 时间范围: 所有时间范围。为了获得最佳结果,我们建议在 M15、M30 和 H1 时间范围内使用它。 货币对:欧元兑美元、英镑兑美元、澳元兑美元、欧元兑英镑、, EURAUD,  XAUUSD 账户类型:ECN、Raw 或 Razor,点差极低 经纪时间:任意 经纪商:IC Markets、Pepperstone with Raw 和 Razor 的点差最低 建议止损:50 点 建议止盈水平:20 点、50 点和
TrendMaestro5
Stefano Frisetti
note: this indicator is for METATRADER4, if you want the version for METATRADER5 this is the link:  https://www.mql5.com/it/market/product/108106 TRENDMAESTRO ver 2.4 TRENDMAESTRO recognizes a new TREND in the bud, he never makes mistakes. The certainty of identifying a new TREND is priceless. DESCRIPTION TRENDMAESTRO identifies a new TREND in the bud, this indicator examines the volatility, volumes and momentum to identify the moment in which there is an explosion of one or more of these data a
该仪表盘显示所选符号的最新可用谐波形态,因此您可以节省时间并提高效率 /  MT4 版本 。 免费指标:  Basic Harmonic Pattern 指标列 Symbol:   显示所选符号 Trend:     看涨或看跌 Pattern:    形态类型(Gartley、蝴蝶、蝙蝠、螃蟹、鲨鱼、Cypher 或 ABCD) Entry:     入口价格 SL: 止损价 TP1: 第一止盈价 TP2: 第二次获利价格 TP3: 第三次获利价格 Current price:    当前价格 Age (in bars):   最后绘制的模式的年龄 主要输入 Symbols :   从 "28 种主要货币对 "或 "选定符号 "中选择。 Selected Symbols :   希望监控的符号,用逗号分隔("EURUSD,GBPUSD,XAUUSD")。如果您的经纪商为货币对设置了后缀或前缀,您必须在以下两个参数中添加(货币对前缀或货币对后缀)。 Max Iteration:   调整模式的最大迭代次数(如果该值越小,则模式越少,性能越快;如果该值越大,则模式越多,性能
FX Power MT5 NG
Daniel Stein
5 (5)
通过 mql5 和 Telegram 上 的晨间简报获取每日市场更新,包括详细信息和屏幕截图 ! FX Power MT5 NG 是我们长期以来非常受欢迎的货币强度计算器 FX Power 的下一代产品。 这款下一代强度计算器能提供什么?您所喜爱的原版 FX Power 的所有功能 附加功能 黄金/XAU 强度分析 更精确的计算结果 可单独配置的分析周期 可自定义计算限制,以获得更好的性能 为希望查看更多信息的用户提供特殊的多实例设置 无尽的图形设置,可在每个图表中设置您最喜欢的颜色 无数的通知选项,让您再也不会错过任何重要信息 采用 Windows 11 和 macOS 风格的全新圆角设计 神奇的移动指标面板 FX Power 主要功能 所有主要货币的完整强势历史 所有时间框架内的货币强弱历史 所有经纪商和图表的计算结果完全相同 100% 可靠的实时计算 -> 无重绘 可通过下拉列表选择分析时段 通过自定义模式单独配置分析时段 可在一个图表中使用多个实例 可移动 FX Power 显示屏(通过拖放) 适用于高分辨率 QHD、UHD 和 4K 显示器 自动终端配置 针对平板电脑
IX Power MT5
Daniel Stein
4.17 (6)
IX Power 终于将 FX Power 的无与伦比的精确性带到了非外汇交易符号中。 它能准确判断您喜爱的指数、股票、商品、ETF 甚至加密货币的短期、中期和长期趋势强度。 您可以 分析 终端提供的 一切 。试试吧,体验一下您在交易时如何把握 时机 。 IX Power 主要功能 100% 精确的非重绘计算结果 - 适用于您终端中的所有交易符号 下拉式选择预配置以及可单独配置的强度分析周期 通过电子邮件、消息和手机通知的无数种通知选项 可访问的 EA 请求缓冲区 可自定义计算限制,以获得更好的性能 为希望查看更多信息的用户提供特殊的多实例设置 无尽的图形设置,让您在每个图表中都能找到最喜欢的颜色 采用 Windows 11 和 macOS 风格的圆角新面板设计 神奇的移动指标面板,可在子窗口和主图表之间无缝移动 适用于高分辨率 QHD、UHD 和 4K 显示器,并针对平板电脑和触摸屏进行了优化 IX Power 参数 最重要的参数不言自明,但我们很快会在另一篇文章中为您提供所有 IX Power 参数的完整说明。 使用别名 "参数可为技术交易符号
Blahtech Supply Demand MT5
Blahtech Limited
4.54 (13)
Was: $299  Now: $99   Supply Demand uses previous price action to identify potential imbalances between buyers and sellers. The key is to identify the better odds zones, not just the untouched ones. Blahtech Supply Demand indicator delivers functionality previously unavailable on any trading platform. This 4-in-1 indicator not only highlights the higher probability zones using a multi-criteria strength engine, but also combines it with multi-timeframe trend analysis, previously confirmed swings
Auto Order Block with break of structure based on ICT and Smart Money Concepts (SMC) Futures Break of Structure ( BoS )             Order block ( OB )            Higher time frame Order block / Point of Interest ( POI )    shown on current chart           Fair value Gap ( FVG ) / Imbalance   -  MTF      ( Multi Time Frame )    HH/LL/HL/LH  -  MTF      ( Multi Time Frame )  Choch  MTF      ( Multi Time Frame )  Volume Imbalance     ,  MTF          vIMB Gap’s Power of 3 Equal High
Matrix Arrow Indicator MT5
Juvenille Emperor Limited
5 (12)
矩阵箭头指标 MT5   是一种独特的 10 合 1 趋势,遵循   100% 非重绘多时间框架指标 ,可用于所有符号/工具: 外汇 、 商品 、 加密货币 、 指数 、 股票 。 Matrix Arrow Indicator MT5 将在其早期阶段确定当前趋势,从多达 10 个标准指标中收集信息和数据,它们是: 平均定向运动指数 (ADX) 商品渠道指数 (CCI) 经典 Heiken Ashi 蜡烛 移动平均线 移动平均收敛散度 (MACD) 相对活力指数 (RVI) 相对强弱指数 (RSI) 抛物线SAR 随机振荡器 威廉姆斯的百分比范围 当所有指标给出有效的买入或卖出信号时,相应的箭头将打印在图表上,在下一根蜡烛/柱线开盘时,指示强劲的上升趋势/下降趋势。用户可以选择使用哪些指标,并可以单独调整每个指标的参数。 Matrix Arrow Indicator MT5 仅从选定的指标中收集信息,并仅根据其数据打印箭头。   Matrix Arrow Indicator MT5   还可以为所有新信号发送终端、推送通知或电子邮件警报。无论您是黄牛、日内交易者还是波段交易者, Mat
Entry Points Pro for MT5
Yury Orlov
4.46 (124)
这款指标用于 MT5,可提供准确的入场交易信号,且无重绘。 它可应用在任何金融资产:外汇、加密货币、贵金属、股票、指数。 它将提供极其精准的评估,并告诉您何时开仓和平仓的最佳时机。 观看 视频 (6:22),其中包含一个仅处理单一信号的示例,该信号即可值回指标购价! 大多数交易者在 Entry Points Pro 指标的帮助下,在第一个交易周内即改善了他们的交易结果。 订阅我们的 Telegram 群 ! Entry Points Pro 指标的益处。 入场信号无重绘 如果信号出现,并得到确认,则它不会再消失;不像是重绘指标,它会导致重大的财产损失,因为它们可以在显示信号后再将其删除。 无差错开仓 指标算法可令您找到入场交易(买入或卖出资产)的理想时机,从而提高每位交易者的成功率。 Entry Points Pro 可操作任何资产 它允许您在 MT5 平台上交易任何经纪商的加密货币、股票、贵金属、指数、大宗商品和货币。 提供任何方向的信号 Entry Points Pro 指标提供针对任意价格走势的入场交易信号 - 上涨、下跌或横盘(横向)。
FxaccurateLS
Shiv Raj Kumawat
WHY IS OUR FXACCCURATE LS MT5 THE PROFITABLE ? PROTECT YOUR CAPITAL WITH RISK MANAGEMENT Gives entry, stop and target levels from time to time. It finds Trading opportunities by analyzing what the price is doing during established trends. POWERFUL INDICATOR FOR A RELIABLE STRATEGIES We have made these indicators with a lot of years of hard work. It is made at a very advanced level. Established trends provide dozens of trading opportunities, but most trend indicators completely ignore them!
AT Forex Indicator MT5
Marzena Maria Szmit
5 (4)
The AT Forex Indicator MT5 is a sophisticated trading tool designed to provide traders with a comprehensive analysis of multiple currency pairs. This powerful indicator simplifies the complex nature of the forex market, making it accessible for both novice and experienced traders. AT Forex Indicator uses advanced algorithms to detect trends, patterns and is an essential tool for traders aiming to enhance their forex trading performance. With its robust features, ease of use, and reliable signal
ICT, SMC, SMART MONEY CONCEPTS, SMART MONEY, Smart Money Concept, Support and Resistance, Trend Analysis, Price Action, Market Structure, Order Blocks, BOS/CHoCH,   Breaker Blocks ,  Momentum Shift,   Supply&Demand Zone/Order Blocks , Strong Imbalance,   HH/LL/HL/LH,    Fair Value Gap, FVG,  Premium  &   Discount   Zones, Fibonacci Retracement, OTE, Buy Side Liquidity, Sell Side Liquidity, BSL/SSL Taken, Equal Highs & Lows, MTF Dashboard, Multiple Time Frame, BigBar, HTF OB, HTF Market Structure
Advanced Supply Demand MT5
Bernhard Schweigert
4.5 (14)
任何新手或专业交易者的最佳解决方案! 该指标是一款独特、高质量、且价格合理的交易工具,因为我们已经整合了许多专有功能和新公式。 依据此更新,您将能够显示双重时间帧区域。 您不仅可以显示一个较高的时间帧,还可以同时显示图表时间帧,加上更高的时间帧:显示嵌套时区。 供需双方所有交易者都会喜欢它。 :) 重要信息披露 高级供需的最大潜力,请访问 https://www.mql5.com/zh/blogs/post/720245   想象您的交易如何得以改善,是因为您能够精准定位入场或目标位吗? 构建于新的底层算法,它可以更轻松地识别出买卖双方之间的潜在失衡。 这是因为它以图形方式展示供需最强劲区域,及其过去的表现(显示旧区域)。 这些功能旨在帮助您更轻松地发现最佳入场区域和价位。 现在您可以针对您的交易品种和时间帧来优化和编辑区域强度! 高级供需指标适用于所有产品和时间帧。 它是一个新的公式,非常新的功能是两个区域强度函数可由用户输入进行调整! 这在交易中是一大优势。 当您学习如何使用专有功能,例如带有价格游离最小 X 因子的区域强度时,您能够判断该区域强劲与否。 供需区域用作警报触发器
TPA True Price Action indicator reveals the true price action of the market makers through 100% non-repainting signals strictly at the close of a candle! TPA shows entries and re-entries, every time the bulls are definitely stronger than the bears and vice versa. Not to confuse with red/green candles. The shift of power gets confirmed at the earliest stage and is ONE exit strategy of several. There are available now two free parts of the TPA User Guide for our customers. The first "The Basics"
XQ Indicator MetaTrader 5
Marzena Maria Szmit
3 (2)
Step into the realm of Forex trading with confidence and precision using XQ, a cutting-edge Forex indicator designed to elevate your trading game to unprecedented heights. Whether you're a seasoned trader or just stepping into the world of currency exchange, XQ Forex Indicator empowers you with the insights and signals needed to make informed trading decisions. The signal conditions are a combination of three indicators, and XQ Forex Indicator only display  medium and long-term trends . The ind
PZ Swing Trading MT5
PZ TRADING SLU
5 (4)
Swing Trading 是第一个旨在检测趋势方向的波动和可能的反转波动的指标。它使用在交易文献中广泛描述的基准摆动交易方法。该指标研究多个价格和时间向量,以追踪总体趋势方向,并检测市场超卖或超买并准备好进行修正的情况。 [ 安装指南 | 更新指南 | 故障排除 | 常见问题 | 所有产品 ] 市场波动的利润不会被窃取 指示器始终显示趋势方向 彩色价格带代表机会基准 彩色虚线表示可能的反转波动 该指标分析其自身的质量和性能 它实现了一个多时间仪表板 可定制的趋势和波动周期 它实现了电子邮件/声音/推送警报 指示器为非重涂或重涂 什么是摇摆交易 摇摆交易是一种尝试在一天到一周内从证券中获得收益的交易方式,尽管某些交易最终可以保持更长的寿命。摇摆交易者使用技术分析来买入弱点和卖出力量,并有耐心等待这些机会的发生,因为在发生一波抛售浪潮之后购买证券而不是陷入抛售更有意义。 机会基准 关于历史数据的大量研究证明,适合于波动交易的市场倾向于在基线价格带上下交易,基线价格带由图表显示,使用平均真实区间计算得出。波动交易者使用基线,该策略是购买常态和卖出躁狂,或做空常态并掩盖沮丧。
可以说,这是您可以为MetaTrader平台找到的最完整的谐波价格形成自动识别指标。它检测19种不同的模式,像您一样认真对待斐波那契投影,显示潜在的反转区域(PRZ),并找到合适的止损和获利水平。 [ 安装指南 | 更新指南 | 故障排除 | 常见问题 | 所有产品 ] 它检测19种不同的谐波价格形态 它绘制了主要,衍生和互补的斐波那契投影(PRZ) 它评估过去的价格走势并显示每个过去的形态 该指标分析其自身的质量和性能 它显示合适的止损和获利水平 它使用突破来表明合适的交易 它在图表上绘制所有样式比率 它实现了电子邮件/声音/视觉警报 受斯科特·M·卡尼(Scott M. Carney)的书的启发,该指标旨在满足最纯粹和最熟练的交易者的需求。但是,它采取了一种使交易更容易的方式:在向交易发出信号之前,它会等待Donchian朝正确方向突破,从而使交易信号非常可靠。 斐波那契投影与向量无关 它实现了电子邮件/声音/推送警报 它绘制了ABCD投影 重要提示: 为了符合 Scott M. Carney先生 的商标申诉,某些图案名称已重命名为不言自明的替代方式, Scot
FX Volume MT5
Daniel Stein
4.93 (14)
通过 mql5 和 Telegram 上 的 " 晨间简报 "获取每日市场更新,包括详细信息和屏幕截图 ! 外汇交易量(FX Volume)是第一个也是唯一一个从经纪商角度真正洞察市场情绪的交易量指标。 直接在您的图表上看到这些信息是真正改变游戏规则和突破性的交易解决方案。 受益于独特的市场数据洞察,如 比率(Ratios )显示货币多头和空头头寸的比率(百分比 比率变化 显示所选时间段内的多头比率及其百分比变化 总交易量 显示货币的总交易量(多头和空头),以手为单位 多头 交易量显示货币所有多头头寸的交易量 空头 交易量显示所有货币空头头寸的交易量 净多头 显示净多头交易量,即所有多头头寸减去所有空头头寸(以手为单位)。 净多头百分比 显示货币净多头交易量的变化 请阅读我们的基本教程 -> "如何使用外汇交易量进行交易 " 获取更多信息,如常见问题、交易技巧和教程视频,请访问我们的 外汇交易量公共信息频道 请 安装并运行 SI Connect 以建立与我们数据中心的持续连接 背景信息 我们都知道,外汇是一个分散的市场。这就是为什么我们必须打破常规思维,开发一个独
Noize Absorption Index
Ekaterina Saltykova
Noize Absorption Index - is the manual trading system that measures the difference of pressure between bears forces and bulls forces. Green line - is a noize free index that showing curent situation. Zero value of index shows totally choppy/flat market.Values above zero level shows how powerfull bullish wave is and values below zero measures bearish forces.Up arrow appears on bearish market when it's ready to reverse, dn arrow appears on weak bullish market, as a result of reverse expectation.
PZ Support Resistance MT5
PZ TRADING SLU
4.17 (6)
厌倦了绘制支撑线和阻力线? 支撑阻力 是一个多时间指标,可以自动检测并绘制图表中的支撑线和阻力线,并具有非常有趣的变化:随着时间的推移测试价格水平及其重要性的提高,线变得越来越粗。 [ 安装指南 | 更新指南 | 故障排除 | 常见问题 | 所有产品 ] 一夜之间增强您的技术分析 无需浏览图表即可检测重要的价格水平 一目了然地识别所有价格水平的相对优势 每次交易最多可节省半小时的绘图线 指标显示所有价格水平的期限 指示器不重涂 过去和现在的价格水平因接近程度而崩溃,并根据当前的市场行为进行了调整。在动作发生的地方绘制了线条,而不一定在峰值处绘制了线条。 价格水平随着时间的推移而被拒绝,变得越来越暗 定期清除不重要的价格水平以避免噪音 可自定义的时间范围选择和崩溃因子 它实现了电子邮件/声音/推送警报的突破 输入参数 指标设置:指标将从当前时间段读取价格,但您可以选择另一个。例如,您可以在H4图表中显示D1支撑线和阻力线。您还可以使用 价格水平密度 参数选择在图表上显示多少价格水平。 颜色设置:根据重要性输入所需的支撑线和阻力线颜色。 标签设置:(可选)可以在指示器
Gold Trend 5
Sergei Linskii
5 (1)
黄金趋势 - 这是一个很好的股票技术指标。该指标算法分析资产的价格走势,并反映波动性和潜在进入区。 最佳指标信号: - 卖出 = 红色柱状图 + 红色短指针 + 同方向黄色信号箭头。 - 买入 = 蓝色柱状图 + 蓝色多头指针 + 同方向水蓝色信号箭头。 该指标的优点 1. 该指标生成的信号准确度高。 2. 只有当趋势发生变化时,才能重新绘制已确认的箭头信号。 3. 您可以在任何经纪商的 MetaTrader 5 交易平台上进行交易。 4. 您可以交易任何资产(货币、金属、加密货币、股票、指数等)。 5. 最好在 H1 时间框架(中期交易)上进行交易。 6. 在指标设置中可更改个别参数(TF、颜色等),以便每位交易者都能轻松定制适合自己的指标。 7. 该指标既可作为交易系统的主要补充,也可作为独立的交易系统使用。   注意:交易的入市准确性和盈利能力仅取决于交易者的技能。任何指标都只是交易者的助手,而非行动指南。 MetaTrader 4 黄金趋势指标版本  祝大家交易好运,稳定盈利!
该仪表盘可根据您对所选符号的交易策略,以剥头皮和长期模式在图表上发现并显示供需区。此外,仪表盘的扫描模式可帮助您一目了然地检查所有需要的符号,不错过任何合适的仓位/ MT4 版本 免费指标: Basic Supply Demand 功能 允许您查看多个货币对的交易机会,为您提供所有货币对的清晰简明视图,并根据其与供需区的接近程度进行排序 可定制设置,从颜色到检测参数,满足您的特定需求 主要输入 Indicator mode : 选择指标模式或具有新功能的面板模式 Symbols : 从 "28 种主要货币对 "或 "选定符号 "中进行选择 Selected Symbols : 您希望监控的符号,用逗号分隔("EURUSD,GBPUSD,XAUUSD")。如果您的经纪商对货币对有后缀或前缀,您必须在以下两个参数中添加(货币对前缀或货币对后缀) Trading Style : 选择剥头皮或长期模式 Allowed Deviation : 该参数允许修改需求或供应区域的精确度(数值越小,精确度越高) Zone   thickness : 通过该参数可以修改需求和供应
Price Action Finder Multi MT5
Siarhei Vashchylka
5 (5)
The Price Action Finder Multi indicator is an indicator of entry points that searches for and displays Price Action system patterns on dozens of trading instruments and on all standard time frames: (m1, m5, m15, m30, H1, H4, D1, Wk, Mn). The indicator places the found patterns in a table at the bottom of the screen. By clicking on the pattern names in the table, you can move to the chart where this pattern is located. Manual (Be sure to read before purchasing) | Version for MT4 Advantages 1. Pa
Gold ATR MTF 5
Sergei Linskii
Gold ATR MTF - 這是一個很好的股票技術指標。 ATR(平均真實波動範圍)指標的演算法分析資產價格的變動,並透過在指定時間範圍 (D1) 的開盤價的指定百分比 (%) 中繪製相應水平來反映波動性。 符號價格變動方向和箭頭訊號的指標(紅色和/或藍色 D1 H4)是舒適且有利可圖的日內交易和/或倒賣的額外且重要的幫助。 對於外匯符號,每日利潤可以從 20 點起;對於黃金符號,每日利潤可以從 50 點起。 指標特點: 這是一個超級指標,具有 Magic、趨勢方向檢測器和兩個趨勢箭頭塊,可實現舒適且有利可圖的交易。 圖表上顯示用於切換方塊的紅色按鈕。 Magic 在指標設定中進行設置,以便您可以將指標安裝在顯示不同區塊的兩個圖表上。黃金 ATR MTF 可以放置在具有不同箭頭緩衝區(FP 和 SA)的兩個圖表上。 為此,您需要在設定中選擇不同的Magic,例如,一個Magic=999,另一個Magic=666。 然後您可以使用圖表上的紅色按鈕選擇箭頭緩衝區。在GOLD ATR MTF 中,只有當價格強勁波動時,水平(ATR) 才能小幅擴大,只有當價格強勁波動時,才能重新繪製趨勢方
作者的更多信息
To get access to MT5 version please click here . This is the exact conversion from TradingView: "Zero Lag MACD Enhanced - Version 1.2" by "   Albert.Callisto ". This is a light-load processing and non-repaint indicator. All input options are available.  Buffers are available for processing in EAs. You can message in private chat for further changes you need. Thanks
To get access to MT4 version please click here . This is the exact conversion from TradingView: "Supertrend" by " KivancOzbilgic ". This is a light-load processing and non-repaint indicator. You can message in private chat for further changes you need. Here is the source code of a simple Expert Advisor operating based on signals from  Supertrend . #include <Trade\Trade.mqh> CTrade trade; int handle_supertrend= 0 ; input group "EA Setting" input int magic_number= 123456 ; //magic number input dou
To download MT4 version please click here . - This is the exact conversion from TradingView: "Linear Regression Candles" By "ugurvu". - The overall look of the indicator is like Heiken Ashi. - It can be used as a trend confirmation indicator to detect the right trend direction. - This indicator lets you read the buffers for Candles' OHLC. - This is a non-repaint and light processing load indicator - You can message in private chat for further changes you need. Thanks
To download MT5 version please click here . This is the exact conversion from TradingView: "B-Xtrender" By "QuantTherapy". - It is an oscillator based on RSI and multiple layers of moving averages. -   It is a two in one indicator to calculate overbought and oversold zones for different RSI settings. -  This indicator lets you read the buffers for all data on the window. - This is a non-repaint and light processing load indicator. - You can message in private chat for further changes you need.
For MT4 version please click here . This is the exact conversion from TradingView: "Average True Range Stop Loss Finder" By "veryfid". - This indicator implements a deviation channel. - The channel determines trend direction as well as stop loss placement. - This is a non-repaint and light processing load indicator. - You can message in private chat for further changes you need.
This is the Chandelier Exit trend indicator applied to heiken ashi candles based on "G TREND GUNBOT" by "LUIS_GANDATA_G_TREND" on tradingview. Heiken ashi candles filter out many of the chops and therefore as an input to Chandelier Exit you achieve well filtered Buy and Sell signals. Also you can choose to apply the trend indicator to normal candles via input tab. (two in one indicator) This is a non-repaint and light processing load indicator. You can message in private chat for further change
FREE
Please backtest with the exact balance of your live account before applying to real money. ==> If account balance is too low it may not trade at all! For MT4 version please contact via private message. Strategy description - Detect trend based on GoldTrader rules. - Enter in both direction as much as needed to achieve acceptable amount of profit. - Although this is a martingale bot it is very unlikely to loose your money, because: ==> the money management rules are safe and low risk. ==> entries
FREE
I do not have the exact indicator for MT4 but the nearest possible look alike can be downloaded from here . Also you may check this link . This is the exact conversion from TradingView: "Donchian Trend Ribbon" By "LonesomeTheBlue". One of the coolest indicators out there to detect trend direction and strength. As a trader you always need such indicator to avoid getting chopped in range markets. There are ten buffers as colors to use in EAs also. The indicator is loaded light and non-repaint. Not
Volume Oscillator
Yashar Seyyedin
To download MT4 version please click here . The Volume Oscillator measures volume by analyzing the relationship between two Moving Averages. The Volume Oscillator indicator subtracts a fast MA from slow MA. The fast and slow MA periods are configurable via input tab. Volume indicators are an ingredient of trading systems to avoid entry in thin liquidity markets. Having set a threshold on Volume Oscillator you can avoid entering chop. Buffers are available to access via EA.
FREE
To get access to MT5 version please click here . - This is a conversion from TradingView: "Hull Suite" By "Insilico". - This is a light-load processing and non-repaint indicator. - You can message in private chat for further changes you need. note: Color filled areas and colored candles are not supported in MT4 version. Here is the source code of a simple Expert Advisor operating based on signals from  Hull Suite . #property strict input string EA_Setting= "" ; input int magic_number= 1234 ; inp
For MT4 version please click here . This is the exact conversion from TradingView: "Range Filter 5min" By "guikroth". - This indicator implements Alerts as well as the visualizations. - Input tab allows to choose Heiken Ashi or Normal candles to apply the filter to. It means it is a (2 in 1) indicator. - This indicator lets you read the buffers for all data on the window. For details on buffers please message me. - This is a non-repaint and light processing load indicator. - You can message in p
Hull Suite By Insilico
Yashar Seyyedin
5 (1)
To get access to MT4 version please click here . - This is the exact conversion from TradingView: "Hull Suite" By "Insilico". - This is a light-load processing and non-repaint indicator. - You can message in private chat for further changes you need. Here is the source code of a simple Expert Advisor operating based on signals from  Hull Suite . #include <Trade\Trade.mqh> CTrade trade; int handle_hull= 0 ; input group "EA Setting" input int magic_number= 123456 ; //magic number input double fixe
To get access to MT5 version please click here . This is the exact conversion from TradingView: " Better RSI with bullish / bearish market cycle indicator" by TradeCalmly. This is a light-load processing and non-repaint indicator. All input options are available.  Buffers are available for processing in EAs. You can message in private chat for further changes you need.
GoldTrader
Yashar Seyyedin
Please backtest with the exact balance of your live account before applying to real money. ==> If account balance is too low it may not trade at all! For MT4 version please contact via private message. martingale version is available here . Strategy description - Detect trend based on EMA18-EMA50-SMA200 alignment in three time frames: M15, H1, H4 - Trade in trend direction and exit when above alignment is broken. - The bot is tuned to trade XAUUSD(Gold). - The bot output is break even in rangi
FREE
IntradayTrader
Yashar Seyyedin
This Expert is developed to optimize parameters to trade intraday trending markets. Simply use optimization to find the proper inputs for specific symbol you are interested in.  This is a light load EA from processing point of view. You can easily run this on several charts simultaneously. Make sure to set a different magic number for each. note: The screenshot shows a 12% profitability in EURUSD for a period of a year and 2% draw-down using optimization to find best inputs.
FREE
To download MT5 version please click  here . The Volume Oscillator measures volume by analyzing the relationship between two Moving Averages. The Volume Oscillator indicator subtracts a fast MA from slow MA. The fast and slow MA periods are configurable via input tab. Volume indicators are an ingredient of trading systems to avoid entry in thin liquidity markets. Having set a threshold on Volume Oscillator you can avoid entering chop. Buffers are available to access via EA.
FREE
Choppy Trader
Yashar Seyyedin
This Expert is developed to optimize parameters to trade in choppy markets. Simply use optimization to find the proper inputs for specific symbol you are interested in.  This is a light load EA from processing point of view. You can easily run this on several charts simultaneously. Make sure to set a different magic number for each. note: The screenshot shows a 20% profitability in USDCAD for a period of 4-months and 5% draw-down using optimization to find best inputs.
FREE
MacroTrendTrader
Yashar Seyyedin
This is MacroTrendTrader. It trades in DAILY time frame even if you run it on lower time frames. It opens/closes trades once per day at a specific time that you choose via input tab: - "param(1-5)" are optimization parameters. - "Open/Close Hour" is set via input tab. Make sure to choose this to be away from nightly server shutdown. - "high risk" mode if chosen, sets a closer stop loss level. Therefore higher lot sizes are taken.  This is a light load EA from processing point of view. Calculatio
FREE
Vortex Indicator
Yashar Seyyedin
To download MT4 version please click here . - This is vortex indicator. - It is used to detect trend strength and direction. - It consists of two line(buffers). ==> VIM and VIP - There are three types of signals related to this indicator: 1. crossing VIM and VIP 2. threshold on distance between VIP and VIM 3. VIP above VIM vice versa. - This is a non-repaint indicator with light processing.
FREE
To download MT4 version please click here . This is the exact conversion from TradingView: "RSI versus SMA" By "JayRogers". This indicator lets you read the buffers for all Lines on chart.  Note: This is an indicator, Not an expert. Meaning It does not take trades. If you want the EA please contact via message. You can easily use the indicator to understand the logic behind trades that the TradingView strategy takes. The strategy is profitable if this indicator is applied to the right symbol at
FREE
To download MT5 version please click here . - This is the exact conversion from TradingView: "Linear Regression Candles" By "ugurvu". - This is a non-repaint and light processing load indicator - You can message in private chat for further changes you need. This is a sample EA code that operates based on bullish and bearish linear regression candles . #property strict input string EA_Setting= "" ; input int magic_number= 1234 ; input string     Risk_Management= "" ; input double fixed_lot_size=
To get access to MT5 version please click here . - This is the exact conversion from TradingView: "Trend Regularity Adaptive Moving Average","TRAMA" By "   LuxAlgo   ". - This is a light-load processing and non-repaint indicator. - Buffer is available for the main line on chart. - You can message in private chat for further changes you need. Thanks for downloading
To get access to MT5 version please click here . - This is the exact conversion from TradingView: "Stochastic Momentum Index" By "UCSgears". - This is a popular version of stochastic oscillator on tradingview. - This is a light-load processing and non-repaint indicator. - Buffers are available for the lines on chart. - You can message in private chat for further changes you need. Thanks for downloading
To get access to MT5 version please click here . This is the exact conversion from TradingView: "Supertrend" by " KivancOzbilgic ". This is a light-load processing and non-repaint indicator. Highlighter option isn't available in MT4 version. You can message in private chat for further changes you need. Here is the source code of a simple Expert Advisor operating based on signals from  Supertrend . #property strict input string EA_Setting= "" ; input int magic_number= 1234 ; input double fixed_lo
Didi Index by everget MT4
Yashar Seyyedin
5 (1)
To get access to MT5 version please click here . - This is the exact conversion from TradingView: "Didi Index" by " everget ". - This is a popular version of DIDI index on tradingview. - This is a light-load processing and non-repaint indicator. - Buffer is available for the lines on chart and arrows on chart. - You can message in private chat for further changes you need. Thanks for downloading
To download MT5 version please click here . - This is vortex indicator. - It is used to detect trend strength and direction. - It consists of two line(buffers). ==> VIM and VIP - There are three types of signals related to this indicator: 1. crossing VIM and VIP 2. threshold on distance between VIP and VIM 3. VIP above VIM vice versa. - This is a non-repaint indicator with light processing.
FREE
Full Pack Moving Average
Yashar Seyyedin
4 (2)
To download MT4 version please click here . Metatrader users are limited to few moving average types. Therefor I decided to create a package consisting of all MAs I knew. This package suggests 12 different types: { SMA, EMA, DEMA, TEMA, WMA, VWMA, SMMA(RMA), HullMA, LSMA, ALMA, SSMA, TMA } You can configure them via input tab. This is a non-repaint indicator with light load. To implement them I referred to standard  libraries of pine script.
FREE
RSI versus SMA
Yashar Seyyedin
4 (1)
To download MT5 version please click  here . This is the exact conversion from TradingView: "RSI versus SMA" By "JayRogers". This indicator lets you read the buffers for all Lines on chart.  Note: This is an indicator, Not an expert. Meaning It does not take trades. If you want the EA please contact via message. You can easily use the indicator to understand the logic behind trades that the TradingView strategy takes. The strategy is profitable if this indicator is applied to the right symbol at
FREE
To download MT5 version please click here . Metatrader users are limited to few moving average types. Therefor I decided to create a package consisting of all MAs I knew. This package suggests 12 different types: { SMA, EMA, DEMA, TEMA, WMA, VWMA, SMMA(RMA), HullMA, LSMA, ALMA, SSMA, TMA } You can configure them via input tab. This is a non-repaint indicator with light load. To implement them I referred to   standard  libraries of pine script.
FREE
To get access to MT5 version please click   here . This is the exact conversion from TradingView: "Hammer & ShootingStar Candle Detector" by "MoriFX". This is a light-load processing and non-repaint indicator. All input options are available.  Buffers are available for processing in EAs. You can message in private chat for further changes you need. Thanks.
FREE
筛选:
无评论
回复评论