Floating peaks oscillator
- 指标
- Ekaterina Saltykova
- 版本: 1.0
- 激活: 5
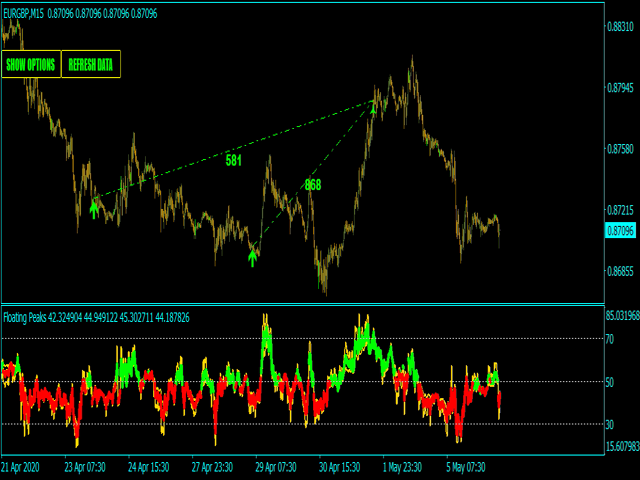
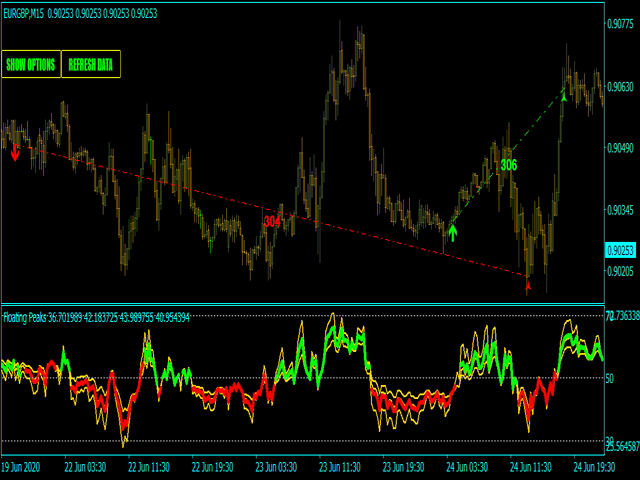
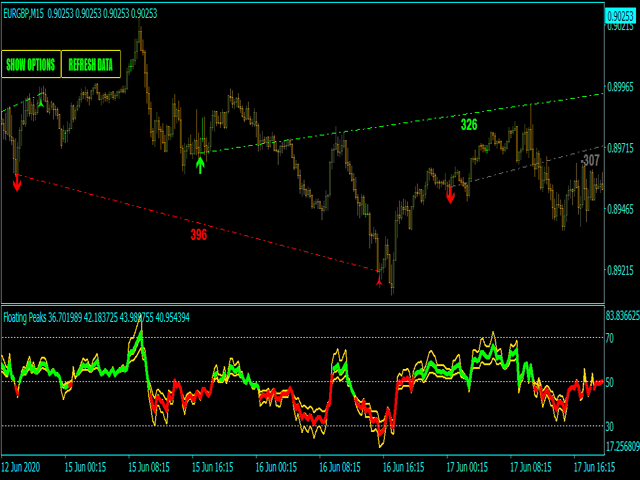
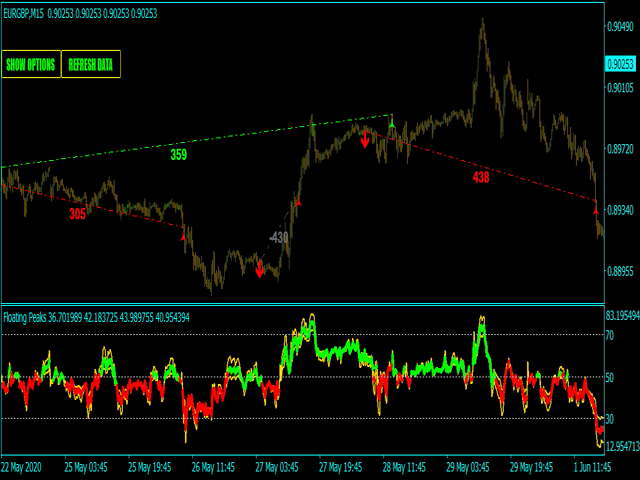
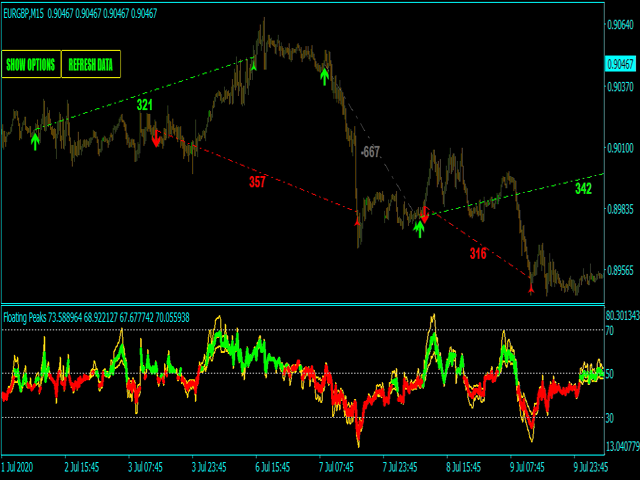
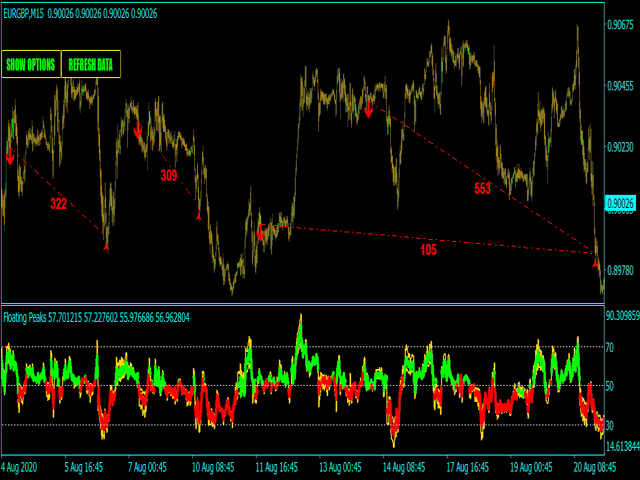
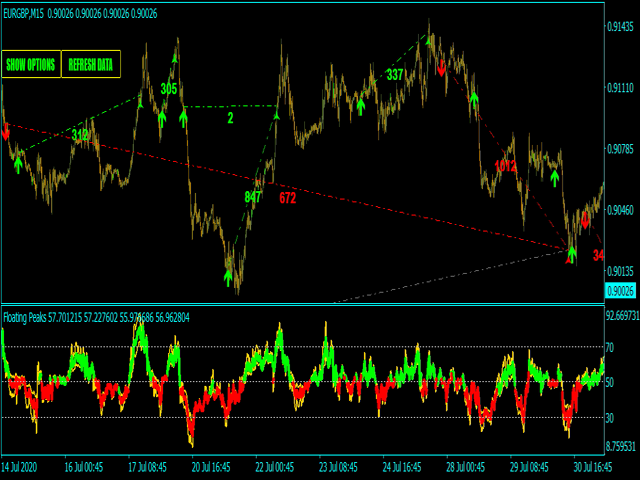
Floating peaks oscillator - it the manual trading system. It's based on Stochastik/RSI type of oscillator with dynamic/floating
overbought and oversold levels. When main line is green - market is under bullish pressure, when main line is red - market is under bearish pressure. Buy arrow appears at the floating bottom and sell arrow appears at floating top. Indicator allows to reverse signal types.
Main indicator's adjustable inputs :
- mainTrendPeriod;
- signalTrendPeriod;
- smoothedTrendPeriod;
- trendPowerMainPeriod;
- trendPowerSignalPeriod;
- trendPowerSmoothedPeriod;
Trend periods participates in the main Oscillator formation(defines trend wave direction). Power periods - defines current trend wave power;
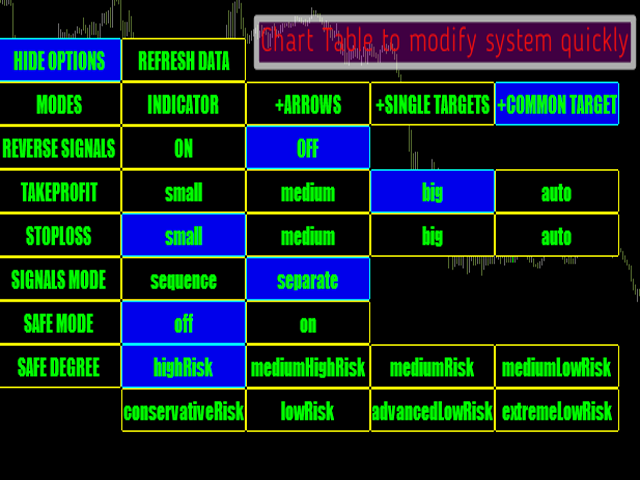
Main Indicator's Features
- Signals are not repaint, late or disappear;
- Every signal comes at the open of new bar(system uses only confirmed signals);
- Indicator has Alerts, Mail and Push notifications(allow to trade out of PC, from smartphone/mobile app);
- Indicator has profit/loss targets;
Recommendations for trading
- EURGBP, GBPUSD, GBPJPY, EURGPY, USDJPY;
- Best timeframes - M5-H1 timeframe;