• 概述
  • 评论
  • 评论

AIS Bessel Filter MT5

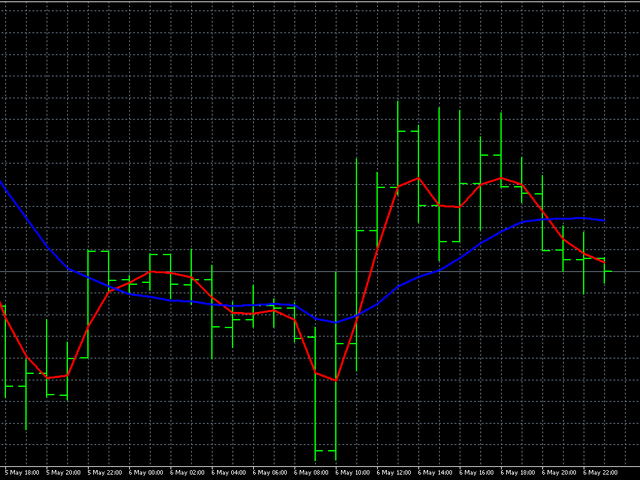
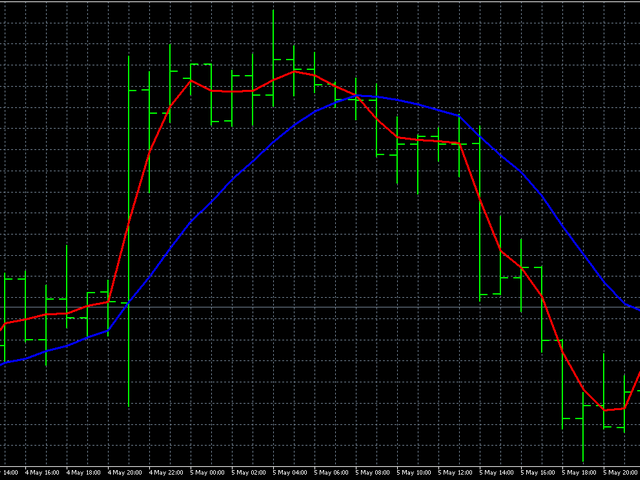
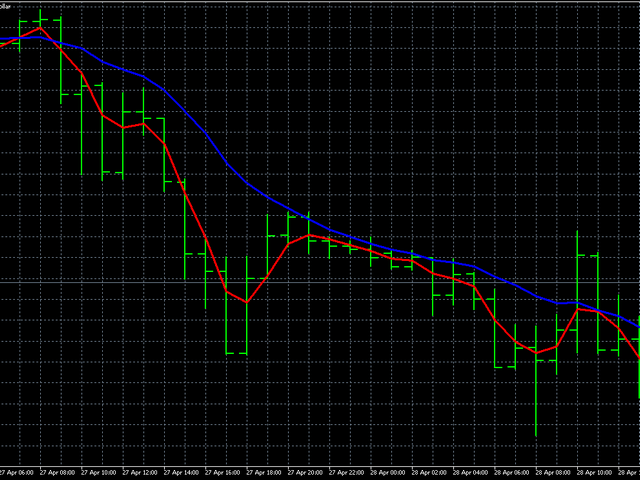
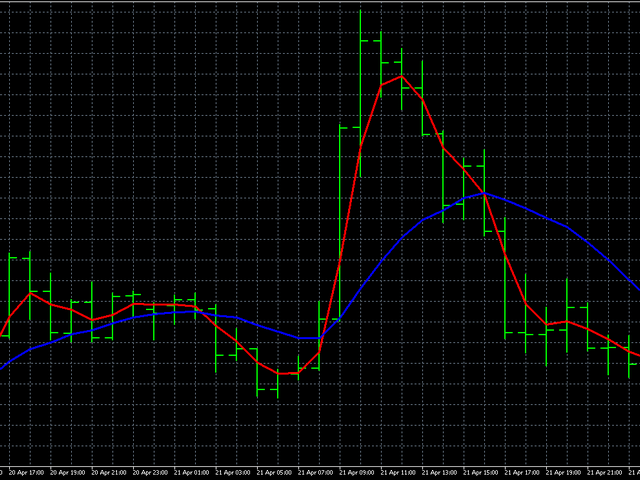
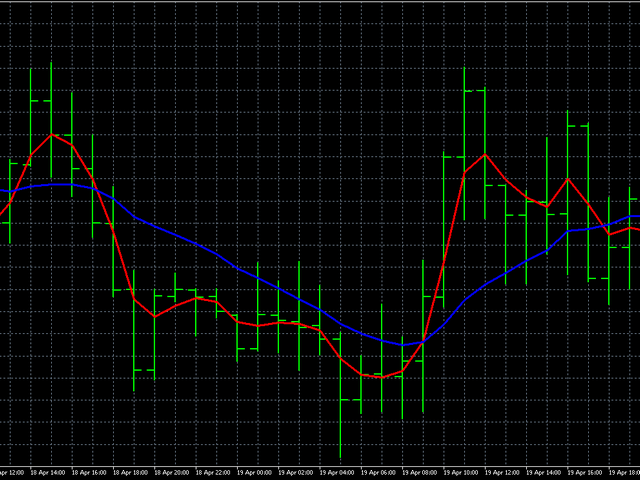
该滤波器基于贝塞尔多项式。它的主要优点是时间延迟小。这个过滤器的另一个特点是它对金融时间序列的最新值的高度敏感。正因为如此,该指标突出了活跃的价格走势,同时消除了噪音偏差。
除了经典变体之外,贝塞尔系数的对数已作为加权函数添加到指标中。在这种情况下,指标变得更平滑,但同时当价格活跃时它可能会滞后。
在计算贝塞尔多项式时,会使用阶乘。因此,指标的周期从下方和上方受到限制。使用普通贝塞尔滤波器时,最好注意指标的小周期。由于随着周期的增加,指标的行为变得越来越稳定,差异变得越来越不明显。
这些图显示了两种过滤器类型的行为。
指标参数:
  • TypeFilter - 正常/对数滤波器类型选择
  • iPeriod - 指标周期,有效值 3 - 85。


推荐产品
ROC acceleration-deceleration is the manual system for medium-term scalping. Indicator based on custom ROC system which defines bullish/bearish market and especially  acceleration-deceleration of tendention in the market's main direction. Buy arrow is plotted during bearish market when current trend decelerates and sell  arrow is plotted during bullish market when current trend decelerates. Main Indicator's Features Signals are not repaint,non-late or disappear(exept cases when system recalculat
TREND HARMONY MT5 – Multi Timeframe Trend and Phase and Pullback Level Visualizer indicator for Metatrader5 The TREND HARMONY indicator automates deep trend analysis and generates visualizations for you. Take control of your trades by eliminating uncertainty! Revolutionize your trading experience with precision and insight through the TREND HARMONY Multi Timeframe indicator – your ultimate MT5 trend visualization indicator. [  Features and Manual   | MT4 version |   All Products   ] Are you t
β指标,也被称为贝塔指标,作为对冲机构参考指标之一。 允许您测量个别资产(如货币和大宗商品)相对于市场组合、跨货币对、美元指数和股票指数的相对风险。通过了解您的资产与市场基准相比的表现,您将更清晰地了解您的投资风险状况。 显著特点: 准确的风险评估:β指标提供了资产相对于更广泛市场的风险的精确评估,帮助您做出明智的投资选择。 多样化策略:使用该指标优化您的投资组合,探索各种资产类别的多样化机会。 适用于多货币对冲:参与多货币对冲的投资者可以将该指标视为重要参考点。 实时见解:随时了解实时数据分析,以及时做出决策。 通过将β指标融入您的交易工具箱,解锁数据和风险分析的力量。开始做出更明智的选择,减少投资组合暴露于不必要风险。 β = 1:如果β等于1,表示资产的价格波动与市场整体的波动一致,即资产的价格变化与市场一致,通常意味着资产的风险与市场相当。 β > 1:如果β大于1,表示资产的价格波动比市场整体更大,即资产的价格变化波动较大,通常意味着资产更具风险。 β < 1:如果β小于1,表示资产的价格波动比市场整体更小,即资产的价格变化波动较小,通常意味着资产相对较低风险。 β = 0:
Man Trend
Ivan Simonika
Man Trend uses at its core the process of identifying the rate of change in price growth and allows you to find entry and exit points from the market. The indicator was created on the basis of the original indicators for searching for extreme points, the indicator is well suited for determining a reversal or a large sharp jerk to one of the sides, thanks to it you will know when this happens, it will notify you with the appearance of a blue dot to buy red to sell. This is a fundamental tech
RSIScalperPro
PATRICK WENNING
介绍 RSIScalperPro - 这款基于 RSI 指标的革命性交易指标适用于 MetaTrader 5,专为一分钟图表的剖刺交易而设计。借助 RSIScalperPro,您将拥有一个强大的工具箱,用于精确的入场和出场信号,提升您的交易水平。 RSIScalperPro 使用两种不同的 RSI 指标,为超买和超卖区域提供清晰的信号。您可以根据自己的偏好自定义两个 RSI 的时间周期和限制值,以实现您的交易策略的最佳效果。图表上的明显箭头使您可以轻松识别何时进入或退出交易。 RSIScalperPro 的另一个亮点是三个可自定义的移动平均线,帮助您识别趋势方向并确认强大的交易信号。这使您可以早早发现趋势并参与到盈利交易中。 此外,您可以设置 RSIScalperPro 发出每个新交易信号的听觉警报。这样,即使您不经常坐在计算机屏幕前,也不会错过任何重要的交易机会。 RSIScalperPro 提供用户友好的界面,并且在 MetaTrader 5 中很容易插入和配置。您可以根据个人交易偏好自定义指标,并利用其多样化的功能,提高交易成果。 利用 RSIScalperPro 的优势,提高
The indicator helps to enter a trade following the trend, at the same time, after some correction. It finds strong trending movements of a currency pair on a given number of bars, and also finds correction levels to this trend. If the trend is strong enough, and the correction becomes equal to the one specified in the parameters, then the indicator signals this. You can set different correction values, 38, 50 and 62 (Fibonacci levels) are better. In addition, you can set the minimum trend lengt
CLICK HERE FOR FREE DOWNLOAD This trading indicator Automatically identifies and plots contract blocks, which are essential zones marked by significant levels of support and resistance. This powerful tool provides traders with a clear and intuitive visualization of critical market points where prices are likely to bounce or reverse. The contract blocks, represented by distinct colored rectangles, highlight support zones (at the bottom) and resistance zones (at the top), enabling traders not onl
Bollinger Turbo
Aleksandr Zakhvatkin
Советник основан на популярной стратегии и использованием связки из двух индикаторов: Bollinger Bands + RSI. Добавлена функция добавления новых позиций при определенной просадке. Количество добавляемых позиций и размер просадки регулируются. Описание настроек Группа "Настройки торговли" Lot Size Размер лота Drawdown Просадка TakeProfit Тейк профит Count Счетчик доливок (не более 10) New bar control Включение явного контроля открытия нового бара (для тестера) Группа "Настройки Bol
Xtrade Trend Detector
Dago Elkana Samuel Dadie
Xtrade Trend Detector is an indicator capable of finding the best opportunities to take a position in any stock market. Indeed, it is a great tool for scalpers but also for Daytraders. You could therefore use it to identify areas to trade, it fits easily on a chart. I use it to detect trends on Big timeframes and take positions on Small timeframes. Don't hesitate to give me a feedback if you test it.
这个多时间框架和多符号供需区仪表板指示器在价格达到供需区时发送警报。也可以使用它来提醒常规的双顶/双底而不是区域。它可以用于从 M1 到 MN 的所有时间范围。     仪表板中最多可同时显示 9 个时间范围。 可以使用 RSI、背离(MACD、RSI 或 Awesome)和蜡烛图过滤器(pin bar、吞没、镊子和晨星/夜星)来仅过滤掉最强的设置。结合您自己的规则和技术,该指标将允许您创建(或增强)您自己的强大系统。 在产品博客 的末尾,您将能够下载示例智能交易系统 (EA) 的源代码,该示例使用 iCustom() 函数从指标获取交易信号。尽管 EA 功能齐全,但主要目的是使用代码并将其粘贴到您自己开发的 EA 中或将您自己的额外进入/退出逻辑添加到此 EA 中。鉴于我的时间有限,我将无法提供任何编程支持。我很抱歉。 特征 这 足以放置一个指标图表上,你会出现在仪表板的任何新的信号接收警报。支持所有 Metatrader 本地警报类型。 在仪表板内持续执行排名排序。可以禁用此排序,以便更轻松地找到特定符号。然后,交易品种将按照它们在交易品种参数中输入的相同顺序显示,或者按照它们
The Trap Play MT5
Carl Gustav Johan Ekstrom
5 (1)
Trap Play  refers to a market situation where price initially makes a new high or low, luring traders into believing a strong trend is forming. However, the price quickly reverses and invalidates the breakout, trapping those traders who entered positions based on the initial move. This sudden reversal often results in a rapid exit of positions, leading to significant price movement in the opposite direction.  Trap plays  can occur in various financial markets and timeframes and are characterized
AI Binary Sniper
Angelo Capoferri
基於人工智慧的指標,可產生二元期權的可能的看漲期權和看跌期權條目。 此指標適用於 3 種不同的策略: 1) 透過讀取交易量,它會在價格應該反轉時發出訊號 2)透過價格和成交量之間的背離,發出趨勢何時繼續或反轉的信號 3)透過價格和成交量之間的收斂,它發出了趨勢何時應該繼續的信號。 此指標適用於所有時間範圍,但在 3 分鐘或 5 分鐘期限內獲得最佳結果(因為在低時間範圍內會出現機構攻擊)。 最佳時間是流動性較大的時間,即格林威治標準時間 7 點至 18 點。 雖然該指標產生超過 70% 的正確訊號,但您可能會遇到操縱價格或相互排斥的機構之間的爭鬥,從而產生一系列錯誤訊號,因此我們建議使用充分的資金管理(例如 Masaniello )...
Harmonic Patterns Scanner MT5
Reza Aghajanpour
4.2 (5)
** All Symbols x All Time frames scan just by pressing scanner button ** *** Contact me  to send you instruction and add you in "Harmonic Scanner group" for sharing or seeing experiences with other users. Introduction Harmonic Patterns are best used to predict turning point. Harmonic Patterns give you high win rate and high opportunities for trade in during one day. This indicator detects the best and successful patterns based on Harmonic Trading concepts . The   Harmonic Patterns   Scanner   Sc
Demo version T Trading Simulator   doesn't work in the strategy tester. The Strategy Tester does not support the processing of ChartEvent. It does not support most of the panel's functionality. Contact me for any questions or ideas for improvement or in case of a bug found. Hi everyone, Trobotrader here. By T Trading Simulator , You can go back to past then analysis and trade with this simulator to develop trading skill. We are going to walk through step-by-step how  you can use T Trading Simul
Advisor for hedging trading or pair trading. A convenient panel allows you to open positions on the necessary trading instruments and lots. Automatically determines the type of trading account - netting or hedging. Advisor can close all its positions upon reaching profit or loss (determined in the settings). A negative value is required to control losses (for example, -100, -500, etc.). If the corresponding fields are 0, the EA will not use this function.   Settings: Close profit (if 0
Introducing Talisman QuantAlgo for EURUSD! This EA completely transforms the way you trade EURUSD. Through extensive pattern research on this symbol, we can predict future price behavior with very high accuracy. One of the best things about Talisman QuantAlgo is its simplicity. You have a choice of 4 strategies, each representing a different approach to trading. From highly precise but less frequent trades to very frequent trading with positive long-term results, Talisman QuantAlgo offers it
Forget coding! You no longer need EAs! Any indicators (and not only) can now trade themselves anything anywhere! GRat_IndiTrade is a strategy builder for automatic trading by the signals of  ANY available indicators without limits (both standard and custom), as well as on ANY of their combinations, by candlestick patterns, without the need to write, generate or compile any code . You no longer need to be or hire a programmer to test and automate ALL your trading ideas. Just place the indicato
Calculates pivot levels. It paints the histogram depending on the location of prices relative to these levels. Parameter values: style - select the type of display (Histogram, Line, Arrow) price - price, has little effect on the final look, but this can be customized timeframe - select a timeframe for calculating levels. color over pivot line - color of everything above the pivot level color under pivot line - color of everything below the pivot level pivot line intersection color - the color
FREE
Sun
Arthur Hatchiguian
3.72 (29)
Sun是一个积极的多周期黄牛,为 EURUSD M1 设计。 每个周期都是独立的。它使用一个订单序列,并有自己的TP和SL。它使用一个马丁格尔系统。 这个EA是利用过去的强势复现来采取立场,并实现高成功率。 在开始之前阅读 博文 是非常重要的。 最低存款额为100美元,杠杆率为1:500。其中包括一个自动交易系统。 我建议使用1:500的ECN账户,低点差和快速VPS。 该EA需要每个图表至少1000MB(1GB)的可用内存才能正常工作。 设置和设定文件 :  https://www.mql5.com/en/blogs/post/747168 信号:   https://www.mql5.com/en/users/myxx/seller SUN对: Sun (EURUSD):  https://www.mql5.com/en/market/product/75070 G olden Tree (XAUUSD):  https://www.mql5.com/en/market/product/76681 这个算法只在MT5上使用我自己的指标,没有使用第三方软件。 本EA不能预测
Delta Single Volume is a very powerful indicator that reads the supply on the Market. It calculates the Delta from movement of the price and the difference of BUY and SELL volumes. Its special structure allows you to get all timeframe values available on the MT5 platform. It works on Tick Volumes and Real Volumes (if avalaibles on your Broker). A good observation of this instrument can suggest great entry points and possible reversal. We are confident that this tool will help you to improve yo
Rejection Block
Usiola Oluwadamilol Olagundoye
The "Rejection Block" MetaTrader 5 Indicator offers traders a comprehensive tool for identifying and visualizing rejection candlestick patterns, commonly known as rejection blocks. These patterns are pivotal in discerning potential market reversals or continuations, making them invaluable for traders seeking to enhance their analysis. Key Features: Rejection Block Detection: The indicator diligently scans price data, pinpointing instances of rejection candlestick patterns. These patterns typical
FREE
Skiey
Vitalii Zakharuk
Skiey - Indicator of easy solutions! Using this indicator is very simple, since the simplest is to look at the chart and act according to the color arrows. Such a calculation option takes into account intraday price fluctuations and focuses on measuring the "candlestick" share in the trend. The algorithm takes into account the measurement of prices, this method also emphasizes the measurement of each of the price drops (H / C, H / O, LC, LO) - which gives more detailed information but also mo
Galaxy MT5
Marta Gonzalez
GALAXY it is a Secure Automated Software for trade Forex market and indices. Architecture is a Fully Automatic Autonomous Robot Expert capable Independently analyzing the market and making trading decisions   GALAXY     It is an advanced trading system. This is a fully automatic Expert Advisor.      NO INPUT TO SELECT FOR THE TRADER ALL AUTOMATED THIS SYSTEM IS ALWAIS IN THE MARKET IN THE TWO DIRECCTION MAKE WINING CYCLES  GALAXY . It is a 100% automatic system, the system controls
这是一个会自我学习的指标。你需要设定一个起始时间,并下载相应的历史数据,让它进行学习。学习的规则限制尽量少,给予指标最大的自由度。因此,以学习期间的最佳结果为选取原则,并不保证每次交易都是盈利的。通常而言,学习时间越长,结果越可靠。 在策略测试器中,你需要设定时间参数,早于测试开始的时间,以便让指标有充足的学习时间。 指标会发出买入或者卖出的信号,以箭头的方向作出区分。指标亦会发出关闭信号,以不同颜色的圆点作区分。 *************************************************************************************************************************************
Description This addon is originated from my own trading. I spent my whole time waiting for signals and just wanted a notification  when a specific signal appears. So i started to wrote my own addon and called it "LifetimeSaver", because thats exactly what it is for me. But because this addon should not only be for my personal trading, I extended the LifetimeSaver and now its highly customizable,  so that it can fit your needs. Functions: Notification at your defined target/signal Notificatio
Vwap Bands Auto
Ricardo Almeida Branco
The Vwap Bands Auto indicator seeks to automatically map the maximum market frequency ( automatic update of the outermost band ) and has two intermediate bands that also adjust to daily volatility. Another tool from White Trader that combines price and volume, in addition to mapping the daily amplitude. The external band is updated automatically when the daily maximum or minimum breaks the current frequency, and can be an input signal, seeking a return to the daily vwap. Thus, in ad
Hrum
Yvan Musatov
The Hrum indicator was created to neutralize temporary pauses and rollbacks. It analyzes price behavior and, if there is a temporary weakness in the trend, you can notice this from the indicator readings, as in the case of a pronounced change in trend direction. Entering the market is not difficult, but staying in it is much more difficult. With the Giordano Bruno indicator and its unique trend line, staying on trend will become much easier! Every rise and every fall is reflected in your emot
XFlow
Maxim Kuznetsov
XFlow shows an expanding price channel that helps determine the trend and the moments of its reversal. It is also used when accompanying transactions to set take profit/stop loss and averages. It has practically no parameters and is very easy to use - just specify an important moment in the history for you and the indicator will calculate the price channel. DISPLAYED LINES ROTATE - a thick solid line. The center of the general price rotation. The price makes wide cyclical movements around the
Critical Zones MT5
Rodrigo Arana Garcia
临界区( Critical Zones )是专为寻找更准确市场入口的手动交易者而设计的。该指标采用先进的算法,通过计算图表上最相关的支撑位和阻力位以及它们的突破和回测来检测感兴趣的区域。该指标可配置为在检测到潜在有利可图的买入/卖出机会时发送警报和通知,让交易者即使不在屏幕/ MT4 版本前 ,也能随时掌握交易机会。 价格将逐步提高,直至达到 300 美元。下一个价格-->   69 美元 功能特点 无重绘  当新数据到来时,该指标不会改变其数值。 交易货币对 所有外汇货币对 季节性 所有季节性 参数 ===== 支撑位和阻力位 配置 ===== 用于计算的查看条形图 // 从当前条形图向后查看的条形图范围,用于计算支撑位和阻力位 ===== 条件 ===== 突破 // 打开或关闭突破检测 回测 // 启用或禁用回测检测 ===== 支撑位和阻力位样式 =====  绘制类型 // 设置支撑线和阻力线的线型 支撑线颜色 // 设置支撑位的颜色 阻力位颜色 // 为阻力位定义颜色 ===== 警报 =====
Cryo
Sabina Fik
5 (1)
Cryo is based on the process of identifying the rate of change in price growth and allows you to find entry and exit points from the market. A fundamental technical indicator that allows you to assess the current market situation in order to enter the market of the selected currency pair in a trend and with minimal risk. The Cryo indicator was created on the basis of the original indicators for searching for extremes, the indicator is well suited for determining a reversal or a large sharp je
该产品的买家也购买
TPSpro RFI Levels MT5
Roman Podpora
4.73 (11)
指示       俄罗斯 -        英语   建议 与指示器一起使用     -       TPSpro 趋势专业版 -   MT4版本       交易中的一个关键要素是做出买卖交易工具决定的区域或水平。尽管主要参与者试图隐藏他们在市场中的存在,但他们不可避免地会留下痕迹。我们的任务是学习如何识别这些痕迹并正确解释它们。 主要功能: 向卖家和买家显示活跃区域! 该指标显示所有正确的初始买入和卖出脉冲水平/区域。激活这些水平/区域后,开始寻找切入点,水平会改变颜色并填充特定阴影。此外,还会显示箭头,以便更直观地了解情况。 显示更高时间范围内的级别/区域(MTF 模式) 添加了使用更高时间间隔显示级别/区域的功能。此外,该指标还具有自动趋势检测功能(   TPSproTREND PRO   )。 用于交易的单独专业的逐步算法。 该算法专为日内交易而设计,既可顺势交易,也可逆势交易。每个活动模板均提供详细说明。 适用于多种时间范围 。 TPSpro RFI 水平指标可用于图表上的任何时间范围,从一分钟(M1)开始一直到每月(MN)。 图形和声音警报。 该指标提供图形和声音指示
Atomic Analyst MT5
Issam Kassas
4.42 (19)
首先值得强调的是,该交易指标是非重绘、非延迟的指标,这使其成为手动和机器人交易的理想选择。 用户手册:设置、输入和策略。 Atomic Analyst是一种PA价格行动指标,利用价格的力量和动量来寻找市场上更好的机会。配备了高级过滤器,可帮助去除噪音和假信号,并提高交易潜力。使用多层复杂的指标,Atomic Analyst扫描图表,并将复杂的数学计算转化为任何初学者都能理解并用来做出一致交易决策的简单信号和颜色。 “Atomic Analyst”是专为新手和经验丰富的交易者量身定制的综合交易解决方案。它将高级指标和一流功能融合为一体的交易策略,使其成为所有类型交易者的多功能选择。 日内交易和剥头皮策略:专为快速准确的日内交易和短期交易而设计。 日内和摆动交易策略:可用作追求价格大幅波动的日内和摆动交易者的可靠工具。 多货币和市场:凭借其可靠的精度,在不同的工具和市场上运作。 多个时间框架:可在多个时间框架上使用,性能良好。 稳定性:所有指标均不重绘、不重绘和不滞后,确保可靠的信号。 信号清晰度:提供箭头信号,用于清晰的入场和出场点。 实时警报:通过交易入场、SL和TP警报通知交
首先,值得强调的是,这个交易系统是一个非重绘、非重画和非滞后的指标,这使得它非常适合手动和机器人交易。 在线课程,手册和下载预设。 “智能趋势交易系统 MT5”是专为新手和经验丰富的交易者量身定制的综合交易解决方案。它结合了超过 10 个优质指标,具有 7 多个强大的交易策略,使其成为适用于各种市场条件的多功能选择。 趋势跟随策略:提供精确的入场和止损管理,以有效地跟随趋势。 反转策略:识别潜在的趋势反转,使交易者能够利用区域市场的机会。 剃头策略:专为快速准确的日内交易和短期交易而设计。 稳定性:所有指标都不会重绘、不会重画和不会滞后,确保可靠的信号。 定制:支持自定义策略,以满足个人交易偏好。超过 7 种策略和组合可帮助您找到最佳策略。 信号清晰度:提供箭头信号,以指示清晰的入场和退出点。 实时警报:通过交易进出警报使交易者保持了解。 深入分析:提供更高时间框架的趋势分析和实时交易监控。 自适应颜色编码:利用蜡烛颜色编码来显示成交量、趋势和反转蜡烛信号。通过蜡烛颜色分析市场方向。 “智能趋势交易系统 MT5”赋予交易者必要的工具,以便在各种市场条件下做出明智和战略性的交易决策。无论
FX Power MT5 NG
Daniel Stein
5 (5)
通过 mql5 和 Telegram 上 的晨间简报获取每日市场更新,包括详细信息和屏幕截图 ! FX Power MT5 NG 是我们长期以来非常受欢迎的货币强度计算器 FX Power 的下一代产品。 这款下一代强度计算器能提供什么?您所喜爱的原版 FX Power 的所有功能 附加功能 黄金/XAU 强度分析 更精确的计算结果 可单独配置的分析周期 可自定义计算限制,以获得更好的性能 为希望查看更多信息的用户提供特殊的多实例设置 无尽的图形设置,可在每个图表中设置您最喜欢的颜色 无数的通知选项,让您再也不会错过任何重要信息 采用 Windows 11 和 macOS 风格的全新圆角设计 神奇的移动指标面板 FX Power 主要功能 所有主要货币的完整强势历史 所有时间框架内的货币强弱历史 所有经纪商和图表的计算结果完全相同 100% 可靠的实时计算 -> 无重绘 可通过下拉列表选择分析时段 通过自定义模式单独配置分析时段 可在一个图表中使用多个实例 可移动 FX Power 显示屏(通过拖放) 适用于高分辨率 QHD、UHD 和 4K 显示器 自动终端配置 针对平板电脑
Quantum Trend Sniper
Bogdan Ion Puscasu
4.8 (49)
介绍   量子趋势狙击指标 ,突破性的 MQL5 指标,正在改变您识别和交易趋势反转的方式!由拥有超过13年交易经验的资深交易员团队开发,     量子趋势狙击指标   旨在通过其创新的方式以极高的准确度识别趋势反转,将您的交易之旅推向新的高度。 ***购买量子趋势狙击指标,即可免费获得量子突破指标!*** 当量子突破指标识别出趋势反转时,它会向您发出警报和信号箭头,并建议您三个止盈水平。 它既适合新手交易者,也适合专业交易者。 量子 EA 通道:       点击这里 MT4版本:       点击这里 建议: 时间范围: 所有时间范围。为了获得最佳结果,我们建议在 M15、M30 和 H1 时间范围内使用它。 货币对:欧元兑美元、英镑兑美元、澳元兑美元、欧元兑英镑、, EURAUD,  XAUUSD 账户类型:ECN、Raw 或 Razor,点差极低 经纪时间:任意 经纪商:IC Markets、Pepperstone with Raw 和 Razor 的点差最低 建议止损:50 点 建议止盈水平:20 点、50 点和
该仪表盘显示所选符号的最新可用谐波形态,因此您可以节省时间并提高效率 /  MT4 版本 。 免费指标:  Basic Harmonic Pattern 指标列 Symbol:   显示所选符号 Trend:     看涨或看跌 Pattern:    形态类型(Gartley、蝴蝶、蝙蝠、螃蟹、鲨鱼、Cypher 或 ABCD) Entry:     入口价格 SL: 止损价 TP1: 第一止盈价 TP2: 第二次获利价格 TP3: 第三次获利价格 Current price:    当前价格 Age (in bars):   最后绘制的模式的年龄 主要输入 Symbols :   从 "28 种主要货币对 "或 "选定符号 "中选择。 Selected Symbols :   希望监控的符号,用逗号分隔("EURUSD,GBPUSD,XAUUSD")。如果您的经纪商为货币对设置了后缀或前缀,您必须在以下两个参数中添加(货币对前缀或货币对后缀)。 Max Iteration:   调整模式的最大迭代次数(如果该值越小,则模式越少,性能越快;如果该值越大,则模式越多,性能
AT Forex Indicator MT5
Marzena Maria Szmit
5 (4)
The AT Forex Indicator MT5 is a sophisticated trading tool designed to provide traders with a comprehensive analysis of multiple currency pairs. This powerful indicator simplifies the complex nature of the forex market, making it accessible for both novice and experienced traders. AT Forex Indicator uses advanced algorithms to detect trends, patterns and is an essential tool for traders aiming to enhance their forex trading performance. With its robust features, ease of use, and reliable signal
TrendMaestro5
Stefano Frisetti
note: this indicator is for METATRADER4, if you want the version for METATRADER5 this is the link:  https://www.mql5.com/it/market/product/108106 TRENDMAESTRO ver 2.4 TRENDMAESTRO recognizes a new TREND in the bud, he never makes mistakes. The certainty of identifying a new TREND is priceless. DESCRIPTION TRENDMAESTRO identifies a new TREND in the bud, this indicator examines the volatility, volumes and momentum to identify the moment in which there is an explosion of one or more of these data a
TPA True Price Action indicator reveals the true price action of the market makers through 100% non-repainting signals strictly at the close of a candle! TPA shows entries and re-entries, every time the bulls are definitely stronger than the bears and vice versa. Not to confuse with red/green candles. The shift of power gets confirmed at the earliest stage and is ONE exit strategy of several. There are available now two free parts of the TPA User Guide for our customers. The first "The Basics"
Matrix Arrow Indicator MT5
Juvenille Emperor Limited
5 (12)
矩阵箭头指标 MT5   是一种独特的 10 合 1 趋势,遵循   100% 非重绘多时间框架指标 ,可用于所有符号/工具: 外汇 、 商品 、 加密货币 、 指数 、 股票 。 Matrix Arrow Indicator MT5 将在其早期阶段确定当前趋势,从多达 10 个标准指标中收集信息和数据,它们是: 平均定向运动指数 (ADX) 商品渠道指数 (CCI) 经典 Heiken Ashi 蜡烛 移动平均线 移动平均收敛散度 (MACD) 相对活力指数 (RVI) 相对强弱指数 (RSI) 抛物线SAR 随机振荡器 威廉姆斯的百分比范围 当所有指标给出有效的买入或卖出信号时,相应的箭头将打印在图表上,在下一根蜡烛/柱线开盘时,指示强劲的上升趋势/下降趋势。用户可以选择使用哪些指标,并可以单独调整每个指标的参数。 Matrix Arrow Indicator MT5 仅从选定的指标中收集信息,并仅根据其数据打印箭头。   Matrix Arrow Indicator MT5   还可以为所有新信号发送终端、推送通知或电子邮件警报。无论您是黄牛、日内交易者还是波段交易者, Mat
Entry Points Pro for MT5
Yury Orlov
4.46 (124)
这款指标用于 MT5,可提供准确的入场交易信号,且无重绘。 它可应用在任何金融资产:外汇、加密货币、贵金属、股票、指数。 它将提供极其精准的评估,并告诉您何时开仓和平仓的最佳时机。 观看 视频 (6:22),其中包含一个仅处理单一信号的示例,该信号即可值回指标购价! 大多数交易者在 Entry Points Pro 指标的帮助下,在第一个交易周内即改善了他们的交易结果。 订阅我们的 Telegram 群 ! Entry Points Pro 指标的益处。 入场信号无重绘 如果信号出现,并得到确认,则它不会再消失;不像是重绘指标,它会导致重大的财产损失,因为它们可以在显示信号后再将其删除。 无差错开仓 指标算法可令您找到入场交易(买入或卖出资产)的理想时机,从而提高每位交易者的成功率。 Entry Points Pro 可操作任何资产 它允许您在 MT5 平台上交易任何经纪商的加密货币、股票、贵金属、指数、大宗商品和货币。 提供任何方向的信号 Entry Points Pro 指标提供针对任意价格走势的入场交易信号 - 上涨、下跌或横盘(横向)。
Blahtech Supply Demand MT5
Blahtech Limited
4.54 (13)
Was: $299  Now: $99   Supply Demand uses previous price action to identify potential imbalances between buyers and sellers. The key is to identify the better odds zones, not just the untouched ones. Blahtech Supply Demand indicator delivers functionality previously unavailable on any trading platform. This 4-in-1 indicator not only highlights the higher probability zones using a multi-criteria strength engine, but also combines it with multi-timeframe trend analysis, previously confirmed swings
Advanced Supply Demand MT5
Bernhard Schweigert
4.5 (14)
任何新手或专业交易者的最佳解决方案! 该指标是一款独特、高质量、且价格合理的交易工具,因为我们已经整合了许多专有功能和新公式。 依据此更新,您将能够显示双重时间帧区域。 您不仅可以显示一个较高的时间帧,还可以同时显示图表时间帧,加上更高的时间帧:显示嵌套时区。 供需双方所有交易者都会喜欢它。 :) 重要信息披露 高级供需的最大潜力,请访问 https://www.mql5.com/zh/blogs/post/720245   想象您的交易如何得以改善,是因为您能够精准定位入场或目标位吗? 构建于新的底层算法,它可以更轻松地识别出买卖双方之间的潜在失衡。 这是因为它以图形方式展示供需最强劲区域,及其过去的表现(显示旧区域)。 这些功能旨在帮助您更轻松地发现最佳入场区域和价位。 现在您可以针对您的交易品种和时间帧来优化和编辑区域强度! 高级供需指标适用于所有产品和时间帧。 它是一个新的公式,非常新的功能是两个区域强度函数可由用户输入进行调整! 这在交易中是一大优势。 当您学习如何使用专有功能,例如带有价格游离最小 X 因子的区域强度时,您能够判断该区域强劲与否。 供需区域用作警报触发器
XQ Indicator MetaTrader 5
Marzena Maria Szmit
3 (2)
Step into the realm of Forex trading with confidence and precision using XQ, a cutting-edge Forex indicator designed to elevate your trading game to unprecedented heights. Whether you're a seasoned trader or just stepping into the world of currency exchange, XQ Forex Indicator empowers you with the insights and signals needed to make informed trading decisions. The signal conditions are a combination of three indicators, and XQ Forex Indicator only display  medium and long-term trends . The ind
PZ Swing Trading MT5
PZ TRADING SLU
5 (4)
Swing Trading 是第一个旨在检测趋势方向的波动和可能的反转波动的指标。它使用在交易文献中广泛描述的基准摆动交易方法。该指标研究多个价格和时间向量,以追踪总体趋势方向,并检测市场超卖或超买并准备好进行修正的情况。 [ 安装指南 | 更新指南 | 故障排除 | 常见问题 | 所有产品 ] 市场波动的利润不会被窃取 指示器始终显示趋势方向 彩色价格带代表机会基准 彩色虚线表示可能的反转波动 该指标分析其自身的质量和性能 它实现了一个多时间仪表板 可定制的趋势和波动周期 它实现了电子邮件/声音/推送警报 指示器为非重涂或重涂 什么是摇摆交易 摇摆交易是一种尝试在一天到一周内从证券中获得收益的交易方式,尽管某些交易最终可以保持更长的寿命。摇摆交易者使用技术分析来买入弱点和卖出力量,并有耐心等待这些机会的发生,因为在发生一波抛售浪潮之后购买证券而不是陷入抛售更有意义。 机会基准 关于历史数据的大量研究证明,适合于波动交易的市场倾向于在基线价格带上下交易,基线价格带由图表显示,使用平均真实区间计算得出。波动交易者使用基线,该策略是购买常态和卖出躁狂,或做空常态并掩盖沮丧。
可以说,这是您可以为MetaTrader平台找到的最完整的谐波价格形成自动识别指标。它检测19种不同的模式,像您一样认真对待斐波那契投影,显示潜在的反转区域(PRZ),并找到合适的止损和获利水平。 [ 安装指南 | 更新指南 | 故障排除 | 常见问题 | 所有产品 ] 它检测19种不同的谐波价格形态 它绘制了主要,衍生和互补的斐波那契投影(PRZ) 它评估过去的价格走势并显示每个过去的形态 该指标分析其自身的质量和性能 它显示合适的止损和获利水平 它使用突破来表明合适的交易 它在图表上绘制所有样式比率 它实现了电子邮件/声音/视觉警报 受斯科特·M·卡尼(Scott M. Carney)的书的启发,该指标旨在满足最纯粹和最熟练的交易者的需求。但是,它采取了一种使交易更容易的方式:在向交易发出信号之前,它会等待Donchian朝正确方向突破,从而使交易信号非常可靠。 斐波那契投影与向量无关 它实现了电子邮件/声音/推送警报 它绘制了ABCD投影 重要提示: 为了符合 Scott M. Carney先生 的商标申诉,某些图案名称已重命名为不言自明的替代方式, Scot
FX Volume MT5
Daniel Stein
4.93 (14)
通过 mql5 和 Telegram 上 的 " 晨间简报 "获取每日市场更新,包括详细信息和屏幕截图 ! 外汇交易量(FX Volume)是第一个也是唯一一个从经纪商角度真正洞察市场情绪的交易量指标。 直接在您的图表上看到这些信息是真正改变游戏规则和突破性的交易解决方案。 受益于独特的市场数据洞察,如 比率(Ratios )显示货币多头和空头头寸的比率(百分比 比率变化 显示所选时间段内的多头比率及其百分比变化 总交易量 显示货币的总交易量(多头和空头),以手为单位 多头 交易量显示货币所有多头头寸的交易量 空头 交易量显示所有货币空头头寸的交易量 净多头 显示净多头交易量,即所有多头头寸减去所有空头头寸(以手为单位)。 净多头百分比 显示货币净多头交易量的变化 请阅读我们的基本教程 -> "如何使用外汇交易量进行交易 " 获取更多信息,如常见问题、交易技巧和教程视频,请访问我们的 外汇交易量公共信息频道 请 安装并运行 SI Connect 以建立与我们数据中心的持续连接 背景信息 我们都知道,外汇是一个分散的市场。这就是为什么我们必须打破常规思维,开发一个独
Noize Absorption Index
Ekaterina Saltykova
Noize Absorption Index - is the manual trading system that measures the difference of pressure between bears forces and bulls forces. Green line - is a noize free index that showing curent situation. Zero value of index shows totally choppy/flat market.Values above zero level shows how powerfull bullish wave is and values below zero measures bearish forces.Up arrow appears on bearish market when it's ready to reverse, dn arrow appears on weak bullish market, as a result of reverse expectation.
PZ Support Resistance MT5
PZ TRADING SLU
4.17 (6)
厌倦了绘制支撑线和阻力线? 支撑阻力 是一个多时间指标,可以自动检测并绘制图表中的支撑线和阻力线,并具有非常有趣的变化:随着时间的推移测试价格水平及其重要性的提高,线变得越来越粗。 [ 安装指南 | 更新指南 | 故障排除 | 常见问题 | 所有产品 ] 一夜之间增强您的技术分析 无需浏览图表即可检测重要的价格水平 一目了然地识别所有价格水平的相对优势 每次交易最多可节省半小时的绘图线 指标显示所有价格水平的期限 指示器不重涂 过去和现在的价格水平因接近程度而崩溃,并根据当前的市场行为进行了调整。在动作发生的地方绘制了线条,而不一定在峰值处绘制了线条。 价格水平随着时间的推移而被拒绝,变得越来越暗 定期清除不重要的价格水平以避免噪音 可自定义的时间范围选择和崩溃因子 它实现了电子邮件/声音/推送警报的突破 输入参数 指标设置:指标将从当前时间段读取价格,但您可以选择另一个。例如,您可以在H4图表中显示D1支撑线和阻力线。您还可以使用 价格水平密度 参数选择在图表上显示多少价格水平。 颜色设置:根据重要性输入所需的支撑线和阻力线颜色。 标签设置:(可选)可以在指示器
Gold Trend 5
Sergei Linskii
5 (1)
黄金趋势 - 这是一个很好的股票技术指标。该指标算法分析资产的价格走势,并反映波动性和潜在进入区。 最佳指标信号: - 卖出 = 红色柱状图 + 红色短指针 + 同方向黄色信号箭头。 - 买入 = 蓝色柱状图 + 蓝色多头指针 + 同方向水蓝色信号箭头。 该指标的优点 1. 该指标生成的信号准确度高。 2. 只有当趋势发生变化时,才能重新绘制已确认的箭头信号。 3. 您可以在任何经纪商的 MetaTrader 5 交易平台上进行交易。 4. 您可以交易任何资产(货币、金属、加密货币、股票、指数等)。 5. 最好在 H1 时间框架(中期交易)上进行交易。 6. 在指标设置中可更改个别参数(TF、颜色等),以便每位交易者都能轻松定制适合自己的指标。 7. 该指标既可作为交易系统的主要补充,也可作为独立的交易系统使用。   注意:交易的入市准确性和盈利能力仅取决于交易者的技能。任何指标都只是交易者的助手,而非行动指南。 MetaTrader 4 黄金趋势指标版本  祝大家交易好运,稳定盈利!
该仪表盘可根据您对所选符号的交易策略,以剥头皮和长期模式在图表上发现并显示供需区。此外,仪表盘的扫描模式可帮助您一目了然地检查所有需要的符号,不错过任何合适的仓位/ MT4 版本 免费指标: Basic Supply Demand 功能 允许您查看多个货币对的交易机会,为您提供所有货币对的清晰简明视图,并根据其与供需区的接近程度进行排序 可定制设置,从颜色到检测参数,满足您的特定需求 主要输入 Indicator mode : 选择指标模式或具有新功能的面板模式 Symbols : 从 "28 种主要货币对 "或 "选定符号 "中进行选择 Selected Symbols : 您希望监控的符号,用逗号分隔("EURUSD,GBPUSD,XAUUSD")。如果您的经纪商对货币对有后缀或前缀,您必须在以下两个参数中添加(货币对前缀或货币对后缀) Trading Style : 选择剥头皮或长期模式 Allowed Deviation : 该参数允许修改需求或供应区域的精确度(数值越小,精确度越高) Zone   thickness : 通过该参数可以修改需求和供应
Price Action Finder Multi MT5
Siarhei Vashchylka
5 (5)
The Price Action Finder Multi indicator is an indicator of entry points that searches for and displays Price Action system patterns on dozens of trading instruments and on all standard time frames: (m1, m5, m15, m30, H1, H4, D1, Wk, Mn). The indicator places the found patterns in a table at the bottom of the screen. By clicking on the pattern names in the table, you can move to the chart where this pattern is located. Manual (Be sure to read before purchasing) | Version for MT4 Advantages 1. Pa
Automated Trendlines MT5
Georgios Kalomoiropoulos
趋势线是外汇交易中最重要的技术分析工具。不幸的是,大多数交易者没有正确绘制它们。自动趋势线指标是专业交易者的专业工具,可帮助您可视化市场的趋势运动。 有两种类型的趋势线看涨趋势线和看跌趋势线。 在上升趋势中,外汇趋势线是通过价格变动的最低摆动点绘制的。 连接至少两个“最低点”将创建一条趋势线。 在下跌趋势中,趋势线是通过价格走势的最高摆动点绘制的。 连接至少两个“最高点”将创建一条趋势线。 趋势线何时突破? 当看跌蜡烛收于看涨​​趋势线下方并且蜡烛的高点在趋势线上方时,看涨趋势线会被打破。 当看涨蜡烛收于看跌趋势线上方并且蜡烛的低点低于趋势线时,看跌趋势线会被打破。 趋势线何时删除? 当一根完整的蜡烛在看涨趋势线下方形成时,看涨趋势线将被删除。 当完整的蜡烛在看跌趋势线上方形成时,看跌趋势线将被删除。 您可以从输入参数更改看涨和看跌趋势线的颜色和宽度。
Blahtech Market Profile MT5
Blahtech Limited
5 (9)
Was: $249  Now: $99   Market Profile defines a number of day types that can help the trader to determine market behaviour. A key feature is the Value Area, representing the range of price action where 70% of trading took place. Understanding the Value Area can give traders valuable insight into market direction and establish the higher odds trade. It is an excellent addition to any system you may be using. Inspired by Jim Dalton’s book “Mind Over Markets”, this indicator is designed to suit the
Order Block Hunter MT5
Noha Mohamed Fathy Younes Badr
5 (1)
Order block hunter indicator is the best indicator for  hunt the order blocks that area where there has been a large concentration of limit orders waiting to be executed Order blocks are identified on a chart by observing previous price action and looking for areas where the price experienced significant movement or sudden changes in direction .This indicator does that for you by using very complicated codes and helps you to take the best areas To buy and sell because it make marks at the best a
MetaForecast M5
Vahidreza Heidar Gholami
5 (2)
MetaForecast能够根据价格数据中的谐波来预测和可视化任何市场的未来走势。虽然市场不总是可预测的,但如果价格中存在模式,MetaForecast可以尽可能准确地预测未来。与其他类似产品相比,MetaForecast通过分析市场趋势可以生成更精确的结果。 输入参数 Past size (过去的尺寸) 指定MetaForecast用于创建生成未来预测模型的柱数量。该模型以一条黄色线绘制在所选柱上。 Future size (未来的尺寸) 指定应预测的未来柱数量。预测的未来以粉色线表示,并在其上绘制了蓝色回归线。 Degree (程度) 此输入确定了MetaForecast将在市场上进行的分析级别。 Degree 描述  0 对于程度0,建议使用较大的值来设置“过去的尺寸”输入,以覆盖价格中的所有高峰、低谷和细节。  1 (建议的) 对于程度1,MetaForecast可以理解趋势,并通过较小的“过去的尺寸”生成更好的结果。  2 对于程度2,除了趋势,MetaForecast还可以识别反转点。对于大于1的程度,必须使用较高的“细节”和“噪音减少”输入值。  大于2 不建议使用大
Golden Spikes Premium
Kwaku Bondzie Ghartey
Golden Spikes Detector Acknowledgement and Dedications:  The name of this indicator was Inspired by an Original; Mr Grant Koopman; a Knowledgeable and experienced Synthetics trader. I dedicate this indicator to Mr Grant.  Overview: The Golden Spikes Premium is a groundbreaking trading indicator meticulously crafted for the Boom and Crash indices on the Deriv market. Tailored to meet the needs of discerning traders, this powerful tool operates exclusively on the one-minute timeframe, providin
Market Overview MT5
Mehran Sepah Mansoor
使用我们的市场强度和情绪指标优化您的交易决策,不再逆势交易! 我们的指标专为重视准确及时信息的严肃交易者精心设计,以非常简单的方式提供 28 种主要货币对的鸟瞰图。该工具可根据货币对的受欢迎程度、看涨或看跌趋势的强度以及买方和卖方的百分比 (MT4 版本) 对货币对进行排名。 功能特点 实时趋势强度: 准确评估每种货币对的趋势强度,为识别交易机会提供可靠指导。 买卖双方分析: 通过我们对每种货币对的买卖双方实力排名,即时洞察市场动态,让您预测重要走势。 交易者兴趣: 获取每种货币对的交易者兴趣和活动数据,帮助您更好地了解新兴趋势和潜在转折点。 直观且可定制的仪表盘: 我们的仪表板易于使用,您可以根据自己的喜好自定义显示,让您对相关信息一目了然。 实时更新: 实时更新让您随时了解市场变化,确保您不会错过任何有利可图的机会。 指标栏 Symbol:  点击此栏,符号将按字母顺序排序。 Popularity:  点击此栏,将按照交易者对该交易货币对的兴趣顺序进行排序。 Strength:  点击此栏,货币对将按照趋势排序(正数表示上升趋势,负数表示下降趋势)。 Bu
Boom and Crash Trend Detector is a  Non-Repaint   MT5 trading system usually being sold for 50 0$ . Most people use this for Deriv but can be used to forex too. The boom and crash spike indicator is a spike detecting software, with Multiple features, these features include. Spike Alert ( from 10 to 100-second warning before spike) Continues spike Alert (for double or continuous spikes at a time) supports all Boom/crash Indices M6 time frame works best here . Bigger time frame trend pointer f
作者的更多信息
选择StopLoss和TakeProfit的水平会对交易的整体表现产生非常强烈的影响。除了交易交易的明显参数 - 可能获胜或可能亏损的大小 - 止损和止盈的水平也会影响交易的预期持续时间以及一般交易的盈利能力。 如果您已使用“ AIS-ODT ”脚本确定了最佳事务持续时间,则可以开始确定与StopLoss和TakeProfit级别关联的参数。 为此,我们按以下步骤操作。首先,我们将确定在一个方向或另一个方向上的所有可能的价格偏差,并计算在一定时间内实现它们的概率。之后,您可以根据其大小,概率和预期利润值计算StopLoss和TakeProfit的最佳水平。 为此,请在感兴趣的货币对的图表和所需的时间范围内运行脚本。使用属性窗口中的ILB参数,设置交易仓位的期望持续时间,以柱数表示。在实用程序的工作期间,分析整个历史记录的数据,并选择最佳值。在脚本结束时,形成了两个文件 - “Buy.csv”和“Sell.csv”,其中包含获得结果的表 - 图1。 在表格的第一列中,指示了可能的TakeProfit大小,在第二列中,指示了最佳的StopLoss大小。第三列显示以百分比表示获胜这些参数的概
FREE
该脚本基于使用随机数生成器模拟贸易交易。即使使用相同的输入参数,这也可以使您获得完全不同的结果。运行脚本时,将打开一个对话框,您可以在其中设置外部变量的所需值。 在块中,TradingOptions定义了模拟交易所需的基本参数。 StartBalance  - 设置交易余额的初始大小。 NumberTrade  - 设置脚本运行时将建模的交易事务数。为了获得或多或少的显着结果,该参数必须大于30。 ProbabilityWinning  - 获胜交易的概率。表示为百分比,有效值为1到99。 Min.StopLoss  - 表示以点为单位的最小StopLoss值,将在建模交易操作时使用。 Max.StopLoss  - 以磅为单位设置StopLoss的最大值。 PositiveWin。 - 该变量建立修正,借助于该修正在模拟交易中获得积极的期望。 脚本的工作是执行以下操作。首先,计算获胜交易的预期概率 -  PW。之后,随机设置StopLoss的值,该值将在此事务中使用。考虑到预期收益应为正数,计算TakeProfit规模。考虑到点值,TakeProfit和StopLoss水平将转换为
FREE
This script allows selecting the TakeProfit and StopLoss levels. It analyzes the history data, and then calculates the probability of reaching a given price level. How the script works Suppose you have a trading strategy and you want to select the TakeProfit and StopLoss levels. Run the script and set the parameter: Number of Bars - the average position holding time in bars. Once the script operation is complete, the AIS-PPL.csv file will be created in the Files folder in the terminal data cat
FREE
The script allows selecting the required 'Filter level' value of the AIS-MTF indicator. Run the script on the required chart and selected timeframe. Once its operation is complete, the HPS.csv file will be created in the Files folder. Open the file. You will see three columns. The 'Filter lvl' column represents the value of the 'Filter level' for the AIS-MTF indicator. Am. dev. - degree and direction of the indicator's deviation from the price level (sorted in ascending order). Negative values i
FREE
MinDeposit
Aleksej Poljakov
5 (1)
The script analyzes the history of quotes and gives recommendations on the minimum deposit. The calculations take into account the variability of prices and the standard deviation. Margin requirements for the instrument are also taken into account. The result of the script is the minimum recommended deposit for trading the given currency pair.
FREE
该脚本的设计使交易者可以确定交易交易的平均持续时间,在此期间可能的利润和损失的比率将是最佳的。 首先,让我们看一下确定贸易交易最佳持续时间的一般方法。我们介绍以下变量: R - 交易的结果; T - 交易开放的时间; W - 上一笔交易结束与下一交易开盘之间的时间。 每个交易者都努力在最短的时间内获得最大的利润。这种愿望可以通过以下简单表达来描述: R/(T+W)→max 。 很明显,变量 T 和 W 取决于交易的总持续时间和交易数量。设 ATD 是交易的平均持续时间, N 是交易总数。然后,交易的平均持续时间应与其总数的平方根成比例增长,即: ATD~√N 。 但是,有一些有根据的问题出现 - 任何交易持续时间等同于其他交易持续时间,交易持续时间如何影响交易操作的结果?为了得到所提问题的答案,我们将对历史数据的价格行为进行一项小型研究。 我们继续如下。我们将历史数据划分为由一定数量的柱组成的系列,对应于交易的平均持续时间。在每个这样的系列中,我们计算最大价格变动,我们将引用更大的偏差 StopLoss ,并且更小 - 到 TakeProfit 。 之后,我们将计算整个历史中价格范围的
FREE
选择StopLoss和TakeProfit的水平会对交易的整体表现产生非常强烈的影响。除了交易交易的明显参数 - 可能获胜或可能亏损的大小 - 止损和止盈的水平也会影响交易的预期持续时间以及一般交易的盈利能力。 如果您已使用“ AIS-ODT ”脚本确定了最佳事务持续时间,则可以开始确定与StopLoss和TakeProfit级别关联的参数。 为此,我们按以下步骤操作。首先,我们将确定在一个方向或另一个方向上的所有可能的价格偏差,并计算在一定时间内实现它们的概率。之后,您可以根据其大小,概率和预期利润值计算StopLoss和TakeProfit的最佳水平。 为此,请在感兴趣的货币对的图表和所需的时间范围内运行脚本。使用属性窗口中的ILB参数,设置交易仓位的期望持续时间,以柱数表示。在实用程序的工作期间,分析整个历史记录的数据,并选择最佳值。在脚本结束时,形成了两个文件 - “Buy.csv”和“Sell.csv”,其中包含获得结果的表 - 图1。 在表格的第一列中,指示了可能的TakeProfit大小,在第二列中,指示了最佳的StopLoss大小。第三列显示以百分比表示获胜这些参数的概
FREE
该脚本基于使用随机数生成器模拟贸易交易。即使使用相同的输入参数,这也可以使您获得完全不同的结果。运行脚本时,将打开一个对话框,您可以在其中设置外部变量的所需值。 在块中,TradingOptions定义了模拟交易所需的基本参数。 StartBalance  - 设置交易余额的初始大小。 NumberTrade  - 设置脚本运行时将建模的交易事务数。为了获得或多或少的显着结果,该参数必须大于30。 ProbabilityWinning  - 获胜交易的概率。表示为百分比,有效值为1到99。 Min.StopLoss  - 表示以点为单位的最小StopLoss值,将在建模交易操作时使用。 Max.StopLoss  - 以磅为单位设置StopLoss的最大值。 PositiveWin。 - 该变量建立修正,借助于该修正在模拟交易中获得积极的期望。 脚本的工作是执行以下操作。首先,计算获胜交易的预期概率 -  PW。之后,随机设置StopLoss的值,该值将在此事务中使用。考虑到预期收益应为正数,计算TakeProfit规模。考虑到点值,TakeProfit和StopLoss水平将转换为
FREE
MinDeposit MT5
Aleksej Poljakov
3 (1)
The script analyzes the history of quotes and gives recommendations on the minimum deposit. The calculations take into account the variability of prices and the standard deviation. Margin requirements for the instrument are also taken into account. The result of the script is the minimum recommended deposit for trading the given currency pair.
FREE
该脚本的设计使交易者可以确定交易交易的平均持续时间,在此期间可能的利润和损失的比率将是最佳的。 首先,让我们看一下确定贸易交易最佳持续时间的一般方法。我们介绍以下变量: R  - 交易的结果; T  - 交易开放的时间; W  - 上一笔交易结束与下一交易开盘之间的时间。 每个交易者都努力在最短的时间内获得最大的利润。这种愿望可以通过以下简单表达来描述: R/(T+W)→max 。 很明显,变量  T  和  W  取决于交易的总持续时间和交易数量。设  ATD  是交易的平均持续时间, N  是交易总数。然后,交易的平均持续时间应与其总数的平方根成比例增长,即: ATD~√N 。 但是,有一些有根据的问题出现 - 任何交易持续时间等同于其他交易持续时间,交易持续时间如何影响交易操作的结果?为了得到所提问题的答案,我们将对历史数据的价格行为进行一项小型研究。 我们继续如下。我们将历史数据划分为由一定数量的柱组成的系列,对应于交易的平均持续时间。在每个这样的系列中,我们计算最大价格变动,我们将引用更大的偏差  StopLoss ,并且更小 - 到 TakeProfit 。 之后,我们将计
FREE
This script allows selecting the TakeProfit and StopLoss levels. It analyzes the history data, and then calculates the probability of reaching a given price level. How the script works Suppose you have a trading strategy and you want to select the TakeProfit and StopLoss levels. Run the script and set the parameter: Number of Bars - the average position holding time in bars. Once the script operation is complete, the AIS-PPL.csv file will be created in the Files folder in the terminal data cat
FREE
The script allows selecting the required 'Filter level' value of the AIS-MTF MT5 indicator. Run the script on the required chart and selected timeframe. Once its operation is complete, the HPS.csv file will be created in the Files folder. Open the file. You will see three columns. The 'Filter lvl' column represents the value of the 'Filter level' for the AIS-MTF indicator. Am. dev. - degree and direction of the indicator's deviation from the price level (sorted in ascending order). Negative valu
FREE
AIS 正确平均线指标允许您设置市场趋势运动的开始。该指标的另一个重要品质是趋势结束的明确信号。指标不会重新绘制或重新计算。 显示值 h_AE - AE 通道的上限 l_AE - AE通道的下限 h_EC - 当前柱的高预测值 l_EC - 当前柱的低预测值 使用指标时的信号 主要信号是通道AE和EC的交点。 当 l_EC 线高于 h_AE 线时,可能会开始上升趋势。 在 h_EC 线低于 l_AE 线之后,可以预期下降趋势的开始。 在这种情况下,应注意 h_AE 和 l_AE 线之间的通道宽度。它们之间的差异越大,趋势就越强。您还应该注意 AE 通道实现的局部高点/低点。这时,价格变化的趋势变得最强。 可定制的指标参数 设置指标包括根据时间范围选择 LRH 参数。此参数的有效值范围为 1 到 350。 此参数越小,指标越敏感,错误信号的增加可能。另一方面,此参数不应设置得太高,因为指标会变得不那么敏感并会跳过信号。
AIS Weighted_Moving_Average 指标计算加权移动平均线,并允许您确定趋势市场运动的开始。 权重系数的计算考虑了每个柱的具体特征。这使您可以过滤掉随机的市场走势。 确认趋势开始的主要信号是指标线方向的变化和穿过指标线的价格。 WH(蓝线)是高价的加权平均值。 WL(红线)是最低价的加权平均值。 WS(绿线)是所有价格点的加权平均值。 选项 LH - 计算值的柱数。 要快速选择 LH,您首先需要检查是较高时间范围的倍数的值。 例如,指标设置为 M15。 然后我们检查以下LH的值 周期 M30/M15 = 2 期间 H1/M15 = 4 期间 H4/M15 = 16 周期 D1/M15 = 96 周期 W1/M15 = 480 它们之间的值也可能是有趣的。
AIS Advanced Grade Feasibility 指标旨在预测未来价格可能达到的水平。他的工作是分析最后三个柱形图并在此基础上进行预测。该指标可用于任何时间范围和任何货币对。在设置的帮助下,您可以达到预期的预测质量。 预测深度 - 以条形图设置所需的预测深度。建议在 18-31 内选择此参数。 你可以超越这些限制。但在这种情况下,预测水平的“固定”是可能的(对于小于 18 的值),或者水平宽度过大(对于大于 31 的值)。 置信水平 1、置信水平 2 和置信水平 3 - 预测置信水平。可在 1-99 范围内设置。置信度 1 应该大于置信度 2,置信度 3 应该是最小的。 这些水平中的每一个都显示价格将达到此值的概率百分比,该值由预测深度参数确定的柱线数量决定。 Color lvl high 和 Color lvl low - 允许您选择线条的颜色 Style lvl - 允许您选择与级别对应的线条样式 宽度 lvl - 设置与级别对应的线的宽度
The indicator is designed to measure the price volatility. This allows determining the moments for opening or closing trade positions more accurately. High intensity of the market indicates the instability of its movement, but allows for better results. And, conversely, low intensity of the market indicates the stability of its movement. Parameters Bars to process - the number of bars to measure the price movements. A low value of this parameter allows determining the moments of rapid price mo
This indicator uses the Fibonacci p-numbers to smooth a price series. This allows combining the advantages of the simple and exponential moving averages. The smoothing coefficients depend on the level of the p-number, which is set in the indicator parameters. The higher the level, the greater the influence of the simple moving average and the less significant the exponential moving average. Parameters Fibonacci Numbers Order - order of the Fibonacci p-number, specified by trader. Valid values
The indicator is based on the analysis of interaction of two filters. The first filter is the popular Moving Average. It helps to identify linear price movements and to smooth minor price fluctuations. The second filter is the Sliding Median. It is a non-linear filter. It allows to filter out noise and single spikes in the price movement. A predictive filter implemented in this indicator is based on the difference between these filters. The indicator is trained during operation and is therefore
This indicator studies the price action as a combination of micro-trends. All micro-trends are analyzed and averaged. Price movement is filtered based on this averaging. IP_High and IP_Low (blue and red dashed lines) show the instantaneous price movement. They display the forecast only for the current price values, taking into account only the number of bars defined by the 'Filter level' parameter. SP_High and SP_Low (blue and red solid lines) smooth the price movements with respect to history.
This indicator implements the process of simple linear smoothing. One of the disadvantages of exponential smoothing is the rapid attenuation of the signal. This does not allow for a full-fledged monitoring of long-term tendency of a price series. Linear smoothing allows fine-tuning the signal filtering. The indicator is configured by selecting the parameters: LP - period of smoothing. The higher the value, the more long-term tendencies are displayed by the indicator. Valid values are from 0 to 2
该指标是基于中值和移动平均特性的组合的顺序混合滤波器。 使用中值允许滤除价格序列值中的异常异常值和随机脉冲。同时,中值滤波器不会对价格变动的趋势起作用,而是保持不变。 由于中值滤波器是非线性的,因此使用简单移动平均值进行平均来平滑其值。这种方法使我们不仅可以更准确地识别趋势,还可以更准确地识别价格变动中的周期性成分。此外,它还增加了指标对价格变化的敏感度,并减少了价格序列与指标读数之间的延迟。因此,指标可以相当准确地警告新趋势的开始,以及旧趋势的结束。 您可以使用 FL 参数调整滤波器的深度及其灵敏度。其允许值为0到63.同时, 2 * FL + 1 条用于计算指标值。因此,FL值越大,指标显示价格图表的趋势越强。
该指标是两个改进的Lanczos滤波器的组合。 第一个过滤器用于推断价格。根据过去的价值,他预测当前柱内可能的价格变动。也就是说,它表明如果过去的趋势保持不变,价格会是多少。 第二个过滤器,用于平滑和平均窗口内的价格,由过滤器的级别决定。由于选择了权重,此过滤器最积极地响应价格变动中存在的周期性组件。 可以使用EF和IF参数调整指标。通过选择 EF 和 IF 的值,您可以获得有关趋势价格变动开始的信号。 EF   - 指数滤波器的窗口大小。有效值为 EF = 0 ... 255 。并且在计算期间处理的条数是 2 * EF + 1 。该参数越大,价格序列的过去价值的影响越大。结果以实线绘制。 IF   - 调整平均窗口的大小。 IF = 0 ... 255 的值。要计算的条数是 2 * IF + 1 。 IF 值越大,使用此过滤器检测到价格变动的较长时段。结果以虚线显示在图表上。
让我们看一下外汇市场价格变化的本质,而不是关注这些变化发生的原因。这种方法将使我们能够确定影响价格变动的主要因素。 例如,让我们看一下欧元兑美元货币对和H1时间框架的开盘价。对于这些价格,我们构建了Lameray图(图1)。 在该图中,可以看出价格变动基本上根据线性方程发生。要确定此等式的参数,可以使用最小二乘法。在这个特定的例子中,改变开盘价的等式采用以下形式: Open [i] = 0.99989 * Open [i + 1] +0.00013。 让我们来看看这个等式如何充分描述价格变动。为此,我们删除线性分量并分析残差(图2)。 从图中可以清楚地看出,这些残留物相当混乱,如果我们将它们视为噪声,我们可以得到一个相当简单的系统来预测下一个柱的开盘价,这是以该指标的形式实现的。
该指标更具信息量。他的工作基于这样的假设,即市场中的价格变动可以表示为特定颜色的噪声,这取决于价格值分布的参数。由此,可以从不同角度分析价格变化,并将价格变动视为特定颜色的噪声,可以获得有关市场当前状态的信息并对价格行为进行预测。 在分析指标读数时,会考虑指标线的位置 - 它们位于当前柱的开盘价的上方或下方以及距离它的距离。 白噪声(白噪声) - 这种方法的特点是价格(当前和史前)被认为功率相等,这与简单的移动平均值相结合。白噪声信号更有可能证实这一特征 - 它越偏离当前价格,市场中的趋势运动就越强烈。相反,如果白噪声线接近开盘价,那么这就是趋势结束或横向价格变动的证据。 闪烁噪声(闪烁噪声)概述了趋势的上边界或下边界(取决于线是否高于或低于价格)。此外,这种噪音线与货币对价格的交叉点可以作为新趋势开始的证据,甚至是短期趋势的开始。 布朗噪声在很多方面的行为类似于指数平滑。因此,噪声线跟随价格,只有市场突然和突然的变化才有可能出现大的偏差。 蓝噪声显示趋势对当前趋势的强烈程度。由于蓝色噪声线与当前价格存在较大偏差,我们可以说趋势已经耗尽其力量并接近完成。 紫色噪音表明周期性或周期性价
尽管“ AIS Color Noise Filter ”指示器存在一些缺点,但使用它来平滑价格序列和预测价格的想法看起来非常有吸引力。 这是由于以下几个原因: 首先,考虑到几个噪声成分,可以建立相互独立的因素预测,从而提高预测质量; 其次,价格序列的噪声特征在整个历史中表现得相当稳定,从而可以获得稳定的结果; 最后,噪声变化使我们希望预测系统非常敏感,并且它对价格变化的反应将非常快。 因此,我们得到一个指标,尽管有所有简化,但能够准确预测价格将会移动的渠道。该指标的主要优点是速度快,易于学习。主要缺点是指标无法选择最重要的预测因素。 LH 是一个参数,用于设置进行预测的历史数据的长度。其允许值为0  -  255,而指标处理的柱数超过此参数指定的单位数。
很多时候,在金融系列的研究中应用他们的平滑。使用平滑,您可以删除高频成分 - 据信它们是由随机因素引起的,因此无关紧要。平滑总是包括一些平均数据的方法,其中时间序列中的随机变化相互吸收。大多数情况下,为此目的,使用简单或加权移动平均方法,以及指数平滑。 这些方法中的每一种都有其优点和缺点。因此,简单的移动平均值简单直观,但其应用需要时间序列的周期和趋势分量的相对稳定性。另外,信号延迟是移动平均值的特征。指数平滑方法没有滞后效应。但即使在这里也存在缺陷 - 只有在将系列与随机异常值对齐时,指数平滑才有效。 简单和指数平均值之间的合理折衷是使用加权移动平均线。但是,存在选择特定重量值的问题。让我们一起尝试解决这个问题。 因此,首先要定义我们希望从平滑过程中实现的目标: •首先,我们需要从价格序列中删除随机变化和噪音; •其次,我们希望识别异常排放和异常价格行为,这些行为也可用于贸易; •最后,平均程序应确定市场中存在的可持续趋势。 当然,我们希望平滑程序适应当前的市场情况。 为了获得理想的结果,我们将根据此价格水平与研究期间的最高和最低价格之间的差异来计算权重。通过这种方法,我们得到一个
为了隔离长期和非随机组件,不仅要知道价格变化了多少,还要知道这些变化是如何发生的。换句话说 - 我们不仅对价格水平的价值感兴趣,而且对这些水平相互替代的顺序感兴趣。通过这种方法,人们可以找到影响(或可能影响)特定时间点价格变化的长期和稳定因素。了解这些因素可以让您做出或多或少准确的预测。 让我们确定我们希望从财务系列的分析中得到什么具体结果: •首先,我们需要强调这一趋势,如果它存在于市场中; •其次,我们需要确定周期性成分; •第三,结果应足够稳定,可用于预测; •最后,我们的分析方法应该适应当前的市场形势。 为了满足指定的条件,我们使用相对价格变化的回归分析,并基于该模型做出指标。该指标的算法基于对历史数据的学习,其工作在交易者的完全控制之下。 LH 是一个参数,用于确定用于平滑金融系列的柱数。其允许值介于0到255之间。 UTS 是影响学习速度和深度的参数。它的值也在0到255之间。如果UTS的值为零,则在整个历史记录中进行学习。在所有其他情况下,训练集会不时更新。更新越频繁,UTS值越小。 该指标的主要缺点是,当平滑金融系列被认为是静止时,这可能会导致一些延迟。
其中一种强大的分析方法是使用Levy流程对财务系列进行建模。这些过程的主要优点是它们可用于模拟大量现象 - 从最简单到最复杂。我只想说市场中分形价格变动的想法只是Levy过程的一个特例。另一方面,通过适当选择参数,任何Levy过程都可以表示为简单的移动平均值。图1显示了一个Levy过程的示例,其中片段放大了几次。 让我们考虑使用Levy流程来平滑价格图表的可能性。首先,您需要选择Levy过程的参数,以便它可以用于模拟线性过程。然后我们得到一个权重系统,其中包括不同符号的系数。有了这个,我们不仅可以平滑金融范围,还可以跟踪其中存在的反趋势和周期性成分。 通过选择参数 LF 来配置指示器的操作。它决定了故事的深度,并将对其进行分析。此参数的允许值位于0  -  255之间。用于计算的条形数将比此数字多两个。 蓝线表示高价平滑的结果,绿线表示收盘价,红线表示低价。 该指标的主要缺点是根据严格定义的算法执行抗锯齿,该算法没有考虑市场中的急剧和强烈变化。此外,与所有平滑指标一样,存在可以达到简单移动平均值的滞后。
AIS Channel Price
Aleksej Poljakov
通常,交易者面临着确定价格在不久的将来可能发生变化的程度的任务。为此,您可以使用Johnson分发类型SB。这种分布的主要优点是即使只有少量的累积数据也可以使用它。用于确定此分布参数的经验方法允许您准确地确定价格通道的最大和最小水平。 这些值可用于不同的情况。例如,它们可用于设置市场订单的止损和止盈水平,或挂单的入场点。此外,使用追踪止损时可以定向这些水平。此外,在历史足够大的情况下,指标可能预示着上升趋势或下降趋势的开始。嗯,或者说它的结束,如果这样的趋势是。 该指标的主要缺点是对价格排放的敏感度极高,以及对市场形势变化的反应较迟。 蓝色和红色线分别显示价格通道的最大值和最小值。绿线表示在给定市场情况下价格的均衡值。 使用 LB 参数配置指标。此参数确定将在计算中使用的柱数,其允许值在2-64之间。
此指标可让您确定价格达到一个或另一个级别的可能性。它的算法非常简单,并且基于对特定货币对的价格水平的统计数据的使用。由于收集的历史数据,可以确定价格在当前柱形期间的变化程度。 尽管简单,但该指标可以为交易提供宝贵的帮助。因此,在其帮助下,可以确定交易头寸的TakeProfit和StopLoss水平。它可以帮助确定挂单的价格和确定TrailingStop的价格水平。 此外,该指标可以纳入现有战略。例如,您使用某种日内策略。然后,通过在D1时间框架上设置此指标,您可以在克服已经不希望开启新交易头寸之后获得水平。 该指标的主要缺点是它完全依赖于历史数据,并且不会以任何方式对某些当前的市场变化作出反应。 通过选择输入参数-L1 ... L4来执行该指标的设置 - 每个输入参数确定从每个柱的开盘价达到价格价格的概率。每个参数的值必须在99 ... 0之内,并且以下每个参数必须严格小于前一个参数。 尼古拉·尼古拉耶维奇(Nikolai Nikolaevich)是创造这个指标的意识形态灵感,如果你喜欢这个指标,那就写下几句话,我会告诉他。
筛选:
无评论
回复评论