JR Trend Mt5
- 指标
- Jefr Alnafey
- 版本: 1.0
- 激活: 5
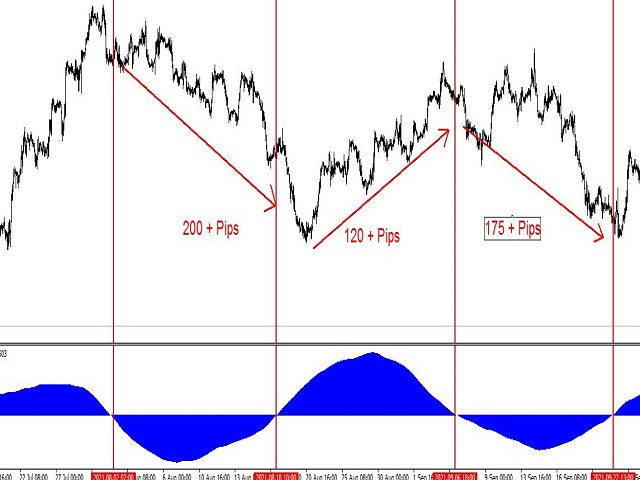
with JR Trend you will able to enter and exit every trade with just a signals appear no need for any strategy just flow the indicator it work on all pairs and all Timeframe i usually take a look on higher timeframe and return to the lowest timeframe and make an order with indicator signals you can see the amazing result so you can depend only on it intraday or swing as you wish