• 概述
  • 评论
  • 评论
  • 新特性

Range profile

The indicator automatically calculates the level and real volume   Point of control, and also displays the market profile for an array of candles, within the boundaries of a rectangle.

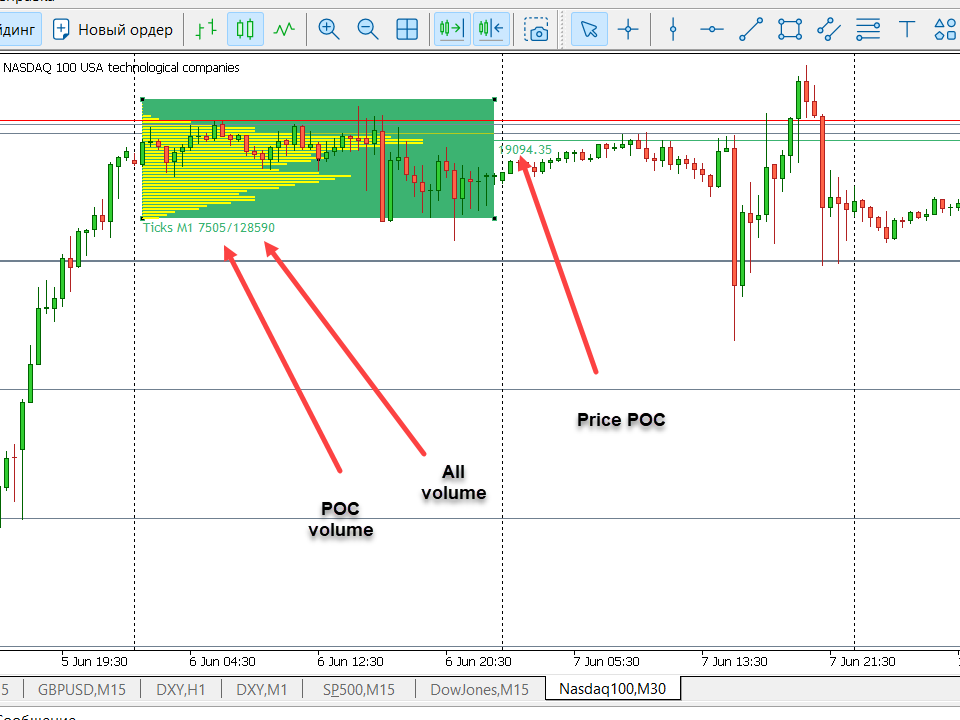
If your strategy is based on taking profit on a rebound from price accumulations, the Range profile indicator will become the main tool in scalping trading. Point of control is calculated based on the total volume for each tick or minute candles, depending on the settings and trading timeframe. In the absence of real volumes on the chart, the POC and market profile are calculated using minute candles and their tick volume.

Application

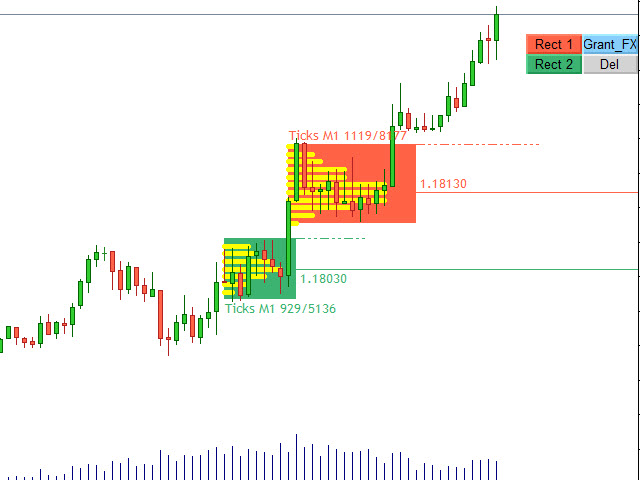
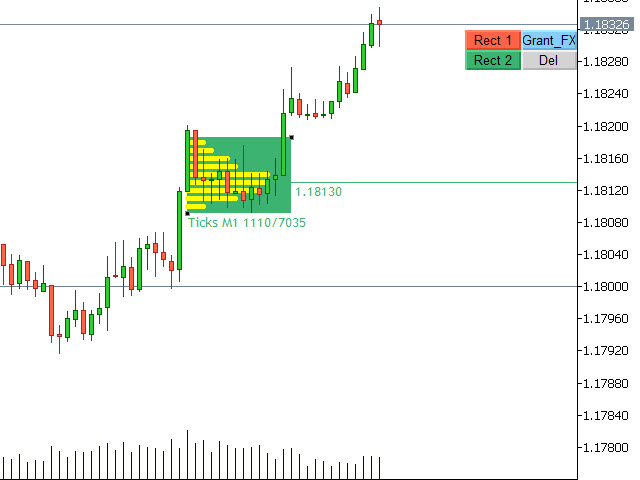
To get the Point Of Control level and market profile for a given area, just create (Rec1 or Rec2 button) and drag a rectangle onto the range of candles on the chart. After dragging or changing the size of the rectangle, the indicator will calculate the market profile and draw a Point Of Control line for candles that fall within the rectangle area.

The POC levels of candlestick flats and accumulations are ideal places to enter a position, since when working with a trend, the probability of a rebound from the POC level is much higher than the probability of a breakout.

To set an alert for a price approaching or leaving a rectangular area, double-click on the edge of the rectangle. When you set an alert, a dotted line will appear at the edge of the rectangle. Now, the first time the price touches the line, an alert will sound.

If you need to display round levels on the chart, turn on the display of round levels and the line drawing step in points in the settings.

Peculiarities

  1. It will show the level and total maximum volume of the market profile of the rectangular area - Point Of Control, as well as the total volume of the entire range inside the rectangle.
  2. Draws a histogram of volume distribution within a rectangle.
  3. For high accuracy in determining the POC level, there is a calculation mode based on the volume of each tick. ( Volume of each tick - true)
  4. Sets up a grid of round levels.
  5. When you double click on the rectangle, an alert is activated, which will work when you touch the current price.
  6. The indicator works on any pairs, cryptocurrencies and timeframes.
  7. The indicator does not load your computer's processor, since it performs calculations only after dragging or resizing the rectangle.
  8. When working with a trend, the probability of a rebound from the level of POC savings is more than 65% for all major pairs.

Settings

  • Button corner - display indicator buttons at the top or bottom
  • Volume of each tick true / M1 volume false - method of calculating the profile by tick volume or minute candles
  • Range profile display - show the range profile inside the rectangle as a histogram
  • Rectangle 1 color - color of rectangle 1
  • Rectangle 2 color - color of rectangle 2
  • Range profile color - color of the range profile histogram
  • Point of control (true) / Midline (false) - calculate POC and set the middle line
  • Rectangle color fill - fill the entire rectangle with color or just the outline
  • Round levels step (pips) - step for drawing round levels
  • Number of round levels down and up - number of round levels up or
  • Sound enable - enable sound when creating a rectangle

For clients

Attention! You cannot test the RangeProfile indicator in the MT5 strategy tester, since the tester does not support full work with ticks and graphical objects. If you are interested in purchasing, send me a private message and I can give you a working demo version with a limited time of use.

I will definitely respond to all comments, suggestions and reviews with a detailed explanation.

Write to the author personally.

Show all products by this author


推荐产品
Volume Delta Candles offer a straightforward way to analyze trading activity within each candle, making it easier to see what's happening without needing an extra volume indicator. This tool uses lower timeframe or real-time data to show the percentage of buying and selling volume within a candle as a colored bar. Make sure you understand Volume and Volume Delta before jumping in. If you’re not sure, reach out to me first for a quick rundown. But if you're already familiar, you're good to go! Ke
Mt5 Market Profile
Mcblastus Gicharu Ndiba
Market Profile Introducing the Market Profile MetaTrader Indicator—your gateway to mastering market dynamics with precision and insight. This powerful tool delivers a classic Market Profile analysis, revealing price density over time and highlighting crucial levels, including the value area and control value for any trading session.  Compatible with timeframes from M1 to D1, it adapts to daily, weekly, monthly, or even intraday sessions, offering you unmatched flexibility. Lower timeframes pro
Ignition
Dansie Software Limited
Strategy Overview The Ignition EA tries to take advantage of sudden momentum when the Ignition pattern is detected. The final bar in the ignition pattern has a small opening wick, a very little or no closing wick, is large in comparison to recent bars and must start from the lower end of the current range (for a bullish ignition) Quick Testing Use Symbol EURUSD, Timeframe M2, and remove the GBPUSD symbol from the "Symbols" input (stratergy 1 and stratergy 2) Settings The below settings
The Market Structures Pro indicator finds and displays 5 (five) patterns of the Smart Money Concepts (SMC) system on the chart, namely: Break Of Structures (BoS)       Change of character (CHoCH) Equal Highs & Lows Premium, Equilibrium and Discount zones with Fibo grid High-high, Low-low, High-low and Low-high extremes Patterns are displayed for two modes - Swing and Internal and are easily distinguished by color on the chart. Internal mode features higher contrast colors, finer lines, and sm
BoxChart MT5
Evgeny Shevtsov
5 (7)
The market is unfair if only because 10% of participants manage 90% of funds. An ordinary trader has slim changes to stand against these "vultures". This problem can be solved. You just need to be among these 10%, learn to predict their intentions and move with them. Volume is the only preemptive factor that faultlessly works on any timeframe and symbol. First, the volume appears and is accumulated, and only then the price moves. The price moves from one volume to another. Areas of volume accumu
Blahtech Market Profile MT5
Blahtech Limited
5 (9)
Was: $249  Now: $99   Market Profile defines a number of day types that can help the trader to determine market behaviour. A key feature is the Value Area, representing the range of price action where 70% of trading took place. Understanding the Value Area can give traders valuable insight into market direction and establish the higher odds trade. It is an excellent addition to any system you may be using. Inspired by Jim Dalton’s book “Mind Over Markets”, this indicator is designed to suit the
This z-score indicator shows the correct z-score of an asset, as it uses the normalized price data for calculation, which is the only correct way. Z-score is only applicable for normal distributed data, therefore not the actual price is considered, but the normalised returns, which were assumed to follow a normal distribution. Returns are mean reverting and assumed to follow a normal distribution, therefore z-score calculation of returns is more reliable than z-score on price, as price is NOT m
Volume by Price MT5
Brian Collard
3.25 (4)
The Volume by Price Indicator for MetaTrader 5 features Volume Profile and Market Profile TPO (Time Price Opportunity). Volume and TPO histogram bar and line charts. Volume Footprint charts. TPO letter and block marker collapsed and split structure charts. Static, dynamic and flexible range segmentation and compositing methods with relative and absolute visualizations. Session hours filtering and segment concatenation with Market Watch and custom user specifications. Graphical layering, positio
Market Profile Heat indicator  — is a classic Market Profile implementation that can show the price density over time, outlining the most important price levels, value area, and control value of a given trading session. This indicator can be attached to timeframes between M1 and D1 and will show the Market Profile for daily, weekly, monthly, or even intraday sessions. Lower timeframes offer higher precision. Higher timeframes are recommended for better visibility. It is also possible to use a f
该指标的独特之处在于交易量核算算法:在所选时段内直接进行累积,而无需参考当天的开始。可以从计算中排除最后的柱线,那么当前数据对之前形成的显着水平(交易量)的影响较小。 为了更精确的计算,默认使用 M1 图表中的数据。规范了价格量的分配步骤。默认情况下,显示的右边框设置为用于分析的数据开头对应的栏,但如果需要,可以设置为您需要的栏。显示的音量带的长度(右边界)由系数调节,也可以向左或向右移动到 0(当前)条或参照当前条进行镜像。 参数: Accumulation period -  累积量计算周期 Number of excluded last bars - 从计算中排除的最后一根柱线的数量   Accumulation price step - 按价格参数的成交量总和步骤 Graph length multiplier -  显示数据的长度比例 Use data from timeframe - 用于分析的图表(时间范围) Graph show shift - 开始显示数据的移位,如果留为0,则数据将从分析数据周期开始时间对应的条开始显示; “-1”——显示在左侧; “-2” - 显示
Initial Balance MT5
Ricardo Almeida Branco
The Initial Balance (Initial Balance / Initial Balance) is a concept related to the study of volume (to learn more, study about Market Profile and Auction Market Theory. You can find some videos in English when searching for "Initial Balance Market Profile"). The IB defines a range in which prices were negotiated in the first hour of trading.The amplitude of the range is important and the break in the range defined by the Initial Balance may have occurred due to the movement of several players
UPD1 Profile Levels MT5
Vitaliy Kuznetsov
5 (3)
该指标在指定柱数的工作直方图上找到最大和最低价格量(市场概况)的水平。   复合型材 。 柱状图的高度是全自动的,并适应任何仪器和时间框架。 作者的算法被使用,并且不重复众所周知的类似物。 两个直方图的高度近似等于蜡烛的平均高度。 智能警报将帮助您了解有关交易量水平的价格。 概念Smart Money 。 Low Volume - Imbalance. 用于寻找良好的市场环境,确定市场结构并作为二元期权的过滤器。 它是价格的磁铁。 High Volume - Liquidity. 用于退出累积时的测试。 输入参数 。 基本 。 Bars Count - 要计数和显示的条数 。 Signal Fractal = 5 (对于颜色信号电平)。 水平将在以下条件下成为信号:顶部和底部有五个直方图不超过它 。 Min Candles For High Volume Level - 在水平蜡烛的最小数量,以便它可以成为一个信号 。 按钮设置 。 Visual Button - 按钮显示(启用/禁用) 。 Corner - 按钮的卡角 。 X indent - 以像素为单位的水平偏移
Profile Map MT5
Dmitriy Sapegin
5 (5)
Market Profile helps the trader to identify the behavior if major market players and define zones of their interest. The key feature is the clear graphical display of the range of price action, in which 70% of the trades were performed. Understanding of the location of volume accumulation areas can help traders increase the probability of success. The tool can be used as an independent system as well as in combination with other indicators and trading systems. this indicator is designed to suit
Market book
Aliaksandr Hryshyn
Depth of market display. Up to sixteen instruments can be displayed. There is auto-scrolling of prices, which can be turned off by clicking on "A" at the top of the window. It is quite a beautiful indicator, it can act as a splash screen, it will not be so boring to look like a regular chart, just right for meditation, especially after big losses in the market. The indicator is not for trading, so your deposit will be more complete. The video displays fast playback of previously saved data. Atte
To get access to MT4 version please click here . This is the exact conversion from TradingView: " WaveTrend" by LazyBear. This is a light-load processing and non-repaint indicator. All input options are available. Buffers are available for processing in EAs. You can message in private chat for further changes you need. The filling area option is omitted to fit into MT5 graphics.
FabFlowInPrice
Fabiano Luiz Roberto
Tape Reading, flow monitoring. FabFlowInPrice   is a powerful indicator for those who like Tape Reading (Times & Trades). It presents the volumes traded at each price level, considering the purchase, sale and direct aggressions for each level. Excellent tool for market flow analysis. Thought of flow so monitor who is attacking the most, buyers, sellers or direct exchanges, thought FabFlowInPrice. The indicator displays information in 4 distinct and fixed periods, on any timeframe: @Day - All
VP hidden
Emr Aljnaby
4 (6)
The indicator works to convert normal volume into levels and determine financial liquidity control points. It is very similar in function to Fixed Volume Profile. But it is considered more accurate and easier to use than the one found on Trading View because it calculates the full trading volumes in each candle and in all the brokers present in MetaTrade, unlike what is found in Trading View, as it only measures the broker’s displayed prices. To follow us on social media platforms: tel
FREE
TPO Profile MT5
Kyra Nickaline Watson-gordon
Definition : TPO is a Time Price Opportunity. Instead of using bars or candles with an Open, High, Low, and Close price, each "bar" in a Market Profile is represented by horizontal bars against the price It is called Market Profile terminology. In other words time-price-opportunity (TPO) profiles are histograms of how much time was spent at each price within the span of the profile. By using a TPO chart, you are able to analyze the amount of trading activity, based on time, for each price leve
Before installing the HeatMap indicator make sure you are using a broker that gives you access to the Depth of market (DOM) !! This indicator creates a heatmap on your chart allowing you to see the buy or sell limit orders easily and in real time. You have the possibility to change the setting and the colors of the HeatMap in order to adapt to all markets and all charts. Here is an example of a setting you can use with the NASDAQ100 on the AMPGlobal broker :  https://www.youtube.com/watch?v=x0
Market Profile MetaTrader System  — is a classic Market Profile implementation that can show the price density over time, outlining the most important price levels, value area, and control value of a given trading session. This indicator can be attached to timeframes between M1 and D1 and will show the Market Profile for daily, weekly, monthly, or even intraday sessions. Lower timeframes offer higher precision. Higher timeframes are recommended for better visibility. It is also possible to use a
Adjustable Consecutive Fractals  looks for 2 or more fractals in one direction and sends out a on screen alert, sound alert and push notification, for strong reversal points . Adjustable Consecutive Fractals, shows the fractals on chart along with a color changing text for buy and sell signals when one or more fractals appear on one side of price. Adjustable Consecutive Fractals is based Bill Williams Fractals . The standard Bill Williams fractals are set at a non adjustable 5 bars, BUT withe
本指标可以让您享受两个最流行的产品来分析在感兴趣的价位的请求量和市场成交量: 真实市场深度图表 真实报价足迹成交量图表 本产品结合两个指标的效力,并以单个文件提供。 反危机出售。今日低价。赶紧! 真实的 COMBO 市场深度功能和报价成交量图表,完全等同于原始指标。您将享受这两款产品结合为单一超级指标的力量!下面是您将得到的功能: 真实市场深度图表 股民专用工具现已在 MetaTrader 5 上可用。 真实市场深度图表 指标在图表上以直方条的形式显示可视化的市场深度,并在实时模式下刷新。 利用 真实市场深度图表 指标您可以正确评估市场请求并从图表上看到大的市场。这可以 100% 的精确剥头皮和设置持仓止损。 指标以两种相应颜色的水平直方条形式显示买和卖的请求 (买-卖)。价格图表上给定级别的显示条和它们的长度与请求的交易量相应。此外, 它指示买卖请求的最大交易量。 此指标显示买卖请求总数量作为堆积面积图。这可以评估当经过下一价位时将会执行的请求总量。买卖请求总数量也显示在图表上。 省缺, 指标显示在图表背景上, 且它不会干扰任何其它指标。当使用指标交易时, 建议使用实际交易量。
B4S BidLine CandleTimer
Henry Waribu Macharia
Introducing the B4S BidLine CandleTimer An insightful indicator that combines real-time bid line visualization with a dynamic countdown timer. Gain a competitive edge in your trading as you stay informed about the time remaining until the next candle starts, all displayed seamlessly on your chart. Why B4S BidLine CandleTimer? Unleash the potential of your trading strategy with the B4S BidLine CandleTimer. Here's why this indicator stands out: Real-Time Bid Line: Witness market movements like nev
Basic Volume Profile MT5
Mehran Sepah Mansoor
使用我们的 Metatrader 交易量曲线指标,探索交易量分析的威力!  /   MT4 版本 基本成交量曲线是专为希望优化交易的手动交易者设计的指标。对于任何希望更好地了解市场行为的严肃交易者而言,成交量曲线指标都是必不可少的工具。利用我们的创新解决方案,您可以清晰、简明地直观了解交易量在不同价格间的分布情况。这样,您就可以确定关键的关注区域,如支撑位和阻力位、累积区和分布区以及重要的控制点。与显示特定日期交易量的普通交易量指标不同,Basic Volume Profile 显示的是特定价格的交易量。 我们的指标具有直观和可定制的界面,让您可以根据自己的交易偏好进行调整。 特点 在价格图表上清晰显示成交量概况。 快速识别高低成交量活动区域。 完全自定义颜色和样式,以适应您的交易风格。 支持多时段综合分析。 专门的技术支持,确保体验顺畅。 配置参数 指标设置 Number of histograms:   要显示的成交量条数 Profile position:     是否希望在第一根蜡烛或侧面显示成交量曲线 Color mode:     是否希望将成交量曲线分为
VSA on the Fly MT5
Andrei Novichkov
The "VSA on the FLY" indicator is designed to quickly display various Volume Profile / Market Profile parameters.. The indicator takes the initial data for operation from the M1 timeframe. The indicator is installed on any timeframe and starts displaying data starting from the selected left border. This can be the beginning of a day, a week, a trading session, any hour, etc. The version of this indicator for MetaTrader 4 can be found here . The following input parameters are available: Show
VWAP Daily
Anton Polkovnikov
Weighted average price indicator or VWAP. The well-known standard VWAP with the beginning of the day is added with the function of selecting the periodization. It can be calculated both every day and on other periods. Also the indicator allows to exclude the volume from the calculation, which will allow using it on the cryptocurrencies and forex. There is an alert for a VWAP price crossing. There are 1 and 2 standard deviation. Settings: Volume: turning volume on and off in the calculation mecha
# NeuroX Quantum Arbitrage EA: Revolutionizing Automated Forex Trading ## Unleash the Power of Advanced Algorithms and Cutting-Edge Technology,  Load the preset by right-clicking on the EA on your chart, selecting "Properties," and then "Load" to import the   PRESET FILE . In the fast-paced world of forex trading, staying ahead of the curve is not just an advantage—it's a necessity. Introducing the NeuroX Quantum Arbitrage EA, a state-of-the-art Expert Advisor that combines time-tested tradin
Boom coins indicator and crash coins
Waleed Hamood Said Al Rawahi
YouTube上的指標直播。更多可信度請點擊下面的鏈接。還有指標的視頻可以觀看。注意直播晚了,不要依賴,只有對指標的回顧僅回顧指標的準確性,幾乎不輸,利潤率達到 95%。我將在 CRASH coin 1000 INDICES 上非常準確地工作 YouTube上的指標直播。更多可信度請點擊下面的鏈接。還有指標的視頻可以觀看。注意直播晚了,不要依賴,只有對指標的回顧僅回顧指標的準確性,幾乎不輸,利潤率達到 95%。我將在 CRASH coin 1000 INDICES 上非常準確地工作 YouTube上的指標直播。更多可信度請點擊下面的鏈接。還有指標的視頻可以觀看。注意直播晚了,不要依賴,只有對指標的回顧僅回顧指標的準確性,幾乎不輸,利潤率達到 95%。我將在 CRASH coin 1000 INDICES 上非常準確地工作
Blahtech Supply Demand MT5
Blahtech Limited
4.54 (13)
Was: $299  Now: $99   Supply Demand uses previous price action to identify potential imbalances between buyers and sellers. The key is to identify the better odds zones, not just the untouched ones. Blahtech Supply Demand indicator delivers functionality previously unavailable on any trading platform. This 4-in-1 indicator not only highlights the higher probability zones using a multi-criteria strength engine, but also combines it with multi-timeframe trend analysis, previously confirmed swings
Moving VVC mt5
Andriy Sydoruk
The   Visual Volatility Clustering   indicator clusters the market based on volatility. The indicator does not redraw and gives accurate data, does not use closing prices. Uses the opening prices or the highs or lows of the previous completed bar. Therefore, all information will be clear and unambiguous. The essence of the indicator is to divide the price market into certain areas according to a similar type of volatility. This can be done in any way. In this example, the indicator is configure
该产品的买家也购买
TPSpro RFI Levels MT5
Roman Podpora
4.73 (11)
指示       俄罗斯 -        英语   建议 与指示器一起使用     -       TPSpro 趋势专业版 -   MT4版本       交易中的一个关键要素是做出买卖交易工具决定的区域或水平。尽管主要参与者试图隐藏他们在市场中的存在,但他们不可避免地会留下痕迹。我们的任务是学习如何识别这些痕迹并正确解释它们。 主要功能: 向卖家和买家显示活跃区域! 该指标显示所有正确的初始买入和卖出脉冲水平/区域。激活这些水平/区域后,开始寻找切入点,水平会改变颜色并填充特定阴影。此外,还会显示箭头,以便更直观地了解情况。 显示更高时间范围内的级别/区域(MTF 模式) 添加了使用更高时间间隔显示级别/区域的功能。此外,该指标还具有自动趋势检测功能(   TPSproTREND PRO   )。 用于交易的单独专业的逐步算法。 该算法专为日内交易而设计,既可顺势交易,也可逆势交易。每个活动模板均提供详细说明。 适用于多种时间范围 。 TPSpro RFI 水平指标可用于图表上的任何时间范围,从一分钟(M1)开始一直到每月(MN)。 图形和声音警报。 该指标提供图形和声音指示
首先,值得强调的是,这个交易系统是一个非重绘、非重画和非滞后的指标,这使得它非常适合手动和机器人交易。 在线课程,手册和下载预设。 “智能趋势交易系统 MT5”是专为新手和经验丰富的交易者量身定制的综合交易解决方案。它结合了超过 10 个优质指标,具有 7 多个强大的交易策略,使其成为适用于各种市场条件的多功能选择。 趋势跟随策略:提供精确的入场和止损管理,以有效地跟随趋势。 反转策略:识别潜在的趋势反转,使交易者能够利用区域市场的机会。 剃头策略:专为快速准确的日内交易和短期交易而设计。 稳定性:所有指标都不会重绘、不会重画和不会滞后,确保可靠的信号。 定制:支持自定义策略,以满足个人交易偏好。超过 7 种策略和组合可帮助您找到最佳策略。 信号清晰度:提供箭头信号,以指示清晰的入场和退出点。 实时警报:通过交易进出警报使交易者保持了解。 深入分析:提供更高时间框架的趋势分析和实时交易监控。 自适应颜色编码:利用蜡烛颜色编码来显示成交量、趋势和反转蜡烛信号。通过蜡烛颜色分析市场方向。 “智能趋势交易系统 MT5”赋予交易者必要的工具,以便在各种市场条件下做出明智和战略性的交易决策。无论
Atomic Analyst MT5
Issam Kassas
4.42 (19)
首先值得强调的是,该交易指标是非重绘、非延迟的指标,这使其成为手动和机器人交易的理想选择。 用户手册:设置、输入和策略。 Atomic Analyst是一种PA价格行动指标,利用价格的力量和动量来寻找市场上更好的机会。配备了高级过滤器,可帮助去除噪音和假信号,并提高交易潜力。使用多层复杂的指标,Atomic Analyst扫描图表,并将复杂的数学计算转化为任何初学者都能理解并用来做出一致交易决策的简单信号和颜色。 “Atomic Analyst”是专为新手和经验丰富的交易者量身定制的综合交易解决方案。它将高级指标和一流功能融合为一体的交易策略,使其成为所有类型交易者的多功能选择。 日内交易和剥头皮策略:专为快速准确的日内交易和短期交易而设计。 日内和摆动交易策略:可用作追求价格大幅波动的日内和摆动交易者的可靠工具。 多货币和市场:凭借其可靠的精度,在不同的工具和市场上运作。 多个时间框架:可在多个时间框架上使用,性能良好。 稳定性:所有指标均不重绘、不重绘和不滞后,确保可靠的信号。 信号清晰度:提供箭头信号,用于清晰的入场和出场点。 实时警报:通过交易入场、SL和TP警报通知交
Quantum Trend Sniper
Bogdan Ion Puscasu
4.8 (49)
介绍   量子趋势狙击指标 ,突破性的 MQL5 指标,正在改变您识别和交易趋势反转的方式!由拥有超过13年交易经验的资深交易员团队开发,     量子趋势狙击指标   旨在通过其创新的方式以极高的准确度识别趋势反转,将您的交易之旅推向新的高度。 ***购买量子趋势狙击指标,即可免费获得量子突破指标!*** 当量子突破指标识别出趋势反转时,它会向您发出警报和信号箭头,并建议您三个止盈水平。 它既适合新手交易者,也适合专业交易者。 量子 EA 通道:       点击这里 MT4版本:       点击这里 建议: 时间范围: 所有时间范围。为了获得最佳结果,我们建议在 M15、M30 和 H1 时间范围内使用它。 货币对:欧元兑美元、英镑兑美元、澳元兑美元、欧元兑英镑、, EURAUD,  XAUUSD 账户类型:ECN、Raw 或 Razor,点差极低 经纪时间:任意 经纪商:IC Markets、Pepperstone with Raw 和 Razor 的点差最低 建议止损:50 点 建议止盈水平:20 点、50 点和
TrendMaestro5
Stefano Frisetti
note: this indicator is for METATRADER4, if you want the version for METATRADER5 this is the link:  https://www.mql5.com/it/market/product/108106 TRENDMAESTRO ver 2.4 TRENDMAESTRO recognizes a new TREND in the bud, he never makes mistakes. The certainty of identifying a new TREND is priceless. DESCRIPTION TRENDMAESTRO identifies a new TREND in the bud, this indicator examines the volatility, volumes and momentum to identify the moment in which there is an explosion of one or more of these data a
该仪表盘显示所选符号的最新可用谐波形态,因此您可以节省时间并提高效率 /  MT4 版本 。 免费指标:  Basic Harmonic Pattern 指标列 Symbol:   显示所选符号 Trend:     看涨或看跌 Pattern:    形态类型(Gartley、蝴蝶、蝙蝠、螃蟹、鲨鱼、Cypher 或 ABCD) Entry:     入口价格 SL: 止损价 TP1: 第一止盈价 TP2: 第二次获利价格 TP3: 第三次获利价格 Current price:    当前价格 Age (in bars):   最后绘制的模式的年龄 主要输入 Symbols :   从 "28 种主要货币对 "或 "选定符号 "中选择。 Selected Symbols :   希望监控的符号,用逗号分隔("EURUSD,GBPUSD,XAUUSD")。如果您的经纪商为货币对设置了后缀或前缀,您必须在以下两个参数中添加(货币对前缀或货币对后缀)。 Max Iteration:   调整模式的最大迭代次数(如果该值越小,则模式越少,性能越快;如果该值越大,则模式越多,性能
FX Power MT5 NG
Daniel Stein
5 (5)
通过 mql5 和 Telegram 上 的晨间简报获取每日市场更新,包括详细信息和屏幕截图 ! FX Power MT5 NG 是我们长期以来非常受欢迎的货币强度计算器 FX Power 的下一代产品。 这款下一代强度计算器能提供什么?您所喜爱的原版 FX Power 的所有功能 附加功能 黄金/XAU 强度分析 更精确的计算结果 可单独配置的分析周期 可自定义计算限制,以获得更好的性能 为希望查看更多信息的用户提供特殊的多实例设置 无尽的图形设置,可在每个图表中设置您最喜欢的颜色 无数的通知选项,让您再也不会错过任何重要信息 采用 Windows 11 和 macOS 风格的全新圆角设计 神奇的移动指标面板 FX Power 主要功能 所有主要货币的完整强势历史 所有时间框架内的货币强弱历史 所有经纪商和图表的计算结果完全相同 100% 可靠的实时计算 -> 无重绘 可通过下拉列表选择分析时段 通过自定义模式单独配置分析时段 可在一个图表中使用多个实例 可移动 FX Power 显示屏(通过拖放) 适用于高分辨率 QHD、UHD 和 4K 显示器 自动终端配置 针对平板电脑
Entry Points Pro for MT5
Yury Orlov
4.46 (124)
这款指标用于 MT5,可提供准确的入场交易信号,且无重绘。 它可应用在任何金融资产:外汇、加密货币、贵金属、股票、指数。 它将提供极其精准的评估,并告诉您何时开仓和平仓的最佳时机。 观看 视频 (6:22),其中包含一个仅处理单一信号的示例,该信号即可值回指标购价! 大多数交易者在 Entry Points Pro 指标的帮助下,在第一个交易周内即改善了他们的交易结果。 订阅我们的 Telegram 群 ! Entry Points Pro 指标的益处。 入场信号无重绘 如果信号出现,并得到确认,则它不会再消失;不像是重绘指标,它会导致重大的财产损失,因为它们可以在显示信号后再将其删除。 无差错开仓 指标算法可令您找到入场交易(买入或卖出资产)的理想时机,从而提高每位交易者的成功率。 Entry Points Pro 可操作任何资产 它允许您在 MT5 平台上交易任何经纪商的加密货币、股票、贵金属、指数、大宗商品和货币。 提供任何方向的信号 Entry Points Pro 指标提供针对任意价格走势的入场交易信号 - 上涨、下跌或横盘(横向)。
FxaccurateLS
Shiv Raj Kumawat
WHY IS OUR FXACCCURATE LS MT5 THE PROFITABLE ? PROTECT YOUR CAPITAL WITH RISK MANAGEMENT Gives entry, stop and target levels from time to time. It finds Trading opportunities by analyzing what the price is doing during established trends. POWERFUL INDICATOR FOR A RELIABLE STRATEGIES We have made these indicators with a lot of years of hard work. It is made at a very advanced level. Established trends provide dozens of trading opportunities, but most trend indicators completely ignore them!
AT Forex Indicator MT5
Marzena Maria Szmit
5 (4)
The AT Forex Indicator MT5 is a sophisticated trading tool designed to provide traders with a comprehensive analysis of multiple currency pairs. This powerful indicator simplifies the complex nature of the forex market, making it accessible for both novice and experienced traders. AT Forex Indicator uses advanced algorithms to detect trends, patterns and is an essential tool for traders aiming to enhance their forex trading performance. With its robust features, ease of use, and reliable signal
Advanced Supply Demand MT5
Bernhard Schweigert
4.5 (14)
任何新手或专业交易者的最佳解决方案! 该指标是一款独特、高质量、且价格合理的交易工具,因为我们已经整合了许多专有功能和新公式。 依据此更新,您将能够显示双重时间帧区域。 您不仅可以显示一个较高的时间帧,还可以同时显示图表时间帧,加上更高的时间帧:显示嵌套时区。 供需双方所有交易者都会喜欢它。 :) 重要信息披露 高级供需的最大潜力,请访问 https://www.mql5.com/zh/blogs/post/720245   想象您的交易如何得以改善,是因为您能够精准定位入场或目标位吗? 构建于新的底层算法,它可以更轻松地识别出买卖双方之间的潜在失衡。 这是因为它以图形方式展示供需最强劲区域,及其过去的表现(显示旧区域)。 这些功能旨在帮助您更轻松地发现最佳入场区域和价位。 现在您可以针对您的交易品种和时间帧来优化和编辑区域强度! 高级供需指标适用于所有产品和时间帧。 它是一个新的公式,非常新的功能是两个区域强度函数可由用户输入进行调整! 这在交易中是一大优势。 当您学习如何使用专有功能,例如带有价格游离最小 X 因子的区域强度时,您能够判断该区域强劲与否。 供需区域用作警报触发器
TPA True Price Action indicator reveals the true price action of the market makers through 100% non-repainting signals strictly at the close of a candle! TPA shows entries and re-entries, every time the bulls are definitely stronger than the bears and vice versa. Not to confuse with red/green candles. The shift of power gets confirmed at the earliest stage and is ONE exit strategy of several. There are available now two free parts of the TPA User Guide for our customers. The first "The Basics"
XQ Indicator MetaTrader 5
Marzena Maria Szmit
3 (2)
Step into the realm of Forex trading with confidence and precision using XQ, a cutting-edge Forex indicator designed to elevate your trading game to unprecedented heights. Whether you're a seasoned trader or just stepping into the world of currency exchange, XQ Forex Indicator empowers you with the insights and signals needed to make informed trading decisions. The signal conditions are a combination of three indicators, and XQ Forex Indicator only display  medium and long-term trends . The ind
PZ Swing Trading MT5
PZ TRADING SLU
5 (4)
Swing Trading 是第一个旨在检测趋势方向的波动和可能的反转波动的指标。它使用在交易文献中广泛描述的基准摆动交易方法。该指标研究多个价格和时间向量,以追踪总体趋势方向,并检测市场超卖或超买并准备好进行修正的情况。 [ 安装指南 | 更新指南 | 故障排除 | 常见问题 | 所有产品 ] 市场波动的利润不会被窃取 指示器始终显示趋势方向 彩色价格带代表机会基准 彩色虚线表示可能的反转波动 该指标分析其自身的质量和性能 它实现了一个多时间仪表板 可定制的趋势和波动周期 它实现了电子邮件/声音/推送警报 指示器为非重涂或重涂 什么是摇摆交易 摇摆交易是一种尝试在一天到一周内从证券中获得收益的交易方式,尽管某些交易最终可以保持更长的寿命。摇摆交易者使用技术分析来买入弱点和卖出力量,并有耐心等待这些机会的发生,因为在发生一波抛售浪潮之后购买证券而不是陷入抛售更有意义。 机会基准 关于历史数据的大量研究证明,适合于波动交易的市场倾向于在基线价格带上下交易,基线价格带由图表显示,使用平均真实区间计算得出。波动交易者使用基线,该策略是购买常态和卖出躁狂,或做空常态并掩盖沮丧。
可以说,这是您可以为MetaTrader平台找到的最完整的谐波价格形成自动识别指标。它检测19种不同的模式,像您一样认真对待斐波那契投影,显示潜在的反转区域(PRZ),并找到合适的止损和获利水平。 [ 安装指南 | 更新指南 | 故障排除 | 常见问题 | 所有产品 ] 它检测19种不同的谐波价格形态 它绘制了主要,衍生和互补的斐波那契投影(PRZ) 它评估过去的价格走势并显示每个过去的形态 该指标分析其自身的质量和性能 它显示合适的止损和获利水平 它使用突破来表明合适的交易 它在图表上绘制所有样式比率 它实现了电子邮件/声音/视觉警报 受斯科特·M·卡尼(Scott M. Carney)的书的启发,该指标旨在满足最纯粹和最熟练的交易者的需求。但是,它采取了一种使交易更容易的方式:在向交易发出信号之前,它会等待Donchian朝正确方向突破,从而使交易信号非常可靠。 斐波那契投影与向量无关 它实现了电子邮件/声音/推送警报 它绘制了ABCD投影 重要提示: 为了符合 Scott M. Carney先生 的商标申诉,某些图案名称已重命名为不言自明的替代方式, Scot
FX Volume MT5
Daniel Stein
4.93 (14)
通过 mql5 和 Telegram 上 的 " 晨间简报 "获取每日市场更新,包括详细信息和屏幕截图 ! 外汇交易量(FX Volume)是第一个也是唯一一个从经纪商角度真正洞察市场情绪的交易量指标。 直接在您的图表上看到这些信息是真正改变游戏规则和突破性的交易解决方案。 受益于独特的市场数据洞察,如 比率(Ratios )显示货币多头和空头头寸的比率(百分比 比率变化 显示所选时间段内的多头比率及其百分比变化 总交易量 显示货币的总交易量(多头和空头),以手为单位 多头 交易量显示货币所有多头头寸的交易量 空头 交易量显示所有货币空头头寸的交易量 净多头 显示净多头交易量,即所有多头头寸减去所有空头头寸(以手为单位)。 净多头百分比 显示货币净多头交易量的变化 请阅读我们的基本教程 -> "如何使用外汇交易量进行交易 " 获取更多信息,如常见问题、交易技巧和教程视频,请访问我们的 外汇交易量公共信息频道 请 安装并运行 SI Connect 以建立与我们数据中心的持续连接 背景信息 我们都知道,外汇是一个分散的市场。这就是为什么我们必须打破常规思维,开发一个独
Noize Absorption Index
Ekaterina Saltykova
Noize Absorption Index - is the manual trading system that measures the difference of pressure between bears forces and bulls forces. Green line - is a noize free index that showing curent situation. Zero value of index shows totally choppy/flat market.Values above zero level shows how powerfull bullish wave is and values below zero measures bearish forces.Up arrow appears on bearish market when it's ready to reverse, dn arrow appears on weak bullish market, as a result of reverse expectation.
PZ Support Resistance MT5
PZ TRADING SLU
4.17 (6)
厌倦了绘制支撑线和阻力线? 支撑阻力 是一个多时间指标,可以自动检测并绘制图表中的支撑线和阻力线,并具有非常有趣的变化:随着时间的推移测试价格水平及其重要性的提高,线变得越来越粗。 [ 安装指南 | 更新指南 | 故障排除 | 常见问题 | 所有产品 ] 一夜之间增强您的技术分析 无需浏览图表即可检测重要的价格水平 一目了然地识别所有价格水平的相对优势 每次交易最多可节省半小时的绘图线 指标显示所有价格水平的期限 指示器不重涂 过去和现在的价格水平因接近程度而崩溃,并根据当前的市场行为进行了调整。在动作发生的地方绘制了线条,而不一定在峰值处绘制了线条。 价格水平随着时间的推移而被拒绝,变得越来越暗 定期清除不重要的价格水平以避免噪音 可自定义的时间范围选择和崩溃因子 它实现了电子邮件/声音/推送警报的突破 输入参数 指标设置:指标将从当前时间段读取价格,但您可以选择另一个。例如,您可以在H4图表中显示D1支撑线和阻力线。您还可以使用 价格水平密度 参数选择在图表上显示多少价格水平。 颜色设置:根据重要性输入所需的支撑线和阻力线颜色。 标签设置:(可选)可以在指示器
Gold Trend 5
Sergei Linskii
5 (1)
黄金趋势 - 这是一个很好的股票技术指标。该指标算法分析资产的价格走势,并反映波动性和潜在进入区。 最佳指标信号: - 卖出 = 红色柱状图 + 红色短指针 + 同方向黄色信号箭头。 - 买入 = 蓝色柱状图 + 蓝色多头指针 + 同方向水蓝色信号箭头。 该指标的优点 1. 该指标生成的信号准确度高。 2. 只有当趋势发生变化时,才能重新绘制已确认的箭头信号。 3. 您可以在任何经纪商的 MetaTrader 5 交易平台上进行交易。 4. 您可以交易任何资产(货币、金属、加密货币、股票、指数等)。 5. 最好在 H1 时间框架(中期交易)上进行交易。 6. 在指标设置中可更改个别参数(TF、颜色等),以便每位交易者都能轻松定制适合自己的指标。 7. 该指标既可作为交易系统的主要补充,也可作为独立的交易系统使用。   注意:交易的入市准确性和盈利能力仅取决于交易者的技能。任何指标都只是交易者的助手,而非行动指南。 MetaTrader 4 黄金趋势指标版本  祝大家交易好运,稳定盈利!
该仪表盘可根据您对所选符号的交易策略,以剥头皮和长期模式在图表上发现并显示供需区。此外,仪表盘的扫描模式可帮助您一目了然地检查所有需要的符号,不错过任何合适的仓位/ MT4 版本 免费指标: Basic Supply Demand 功能 允许您查看多个货币对的交易机会,为您提供所有货币对的清晰简明视图,并根据其与供需区的接近程度进行排序 可定制设置,从颜色到检测参数,满足您的特定需求 主要输入 Indicator mode : 选择指标模式或具有新功能的面板模式 Symbols : 从 "28 种主要货币对 "或 "选定符号 "中进行选择 Selected Symbols : 您希望监控的符号,用逗号分隔("EURUSD,GBPUSD,XAUUSD")。如果您的经纪商对货币对有后缀或前缀,您必须在以下两个参数中添加(货币对前缀或货币对后缀) Trading Style : 选择剥头皮或长期模式 Allowed Deviation : 该参数允许修改需求或供应区域的精确度(数值越小,精确度越高) Zone   thickness : 通过该参数可以修改需求和供应
Price Action Finder Multi MT5
Siarhei Vashchylka
5 (5)
The Price Action Finder Multi indicator is an indicator of entry points that searches for and displays Price Action system patterns on dozens of trading instruments and on all standard time frames: (m1, m5, m15, m30, H1, H4, D1, Wk, Mn). The indicator places the found patterns in a table at the bottom of the screen. By clicking on the pattern names in the table, you can move to the chart where this pattern is located. Manual (Be sure to read before purchasing) | Version for MT4 Advantages 1. Pa
Gold ATR MTF 5
Sergei Linskii
Gold ATR MTF - 這是一個很好的股票技術指標。 ATR(平均真實波動範圍)指標的演算法分析資產價格的變動,並透過在指定時間範圍 (D1) 的開盤價的指定百分比 (%) 中繪製相應水平來反映波動性。 符號價格變動方向和箭頭訊號的指標(紅色和/或藍色 D1 H4)是舒適且有利可圖的日內交易和/或倒賣的額外且重要的幫助。 對於外匯符號,每日利潤可以從 20 點起;對於黃金符號,每日利潤可以從 50 點起。 指標特點: 這是一個超級指標,具有 Magic、趨勢方向檢測器和兩個趨勢箭頭塊,可實現舒適且有利可圖的交易。 圖表上顯示用於切換方塊的紅色按鈕。 Magic 在指標設定中進行設置,以便您可以將指標安裝在顯示不同區塊的兩個圖表上。黃金 ATR MTF 可以放置在具有不同箭頭緩衝區(FP 和 SA)的兩個圖表上。 為此,您需要在設定中選擇不同的Magic,例如,一個Magic=999,另一個Magic=666。 然後您可以使用圖表上的紅色按鈕選擇箭頭緩衝區。在GOLD ATR MTF 中,只有當價格強勁波動時,水平(ATR) 才能小幅擴大,只有當價格強勁波動時,才能重新繪製趨勢方
Automated Trendlines MT5
Georgios Kalomoiropoulos
趋势线是外汇交易中最重要的技术分析工具。不幸的是,大多数交易者没有正确绘制它们。自动趋势线指标是专业交易者的专业工具,可帮助您可视化市场的趋势运动。 有两种类型的趋势线看涨趋势线和看跌趋势线。 在上升趋势中,外汇趋势线是通过价格变动的最低摆动点绘制的。 连接至少两个“最低点”将创建一条趋势线。 在下跌趋势中,趋势线是通过价格走势的最高摆动点绘制的。 连接至少两个“最高点”将创建一条趋势线。 趋势线何时突破? 当看跌蜡烛收于看涨​​趋势线下方并且蜡烛的高点在趋势线上方时,看涨趋势线会被打破。 当看涨蜡烛收于看跌趋势线上方并且蜡烛的低点低于趋势线时,看跌趋势线会被打破。 趋势线何时删除? 当一根完整的蜡烛在看涨趋势线下方形成时,看涨趋势线将被删除。 当完整的蜡烛在看跌趋势线上方形成时,看跌趋势线将被删除。 您可以从输入参数更改看涨和看跌趋势线的颜色和宽度。
Order Block Hunter MT5
Noha Mohamed Fathy Younes Badr
5 (1)
Order block hunter indicator is the best indicator for  hunt the order blocks that area where there has been a large concentration of limit orders waiting to be executed Order blocks are identified on a chart by observing previous price action and looking for areas where the price experienced significant movement or sudden changes in direction .This indicator does that for you by using very complicated codes and helps you to take the best areas To buy and sell because it make marks at the best a
MetaForecast M5
Vahidreza Heidar Gholami
5 (2)
MetaForecast能够根据价格数据中的谐波来预测和可视化任何市场的未来走势。虽然市场不总是可预测的,但如果价格中存在模式,MetaForecast可以尽可能准确地预测未来。与其他类似产品相比,MetaForecast通过分析市场趋势可以生成更精确的结果。 输入参数 Past size (过去的尺寸) 指定MetaForecast用于创建生成未来预测模型的柱数量。该模型以一条黄色线绘制在所选柱上。 Future size (未来的尺寸) 指定应预测的未来柱数量。预测的未来以粉色线表示,并在其上绘制了蓝色回归线。 Degree (程度) 此输入确定了MetaForecast将在市场上进行的分析级别。 Degree 描述  0 对于程度0,建议使用较大的值来设置“过去的尺寸”输入,以覆盖价格中的所有高峰、低谷和细节。  1 (建议的) 对于程度1,MetaForecast可以理解趋势,并通过较小的“过去的尺寸”生成更好的结果。  2 对于程度2,除了趋势,MetaForecast还可以识别反转点。对于大于1的程度,必须使用较高的“细节”和“噪音减少”输入值。  大于2 不建议使用大
Golden Spikes Premium
Kwaku Bondzie Ghartey
Golden Spikes Detector Acknowledgement and Dedications:  The name of this indicator was Inspired by an Original; Mr Grant Koopman; a Knowledgeable and experienced Synthetics trader. I dedicate this indicator to Mr Grant.  Overview: The Golden Spikes Premium is a groundbreaking trading indicator meticulously crafted for the Boom and Crash indices on the Deriv market. Tailored to meet the needs of discerning traders, this powerful tool operates exclusively on the one-minute timeframe, providin
Market Overview MT5
Mehran Sepah Mansoor
使用我们的市场强度和情绪指标优化您的交易决策,不再逆势交易! 我们的指标专为重视准确及时信息的严肃交易者精心设计,以非常简单的方式提供 28 种主要货币对的鸟瞰图。该工具可根据货币对的受欢迎程度、看涨或看跌趋势的强度以及买方和卖方的百分比 (MT4 版本) 对货币对进行排名。 功能特点 实时趋势强度: 准确评估每种货币对的趋势强度,为识别交易机会提供可靠指导。 买卖双方分析: 通过我们对每种货币对的买卖双方实力排名,即时洞察市场动态,让您预测重要走势。 交易者兴趣: 获取每种货币对的交易者兴趣和活动数据,帮助您更好地了解新兴趋势和潜在转折点。 直观且可定制的仪表盘: 我们的仪表板易于使用,您可以根据自己的喜好自定义显示,让您对相关信息一目了然。 实时更新: 实时更新让您随时了解市场变化,确保您不会错过任何有利可图的机会。 指标栏 Symbol:  点击此栏,符号将按字母顺序排序。 Popularity:  点击此栏,将按照交易者对该交易货币对的兴趣顺序进行排序。 Strength:  点击此栏,货币对将按照趋势排序(正数表示上升趋势,负数表示下降趋势)。 Bu
Boom and Crash Trend Detector is a  Non-Repaint   MT5 trading system usually being sold for 50 0$ . Most people use this for Deriv but can be used to forex too. The boom and crash spike indicator is a spike detecting software, with Multiple features, these features include. Spike Alert ( from 10 to 100-second warning before spike) Continues spike Alert (for double or continuous spikes at a time) supports all Boom/crash Indices M6 time frame works best here . Bigger time frame trend pointer f
PZ Divergence Trading MT5
PZ TRADING SLU
4 (5)
棘手的发现和频率稀缺是最可靠的交易方案之一。该指标使用您喜欢的振荡器自动查找并扫描常规和隐藏的发散。 [ 安装指南 | 更新指南 | 故障排除 | 常见问题 | 所有产品 ] 容易交易 发现常规和隐藏的分歧 支持许多知名的振荡器 根据突破实现交易信号 显示适当的止损和获利水平 可配置的振荡器参数 可自定义的颜色和尺寸 按条形过滤大小差异 实现绩效统计 它实现了电子邮件/声音/视觉警报 为了提供广阔的市场前景,可以使用不同的振荡器在同一张图表中多次加载该指标,而不会产生干扰。该指标支持以下振荡器: RSI CCI MACD OSMA 随机 动量 很棒的振荡器 加速器振荡器 威廉姆斯百分比范围 相对活力指数 由于差异可能会扩大很多,尤其是在外汇市场中,因此该指标产生了转折:它在等待交易突破之前等待donchian突破确认差异。最终结果是带有非常可靠的交易信号的重新粉刷指示器。 输入参数 幅度:用于寻找差异的之字形周期 振荡器-选择要加载到图表的振荡器。 突破期-交易信号的突破期,以柱为单位。 发散类型-启用或禁用发散类型:隐藏,常规或两者。 最小散度单位为条形-最
作者的更多信息
Trend PA
Mikhail Nazarenko
5 (3)
The Trend PA indicator uses   Price Action   and its own filtering algorithm to determine the trend. This approach helps to accurately determine entry points and the current trend on any timeframe. The indicator uses its own algorithm for analyzing price changes and Price Action. Which gives you the advantage of recognizing, without delay, a new nascent trend with fewer false positives. Trend filtering conditions can be selected in the settings individually for your trading style. The indicator
ScalperGun
Mikhail Nazarenko
Scalper gun  - главное оружие для торговли скальпингом и свингом, с визуализацией и алертом точек входа. Индикатор работает как в трендовых, так и в нетрендовых рыночных условиях. Подходит начинающим и опытным трейдерам.  SCALPER GUN превосходит по скорости, качеству визуализации и точности входа популярные топовые индикаторы этого сайта!!! Перед покупкой скачайте демо Scalper gun и сравните с аналогичными индикаторами для скальпинга в тестере MT4. Особенности Это готовая торговая система с виз
Scalper gun
Mikhail Nazarenko
4.5 (2)
Scalper gun   - the main weapon for trade in scalping and swing, with visualization and alert of entry points. The indicator works in both trend and non-trend market conditions. Suitable for beginners and experienced traders. SCALPER GUN surpasses popular top indicators of this site in speed, quality of visualization and accuracy of entry !!! Before buying, download the Scalper gun demo and compare it with similar indicators for scalping in the MT4 tester. Features This is a complete trading s
Momentum DX
Mikhail Nazarenko
5 (1)
The indicator shows points for the continuation of the trend for currency pairs with the participation of the USD dollar with a probability of more than 80%. The algorithm is based on comparing the momentum of the current currency pair with the momentum of the DX dollar index at the current time. Using the dollar index allows us to evaluate not only the current pair, but the entire picture for all major currencies at once. This approach increases the reliability and reduces the number of false p
Simple Order
Mikhail Nazarenko
5 (2)
Simple order is designed to make placing pending orders as easy and fast as possible. Setting a pending order takes just two steps. 1. Double-click on the price of placing an order, after that a panel with buttons for order names appears. 2. Click on the button of the required order That's it, the pending order is set. If necessary, we adjust the order by dragging, as well as change the sizes of stop loss and take profit. Don't forget to pre-set the size of the stop loss and take profit in the S
FREE
Volume Fractals
Mikhail Nazarenko
4.83 (6)
Fractal is one of the main indicators in a number of strategies. Volume Fractals has expanded the functionality of the standard indicator version. The product features fractals sorting and displaying fractals representing both price and volume extreme points. Application Stop losses Reversal signals Placing pending orders for a fractal breakout Options Bars of history - number of chart bars the indicator is displayed for Left side minimum bars - minimum number of bars to the left of the frac
FREE
TradingSessions
Mikhail Nazarenko
Индикатор отображает различными цветами на фоне графика три торговые сессии. Открытие - закрытие Лондон, Нью Йорк, Токио по умолчанию. Применение Для успешной торговли важно знать начало и конец торговых сессий с наибольшей ликвидностью, так как именно в это время цена делает самые большие движения. Особенности Настройки по умолчанию - торговые сессии по Лондону, Нью Йорку, Токио. Возможность выставить свои рамки тоговых сессий Алерт при открытии сессии Показ открытия дня по GMT Настройки для
FREE
Fast Trend
Mikhail Nazarenko
Fast trend   is a professional version of the trend direction indicator and entry points. The indicator with high probability determines the direction of the trend on any currency pairs, stocks, cryptocurrency without redrawing the result.   To determine the trend, it uses Price action and its own unique filtering algorithm.   Suitable for all types of trading, both for scalping and for long-term trading. This version of the indicator is another branch of the evolution of the Simple Trend indica
Smart Trend Line
Mikhail Nazarenko
Indicator with an innovative algorithm for determining the direction of the trend. Shows the best results for determining the trend on any currency pairs, stocks, cryptocurrency without redrawing the result. It will help you immediately determine the profitability of the current pair and timeframe. Uses Price action patterns in conjunction with the author's unique algorithm. Suitable for both beginners and professionals for all types of trading. How to choose a profitable timeframe and optimize
Simple trend
Mikhail Nazarenko
5 (1)
Simple trend   is a professional version of the trend indicator and entry points. It uses Price action and a unique filtering algorithm to determine the trend. Shows the change in the direction of price movement on any currency pairs, without redrawing the result. Suitable for determining entry points for scalping and swing, as well as for intraday, medium-term trading. Features Marks trend reversal locations and directions. Suitable for all types of trading, in any markets. Allows you to enter
Not trading time
Mikhail Nazarenko
4 (2)
There are time periods in the market, when trading is highly likely to be unprofitable. This indicator warns you about such non-trading situations and helps you preserve your money and time. Parameters Remind about non-trading periods: Expiration week - remind about the expiration week Consumer index day - remind a day before the release of Consumer index day NON FARM - remind a day before the release of NON FARM Christmas - remind a day before Christmas New Year Days 25.12 - 15.01 - remind ab
FREE
Del All Orders
Mikhail Nazarenko
A script for group removal of orders of a given type. To delete, drag the script onto the chart and in the pop-up window select the type of orders to be deleted and click OK. Settings Types of orders to delete - order types to be deleted or closed ALL_PENDING - OP_BUYLIMIT, OP_SELLLIMIT, OP_BUYSTOP, OP_SELLSTOP ALL_LIMIT - OP_BUYLIMIT, OP_SELLLIMIT ALL_STOP - OP_BUYSTOP, OP_SELLSTOP ALL_MARKET - OP_BUY, OP_SELL ALL_LIMIT_BUY - OP_BUYLIMIT ALL_LIMIT_SELL - OP_SELLLIMIT ALL_STOP_BUY - OP_BUYSTOP
FREE
OffsetGMT
Mikhail Nazarenko
5 (1)
Script for quickly determining the time offset of your broker's server relative to GMT. For correct operation in the strategy tester, many Expert Advisors require GMT time to be entered in the settings for the terminal where testing is being performed. Developers are forced to enter the GMT offset for testing separately, as such functions are not provided in the tester. This script can help quickly determine the time offset in your terminal relative to GMT. Parameters Day light saving time for
FREE
Catcher Trends
Mikhail Nazarenko
5 (1)
What It Does During strong directional movements, the probability always leans towards moving along the trend. This is the probability utilized by the fully automated Catcher Trends robot, abbreviated CT. Trades are opened only in the trend direction and based on important levels. CT enters the market by its own algorithm using pending stop orders with predefined stop loss and take profit. This minimizes the slippages when opening trades, and stop loss prevents the unforeseen losses. The order p
Broken Level
Mikhail Nazarenko
The Broken Level automated Expert Advisor uses strong levels, that stand against the main trend, and opens orders along the trend when those levels are broken. Broken Level enters the market by its own unique algorithm using pending stop orders with predefined stop loss and take profit. This minimizes the slippages when opening trades, and stop loss prevents the unforeseen losses. The order placement point, take profit and stop loss values are calculated by the price change analysis algorithm, w
Icebergs
Mikhail Nazarenko
Icebergs displays areas of the greatest confrontation between major sellers and buyers on the chart. It also marks a forthcoming strong movement from a specified point. The accumulation of icebergs indicates the strength of the level and interest of major players at this level. Application Icebergs are areas marked by the indicator. They are optimal for opening trades and are also targets for taking profit. Features The indicator warns of a forthcoming movement. The indicator pattern works o
POC level
Mikhail Nazarenko
5 (1)
POC level is the most important tool for trading in the Forex market when it is impossible to see real volumes. The POC level displays the Point Of Control (POC) levels of the   Market Profile   on the chart for the area marked with a rectangle. This indicator will significantly improve the accuracy of your position entries. The indicator automatically calculates the POC level for any array of candles marked with a rectangular area. Application To get the POC level, just create and drag a rectan
POC line
Mikhail Nazarenko
5 (2)
Индикатор POC line автоматически находит накопления крупных игроков и отображает структуру перетекания объемов, в виде линии проходящей по уровням Point Of Control (POC) - максимальных горизонтальных объемов. Незаменим для торговли на рынке FOREX. Применение Уровни установки лимитных ордеров Уровни за которые прячут стоплосс Для переноса стоплосса в качестве трала Установите индикатор на любой график, и он самостоятельно найдет и выделит уровни Point Of Control свечных флетов и накоплений. Рас
MultyTrend PA
Mikhail Nazarenko
5 (2)
The indicator combines the principles of    Price Action    and a unique filtering algorithm with feedback for the three movings, this allows you to determine the pivot points and the current trend on any timeframe with a high probability.   MultyTrend PA is an evolution of the Trend PA indicator and can be used on the principle of the three Elder screens, with everything you need is displayed on the same graph. Line 1 fast moving, Line 2 main moving, Line 3 - slow moving to determine the direct
Fractal Pro
Mikhail Nazarenko
Fractal Pro   is a professional version of the display of fractals with additional filtering. Visualizes fractals by price and volume. Suitable for defining entry points for scalping and swing, as well as for intra-day, mid-term trading. Fractals - candles on which the price turned in the opposite direction. Volumetric fractal is an extremum not only in price, but also maximum in volume. Features Visualizes the location of price reversals. Marks candles that are fractals both in price and volum
Catcher trend exp
Mikhail Nazarenko
A robot that consistently shows a profitable result on history since 2000 with a spread of up to 30pips. Does not require ECN accounts. Fully automated, optimized and ready to go. It trades only pending orders, in the direction of a strong price impulse. It uses its own unique exponential entry algorithm and stop loss and take profit calculation. Catcher Trends from version 2.9 and Catcher Trends Exp work on the same algorithm, since the exponential algorithm showed the best test results! Featur
Fractal Zig Zag
Mikhail Nazarenko
A   professional version of the ZigZag indicator for visualizing the structure of price movements by fractals. Fractal ZigZag fixes the flaws of the standard version of the ZigZag indicator MT4. It uses Price action and a unique filtering algorithm to determine fractals. Suitable for all types of trading. Ideal for trading according to the WM pattern "Sniper" strategy !!! Features Marks the place of price reversal during the formation of a new fractal with specified parameters. Suitable for
Binary Monster FX
Mikhail Nazarenko
Binary Monster FX is a ready-made trading system. The real-time indicator displays the profitability of its strategy on history. This allows you to choose the most profitable currency pair and evaluate the profitability immediately, even before the start of real trading. Features Ready trading system Displays Binary Monster FX strategy trading statistics for a given number of bars of historical data. Gives a visual and audible warning when a CALL or PUT signal appears. Warns before a signal abou
USD Index Trend
Mikhail Nazarenko
The dollar index is a reliable guide for all currency pairs with the participation of the dollar USD. The indicator helps to filter out false reversals and trade strictly according to the trend. Determines the current direction of the dollar index and the trend change point. It warns with an arrow on the chart and an alert about a trend change. Ready to work with default settings. It is possible to adjust the sensitivity of the trend line. Important It is strongly discouraged to open a trading
Инструмент для торговли скальпингом с использованием профиля рынка. Позволяет торговать по рынку, а так же оттачивать навыки торговли в тестере стратегий. При минимальном интерфейсе имеет высокую функциональность и пользу для торговли от уровня Point Of Control (POC). Как торговать с помощью советника - утилиты Market profile scalper, смотрите видео. Настройки - - - - - - Market profile - - - - - - Color rectangle range 1 - цвет прямоугольника 1 диапазона свечей Color rectangle range 2 - цвет пр
Momentum Pro
Mikhail Nazarenko
Professional version of the Momentum indicator. Works great on trending currency pairs, and also accurately shows where to top up positions by trend. It displays the direction of entry on the chart with arrows and alerts when an entry point appears. With a minimal interface has high functionality. Features It has no lag and gives a noticeable advantage over the standard Momentum indicator Simple and intuitive graphical interface, minimum settings. Settings of each moving for your trading style.
Night CHF
Mikhail Nazarenko
4 (1)
Night CHF expert analyzes the market during quiet periods on the Swiss franc. Automatically determines entry levels based on price fluctuations using market inefficiencies. Features of the The unique algorithm of the advisor allows you to eliminate the negative effect of a high spread. The trade direction is determined by the intelligent adaptive algorithm of the   Night CHF   Expert Advisor. To minimize slippage and reduce risk, the EA places orders with static take profit and stop loss. It is
Fractals MT4
Mikhail Nazarenko
The Fractals MT4 indicator displays on the chart only fractals with the specified parameters in the indicator settings. This allows you to more accurately record a trend reversal, excluding false reversals. According to the classical definition of a fractal, it is a candlestick - an extremum on the chart, which was not crossed by the price of 2 candles before and 2 candles after the appearance of a fractal candle. This indicator provides the ability to adjust the number of candles before and aft
Fractals channel
Mikhail Nazarenko
Trend indicator with a unique algorithm for detecting trend reversals. It uses Price Action and its own filtering algorithm to determine the trend. The algorithm is based on a price channel based on chart fractals. This approach helps to accurately determine the entry points and the current trend on any timeframe. Recognize a new emerging trend with fewer false positives without delay. Peculiarities The advantage of the indicator is that its period is dynamic. Since it is tied not to the number
SuperTrendLine
Mikhail Nazarenko
В Super Trend Line реализован один из лучших "price action" алгоритмов трендового индикатора. В связке с авторской фильтрацией это дает максимально точное определения тренда на любых трендовых валютных парах, акциях, криптовалюте без перерисовки результата. Индикатор легко настраивается и станет дополнительным помошником в вашей торговой системе. Подходит как новичкам так и профессионалам для всех видов трендовой торговли. Как выбрать прибыльный таймфрейм и оптимизировать индикатор под валютну
筛选:
无评论
回复评论
版本 1.3 2024.05.18
Шаг распределения объема в прямоугольнике ренжа привязано к разрешению экрана, для лучшей визуализации
版本 1.2 2024.05.17
Исправлены ошибки