• 概述
  • 评论
  • 评论
  • 新特性

TIL Pivot Points Indicator

Pivot Point is a technical indicator widely used by traders to predict major price movements by calculating various levels of support and resistance. Investopedia defines the pivot point as follows:

A technical analysis indicator used to determine the overall trend of the market over different time frames. The pivot point itself is simply the average of the high, low and closing prices from the previous trading day. On the subsequent day, trading above the pivot point is thought to indicate ongoing bullish sentiment, while trading below the pivot point indicates bearish sentiment.

A pivot point analysis is often used in conjunction with calculating support and resistance levels, similar to a trend line analysis. In a pivot point analysis, the first support and resistance levels are calculated by using the width of the trading range between the pivot point and either the high or low prices of the previous day. The second support and resistance levels are calculated using the full width between the high and low prices of the previous day.

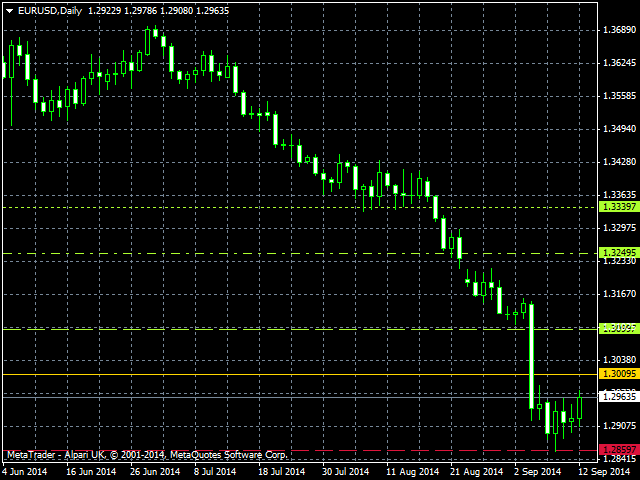
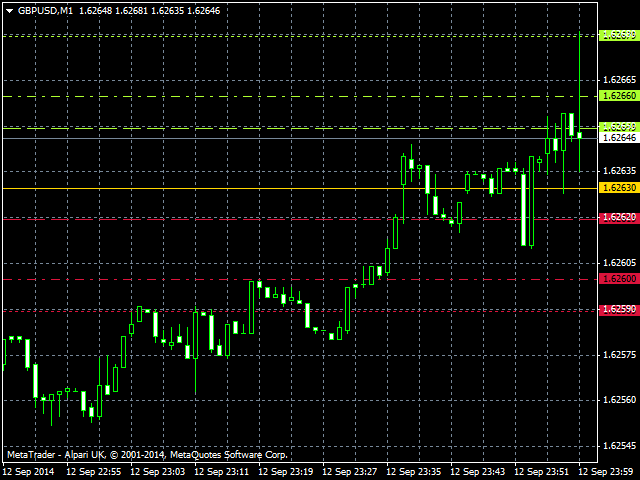
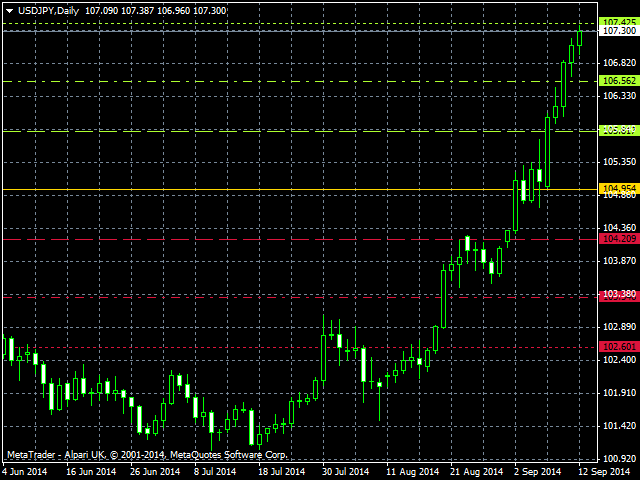
TIL Pivot Points indicator employs the seven point system:

  • Resistance 3 (R3) – dotted green line
  • Resistance 2 (R2) – dash-dotted green line
  • Resistance 1 (R1) – dashed green line
  • Pivot Point (P) – solid yellow line
  • Support 1 (S1) – dashed red line
  • Support 2 (S2) – dash-dotted red line
  • Support 3 (S3) – dotted red line

TIL Pivot Points indicator also allows you to select the base timeframe from which the pivot points and its levels are calculated. You can do this by changing the HLC (stands for High, Low, and Close) parameter. There are eleven timeframes to choose from:

  • NEXT_TIMEFRAME – this is the default setting. For example, if the current chart is H4, the pivot point is calculated from values on D1. However, if the current chart is MN, the pivot point is calculated from the values on MN as well.
  • CURRENT_TIMEFRAME – the pivot point is calculated from the values on the current timeframe.
  • M1 – the pivot point is calculated from the values on M1.
  • M5 – the pivot point is calculated from the values on M5.
  • M15 – the pivot point is calculated from the values on M15.
  • M30 – the pivot point is calculated from the values on M30.
  • H1 – the pivot point is calculated from the values on H1.
  • H4 – the pivot point is calculated from the values on H4.
  • D1 – the pivot point is calculated from the values on D1.
  • W1 – the pivot point is calculated from the values on W1.
  • MN – the pivot point is calculated from the values on MN.
推荐产品
This indicator is designed for M1 time-frame and shows: Sum of ticks when the price goes up (color Green -The major component of a candlestick = the body). Sum of points when the price goes up (color Green -The extension lines at the top of the candle). Sum of points when the price goes down (color Red -The major component of a candlestick = the body). Sum of points when the price goes down (color Red -The extension lines at the lower end of the candle). Keep in mind that Sum of Points will be g
Trend Suffer
Philip Effiong Philip
Alerts you on new trends, with ENTRY and EXIT points. INSTRUCTIONS  Select asset of choice, activate the indicator on the chart and just follow the signals from the arrows. ITS FREE, GIVE ME A GOOD RATING! Platform : Metatrader4 Asset : All Currencies, Gold, BTCUSD, NASDAQ PS : F or newbie and pro traders. Used by more 3,000 traders around the world. Send  a mail for further help and information...........
All Pivot Points Scanner
Hussein Adnan Kadhim
Support And Resistance Screener is in one level indicator for MetaTrader that provide multiple tools inside one indicator. The available tools are :  1. Market Structure Screener. 2. Bullish Pullback Zone. 3. Bearish Pullback Zone. 4. Daily Pivots Points 5. weekly Pivots Points 6. monthly Pivots Points 7. Strong Support and Resistance based on Harmonic Pattern and volume. 8. Bank Level Zones. Key Features All in one level indicator. All types of alerts ( Pop-up alert, puss notification aler
WH Auto TrendLine MT4
Wissam Hussein
5 (1)
隆重推出 Auto Trendline,这是一种创新的 MT4 指标,可自动 在您的图表上绘制趋势线。告别繁琐且耗时的手动绘制趋势线任务, 让 Auto Trendline 为您完成这项工作! *购买后联系我向您发送  说明和分步指南。 凭借其先进的算法,Auto Trendline 会自动检测并为您绘制趋势线, 从而节省您的时间和精力。只需将指标附加到您的图表,并观察它根据价格行为的高点和低点识别和绘制趋势线。 Auto Trendline 是高度可定制的,允许您调整指标的灵敏度以适合您的交易风格和偏好。 您还可以选择不同的线条样式和颜色,甚至可以设置警报以在趋势线被打破时通知您。 无论您是初学者还是经验丰富的交易者,自动趋势线都是识别和分析任何市场趋势的重要工具。 凭借其友好的用户界面和高级功能,该指标一定会提升您的交易体验并帮助您做出更明智的交易决策。 主要特征: 自动绘制趋势线 高度可定制的灵敏度设置 多种线条样式和颜色 破损趋势线的警报通知 用户友好的界面 立即试用自动趋势线,发现自动趋势线分析的好处! 相关产品 :   Auto Trend
MoveWave
Andriy Sydoruk
MoveWave - Moving waves are very handy indicators for determining pivot levels. Most Forex traders make decisions based on technical analysis. This type of analysis determines patterns and trends in the market. With the help of complex mathematical equations that are combined and made out in the form of this indicator, the trader will be able to more accurately determine the price reversal levels. Wave theory mathematically represents various behavioral models of the market. It is used as the ba
Retracement Feeder
Innovicient Limited
5 (1)
The Retracement Feeder checks for retracement opportunities after the first move has occurred.  Basically it scans for the second wave of trend. Works with any financial instrument,  It does not repaint/change color or cancel arrows, Easy to set and use. Works great with Renko Charts MT5 version:  https://www.mql5.com/en/market/product/71340 How it works The indicator is based on RSI and Stochastics.  The algorithm used in the Retracement Feeder allows the Stochastic and RSI to minimiz
Transition Trend
Tatiana Savkevych
The Transition Trend indicator shows the points of potential market reversal. The indicator's smart algorithm detects the trend, filters out market noise and generates entry signals and exit levels. Simple, visual and efficient trend detection. Uses just one parameter for settings. The indicator does not redraw and does not lag. You can set up message alerts as sound or email. Works on all currency pairs and all timeframes. Ready-made trading system.
WARNING: due to the calculations used by this indicator, it may take time to load and running it may slow down the user's terminal Description & Summary Dashboard to detect Higher-Low/Lower-High breakouts and Triangle Patterns on 28 currency pairs and up to 8 timeframes at once. Numbers on the left are the normalized values of distance between price and last Lower-High and Higher-Low if one has formed (displays "--" if none). Text will turn Red upon a Higher-Low Breakout and Green upon a Lower
Sensitive Signal
Aleksey Ivanov
5 (2)
使用作者开发的过滤方法的 “ 敏感信号 ” 指示器允许以高概率建立真实趋势运动的开始。该指标过滤随机价格走势,因此对货币兑换交易非常有效。作者开发的过滤在几次迭代中进行,揭示了常规价格运动的真实轨迹(更确切地说,这种运动的最可能的曲线)并绘制它。            “敏感信号”指示器的指示生动,非常简单,不需要注释。蓝色三角形位于价格运动的常规成分的上升趋势中,红色三角形呈下降趋势。因此,当红色三角形被蓝色替换时,买入的入口点。当蓝色三角形被红色替换时,您需要打开一个卖出位置。 指标的敏感度级别由选项决定   « Select sensitivity level» 。同时,您需要了解增加灵敏度级别不仅会减少信号的延迟,还会增加发出错误信号的可能性。 箭头也指示了价格走势发生变化的可能时刻。 指标还认为止盈是信号后价格达到的最可能值。 该指标计算并显示止损仓位线,该止损位线是根据价格概率的当前分布以及趋势逆转之前由止损价平仓的所选概率水平来计算的。             该指标还具有内置的资金管理功能,您可以在其中基于接受的风险水平,存款金额和止损仓位来计算手数。     
Why the RSI Alert Indicator is Essential for Your Trading Toolkit In the fast-paced world of trading, timely and accurate information is crucial. The RSI Alert Indicator is a powerful tool designed to help you stay ahead of the market by providing real-time alerts when the Relative Strength Index (RSI) reaches critical levels. Whether you're a novice trader or a seasoned professional, this indicator can significantly enhance your trading strategy by pinpointing potential market reversals with
Flag
Dmitry Fedoseev
An indicator of patterns #21, #22, #23 ("Flag") from Encyclopedia of Chart Patterns by Thomas N. Bulkowski. Parameters: Alerts - show alert when an arrow appears Push - send a push notification when an arrow appears (requires configuration in the terminal) PeriodBars - period in bars K - an additional parameter that influences the accuracy of pattern shape recognition. The influence of the parameter will be visible if not all of the pattern variants are enabled (not all three parameters Expandin
The indicator sends messages to e-mail and mobile terminal when the price approaches the horizontal levels and trend lines that are drawn using the handy panel! The levels and trend lines are deleted and placed to the chart using one click on the panel, and they can be dragged on the chart by mouse! It is possible to set the interval between messages in the settings, the interval is applied to each object separately! Indicator Settings ===*** Main settings ***=== - below is the list of the mai
Fibo Panda is an indicator that can help you predict the end of daily trends. If the daily price has reached the END L4 or END H4, means the Daily volume is enough. If the daily price has reached the Highest or Lowest, means the price has reached the highest or lowest level. Price must touch the End Hi or End Low Level to complete the price movement of each timeframe. A conclusion can be made whether to buy or sell. If the price is in the High Guard and Low Guard areas it means the price is now
The indicator monitors the MACD trend in multiple timeframes for a specific market. No more shifting in between charts to check the trend direction while trading. Key Features Indicator can be used for all markets Monitors every timeframe, from M1 to MN Able to move display label on chart by single click Indicator Usage The dashboard appears to the left and upper part of the chart when attached. The shell encapsulating a timeframe goes red on a down trend, green on an up trend. If the defaul
Cloud Power
Andriy Sydoruk
Implementation of indication of trend movement with moments for potential stops in the Cloud Power indicator. The transition to the shadow warns of a possible reversal. The entry of the price inside the shadow speaks of a flat movement. The indicator tracks the market trend with unmatched reliability, ignoring sharp market fluctuations and noise around the average price. Simple, visual and efficient use. The indicator does not redraw and does not lag. It can be easily used as an independent
ACB Breakout Arrows Scanner MT4
KEENBASE SOFTWARE SOLUTIONS
It's a multi-symbol and multi-timeframe scanner for our indicator - ACB Breakout Arrows . With default settings, it scans for the buy/sell signals on 28 currency pairs and 9 time-frames concurrently .  Features It can scan 252* combinations of symbols and time-frames from a single chart. Open the signal's chart loaded with a predefined template with a single click.  Easy drag n drop anywhere on the chart. Real-time alerts with popup, sound, push-notifications and email alerts.  Input Para
Market Profile
Artem Titarenko
5 (1)
The "Market Profile" indicator displays the profiles and volumes of periods – weekly, daily, session (8-hour), 4-hour, hour, summary. The VAH/VAL price area is automatically highlighted by a dotted line for each profile (except for the summary). The indicator includes chroma Delta, which colors the profile areas. The areas of prevailing Buys is colored in green, that of Sells - in red. The intensity histogram features blue/red respectively. In the filter mode, the indicator displays the volume a
Fibo Reversals
Adeniyi Adedipe
Fibo Reversals is an indicator which has carefully been put together to attempt to indicate a time period in which an ongoing trend is most probably exhausted and a new trend (actually a reversal trend) inadvertently begins. At this, it should be okay for the manual trader to be on the look out for good trading opportunities. Input Settings Father Fibo  – This Input Determines The Highest Price For The Chosen Input Period. Son Fibo  - This Input Determines The Lowest Price For The Chosen Input
为您介绍MQL4的Donchian通道指标,这是一个强大的技术分析工具,旨在提升您的交易成功率。该指标由四条线组成,代表了在指定时期内价格运动的上限和下限。 通过Donchian通道指标,您可以轻松识别市场潜在的突破和反转。上线显示指定时期内的最高点,而下线代表最低点。这两条线之间的空间形成一个通道,为您提供了有关资产交易价格范围的有价值见解。 但这还不是全部 - 我们进一步改进了这个令人难以置信的指标。我们的修改允许您按照一定百分比(表示为'shadowTop'和'shadowBottom')减小通道宽度。通过缩小通道,您可以更敏锐地感知价格波动,并准确定位入场和出场点。 无论您是经验丰富的交易者还是初学者,带有减小通道宽度的Donchian通道指标都是您交易工具箱中必备的工具。它能够让您基于市场波动和价格行为做出明智的决策。 不要错过将您的交易推向新高度的机会。体验带有减小通道宽度的Donchian通道指标的强大功能,释放您的交易潜力吧。
Trend Sim
Ivan Simonika
This is a professional Trend Sim indicator. The intelligent algorithm of the Trend Sim indicator accurately detects the trend, filters out market noise and generates input signals and exit levels. Functions with advanced statistical calculation rules improve the overall performance of this indicator. The indicator displays signals in a simple and accessible form in the form of arrows (when to buy and when to sell). Knowing the entry point of each of the currencies is very important for every
Demarker Alert
Badis Brahimi
Demarker levels cross Alert is a modified version of the classic Demarker indicator, with email and mobile alert when demarker cross High or Low levels, default levels setting are: low=0.1 and High=0.9 and Demarker of periode=10, you can modify all these entries to find the best setting for every Pair or Stock. Basically these Alerts are reversal Alerts, you will get: 1-Buy alert when Demarker cross above Low level. 2-Sell alert when Demarker cross below High level. -----------------------------
All Pivot Points
Alfred Kamal
5 (1)
Pivot Points is used by traders to objectively determine potential support and resistance levels. Pivots can be extremely useful in Forex since many currency pairs usually fluctuate between these levels. Most of the time, price ranges between R1 and S1. Pivot points can be used by range, breakout, and trend traders. Range-bound Forex traders will enter a buy order near identified levels of support and a sell order when the pair nears resistance. But there are more one method to determine Pivot p
Drawing Pack
John Louis Fernando Diamante
4 (1)
This indicator provides several drawing tools to assist in various methods of chart analysis. The drawings will keep their proportions (according to their handle trendline) across different chart scales, update in real time, and multiple drawings are supported. # Drawing Option Description  1 Grid box draggable boxed grid, user defines rows x colums, diagonal ray option  2 Grid partial or fullscreen grid, sized by handle line  3 Grid flex a diagonal grid, sized and sloped by handle line
My Point MT4
Claudia Ramona Angerer
4 (1)
Diagnosis of major and minor pivot Trend detection with many signals Can be used in all symbols Can be used in all time frames Settings: Back Show: The number of candles it displays If you need any adjustments, or have any questions or suggestions, message me How to trade: Blue: sell signal Red: buy signal Blue and red at the same time: no signal Exit signal: Opposite signal
GO Trend MultiTimeFrame
Martin Alejandro Bamonte
GoTrend 多时间框架指标 "GoTrend Multi-Timeframe" 指标是交易员寻求快速高效地评估不同时间框架内货币对整体和具体趋势的必备工具。 此指标允许交易员一目了然地获得市场方向的清晰全面视图,优化决策过程并提高其交易策略的有效性。 主要特点: 多时间框架分析: 此指标提供六个不同时间框架的详尽分析:M5, M15, M30, H1, H4 和 D1,使交易员能够了解每个时间段的趋势。 集成技术指标: 此指标使用五个可靠的技术指标:RSI, SAR, MA, MACD 和 ADX,以确定每个时间框架的趋势方向。 清晰直观的可视化: 信号显示在主图表的选定角落,使用直观的符号和颜色。这使得交易员能够一目了然地评估市场情况。 组合信号: 除了每个指标的单个信号外,"GoTrend Multi-Timeframe" 还提供一个组合信号,总结该货币对的整体市场趋势。 交易优势: 快速清晰的趋势概览: 使用此指标,交易员可以快速清晰地看到多个时间框架内的趋势方向,这对于做出知情且及时的决策至关重要。 优化进出场点: 不同时间框架内的买卖信号帮助交易员优化进出场点,增加交易成
Chart patterns scanner
Jan Flodin
4.67 (6)
这个多时间框架和多品种指标识别双顶/底,头     &     肩膀、三角旗/三角形和旗形图案。也可以仅在颈线/三角形/旗杆突破发生时设置警报(颈线突破 = 顶部/底部和头肩的确认信号)。 该指标也可用于单一图表模式。请在产品的     博客 。     结合您自己的规则和技术,该指标将允许您创建(或增强)您自己的强大系统。 特征 可以同时监控您的市场报价窗口中可见的所有交易品种。将该指标仅应用于一张图表,并立即监控整个市场。 可以监控从 M1 到 MN 的每个时间范围,并在模式被识别或颈线突破(顶部/底部和头肩)时向您发送实时警报。 支持所有 Metatrader 原生警报类型。 可以使用 RSI 作为趋势过滤器来正确识别潜在的逆转。 该指示器包括一个交互式面板。当单击一个项目时,将打开一个带有相关代码和时间范围的新图表。 该指标将信号写入一个文本文件,智能交易系统 (EA) 可以使用该文件进行自动交易。比如 这个产品 。您可以在     博客 。 输入参数 输入参数的描述和解释可以在 这里 找到。 重要的 请注意,由于具有多功能性,既不会在安装指标的图表上绘制买卖建议,也不会绘
RSI Divergence Finder
Segundo Calvo Munoz
RSI Divergence Finder Indicator will help you to find Classic Divergences between your typical RSI values and the Chart Prices as potential points of actual Trend Reversion or Pull Backs to increase your positions as per the current Trend. In some computer/VPS with old microprocessors or low RAM size, when you launch this Indicator (attach it, change settings, reset or even timeframe change) as it analyze the Chart to avoid refreshing what is not changing, it is possible to experience a bit of l
An indicator of patterns #45 and #46 (Three Falling Peaks and Three Rising Valleys) from Encyclopedia of Chart Patterns by Thomas N. Bulkowski. Parameters: Alerts - show alert when an arrow appears   Push - send a push notification when an arrow appears (requires configuration in the terminal) PeriodBars - indicator period K - an additional parameter that influences the accuracy of pattern shape recognition. The smaller the value is, the smoother the row of peaks/valleys should be, so fewer patt
Note : The slow loading of the indicator issue has been addressed . This new version loads fast and does not slow the platform. Version 1.3 : We have updated the indicator to include an historical bar scanning option . So instead of scanning all bars in the history (which can make the indicator slow sometimes ) , you can select the maximum number of bars it can scan which can increase the performance and make the indicator faster. This indicator scans the 1-3 Trendline pattern . The indic
PDP indicator is used for: defining price probability distributions. This allows for a detailed representation of the channel and its borders and forecast the probability of a price appearing at each segment of its fluctuations; defining the channel change moment. Operation principles and features PDP analyzes a quote history on lower timeframes and calculates a price probability distribution on higher ones. Forecast algorithms allow the indicator to calculate probability distributions and m
该产品的买家也购买
Atomic Analyst
Issam Kassas
5 (2)
首先值得强调的是,该交易指标是非重绘、非延迟的指标,这使其成为手动和机器人交易的理想选择。 用户手册:设置、输入和策略。 Atomic Analyst是一种PA价格行动指标,利用价格的力量和动量来寻找市场上更好的机会。配备了高级过滤器,可帮助去除噪音和假信号,并提高交易潜力。使用多层复杂的指标,Atomic Analyst扫描图表,并将复杂的数学计算转化为任何初学者都能理解并用来做出一致交易决策的简单信号和颜色。 “Atomic Analyst”是专为新手和经验丰富的交易者量身定制的综合交易解决方案。它将高级指标和一流功能融合为一体的交易策略,使其成为所有类型交易者的多功能选择。 日内交易和剥头皮策略:专为快速准确的日内交易和短期交易而设计。 日内和摆动交易策略:可用作追求价格大幅波动的日内和摆动交易者的可靠工具。 多货币和市场:凭借其可靠的精度,在不同的工具和市场上运作。 多个时间框架:可在多个时间框架上使用,性能良好。 稳定性:所有指标均不重绘、不重绘和不滞后,确保可靠的信号。 信号清晰度:提供箭头信号,用于清晰的入场和出场点。 实时警报:通过交易入场、SL和TP警报通知交
Enigmera
Ivan Stefanov
5 (3)
ENIGMERA:市场核心 https://www.enigmera.com 简介 该指标和交易系统是金融市场的一种非凡方法。ENIGMERA 利用分形周期精确计算支撑位和阻力位。它能显示真实的累积阶段,并给出方向和目标。 该系统无论在趋势中还是在修正中都能发挥作用。 它是如何运行的? ENIGMERA 由三条线组成:支撑/阻力线、目标线和偏离线。与一般市场指标将过去的数据推断为现在和未来的情况不同,该系统能提供当前的完整情况。如果你处于支撑位,这意味着真正的支撑;如果你处于阻力位,这意味着真正的阻力。如果突破某一水平,则表示趋势发生变化。没有重绘。 由于市场在不断变化,ENIGMERA 不断调整其评估工具,定期修改策略。  这保证了每种情况都能得到全面评估。这一市场指标的独特性显而易见,其能力不言而喻。  ENIGMERA 为金融分析师和咨询师提供服务,他们需要可靠的见解与客户分享,也为投资者提供服务,他们需要最精确和最可靠的保证。 该系统能够达到最佳精度,使交易者能够自信、清晰地评估他们的选择。 ENIGMERA 将 20 年的交易专长和知识整合到一个综合软件
Scalper Inside PRO
Alexey Minkov
4.73 (56)
An exclusive indicator that utilizes an innovative algorithm to swiftly and accurately determine the market trend. The indicator automatically calculates opening, closing, and profit levels, providing detailed trading statistics. With these features, you can choose the most appropriate trading instrument for the current market conditions. Additionally, you can easily integrate your own arrow indicators into Scalper Inside Pro to quickly evaluate their statistics and profitability. Scalper Inside
TPSpro RFI Levels
Roman Podpora
4.82 (22)
指示       俄罗斯 -        英语   建议 与指示器一起使用     -       TPSpro 趋势专业版 -   MT4版本       交易中的一个关键要素是做出买卖交易工具决定的区域或水平。尽管主要参与者试图隐藏他们在市场中的存在,但他们不可避免地会留下痕迹。我们的任务是学习如何识别这些痕迹并正确解释它们。 主要功能: 向卖家和买家显示活跃区域! 该指标显示所有正确的初始买入和卖出脉冲水平/区域。激活这些水平/区域后,开始寻找切入点,水平会改变颜色并填充特定阴影。此外,还会显示箭头,以便更直观地了解情况。 显示更高时间范围内的级别/区域(MTF 模式) 添加了使用更高时间间隔显示级别/区域的功能。此外,该指标还具有自动趋势检测功能(   TPSproTREND PRO   )。 用于交易的单独专业的逐步算法。 该算法专为日内交易而设计,既可顺势交易,也可逆势交易。每个活动模板均提供详细说明。 适用于多种时间范围 。 TPSpro RFI 水平指标可用于图表上的任何时间范围,从一分钟(M1)开始一直到每月(MN)。 图形和声音警报。 该指标提供图形和声音指示
Dynamic Forex28 Navigator - 下一代外汇交易工具。 当前 49% 折扣。 Dynamic Forex28 Navigator 是我们长期流行的指标的演变,将三种功能合二为一: 高级货币强度 28 指标 (695 条评论)+ 高级货币 IMPULSE 带警报 (520 条评论)+ CS28 组合信号(奖励)。 有关指标的详细信息 https://www.mql5.com/en/blogs/post/758844 下一代强度指标提供什么? 您喜欢的原始指标的一切,现在通过新功能和更高的精度进行了增强。 主要特点: 专有货币强度公式。  所有时间范围内的平滑和准确的强度线。 非常适合识别趋势和精确进入。 动态市场斐波那契水平(市场斐波那契)。  此指标独有的独特功能。 斐波那契应用于货币强度,而不是价格图表。 适应实时市场活动以获得准确的反转区域。 实时市场动量。  第 9 行显示市场是活跃还是被动。 对于定时交易至关重要。 全面的警报和显示。  每种货币最强的买入和卖出动量。 ​​28 对的双重动量买入和卖出。 超买/超卖警告外部范围
TPSproTREND PrO
Roman Podpora
4.79 (19)
TPSpro TREND PRO 是一个趋势指标,可以自动分析市场并提供有关趋势及其每次变化的信息,并给出进入交易的信号而无需重新绘制! 该指标使用每根蜡烛,分别对其进行分析。指不同的脉冲——向上或向下脉冲。货币、加密货币、金属、股票、指数交易的准确切入点! MT5版本                 指标的完整描述   我们建议将其与 指示器 -   RFI LEVELS 一起使用 主要功能: 准确的输入信号,无需渲染! 如果出现信号,它仍然相关!这是与重提指标的一个重要区别,重提指标可以提供信号然后改变信号,这可能导致存款资金的损失。现在您可以以更高的概率和准确度进入市场。还有一个功能是在箭头出现后为蜡烛着色,直到达到目标(止盈)或出现反转信号。 显示止损/获利区域 为了提高搜索切入点时的视觉清晰度,创建了一个模块,该模块最初显示买入/卖出区域,在该区域中搜索进入市场的最佳点。用于处理止损水平的附加智能逻辑有助于随着时间的推移减小其大小,从而降低进入交易(移动 sl)时的初始风险。 显示较高时间范围内的最小值/最大值(MTF 模式) 添加了一项功能,可以显示较高时间间隔的最小
FX Power MT4 NG
Daniel Stein
5 (13)
通过 mql5 和 Telegram 上 的晨间简报获取每日市场更新,包括详细信息和屏幕截图 ! FX Power MT4 NG 是我们长期以来非常受欢迎的货币强度计算器 FX Power 的下一代产品。 这款下一代强度计算器能提供什么?您所喜爱的原版 FX Power 的所有功能 附加功能 黄金/XAU 强度分析 更精确的计算结果 可单独配置的分析周期 可自定义计算限制,以获得更好的性能 为希望查看更多信息的用户提供特殊的多实例设置 无尽的图形设置,可在每个图表中设置您最喜欢的颜色 无数的通知选项,让您再也不会错过任何重要信息 采用 Windows 11 和 macOS 风格的全新圆角设计 神奇的移动指标面板 FX Power 主要功能 所有主要货币的完整强势历史 所有时间框架内的货币强弱历史 所有经纪商和图表的计算结果完全相同 100% 可靠的实时计算 -> 无重绘 可通过下拉列表选择分析时段 通过自定义模式单独配置分析时段 可在一个图表中使用多个实例 可移动 FX Power 显示屏(通过拖放) 适用于高分辨率 QHD、UHD 和 4K 显示器 自动终端配置 针对平板电脑
目前八折优惠! 对任何新手或专家交易者来说都是最好的解决方案! 这个仪表板软件适用于28种货币对。它基于我们的两个主要指标(高级货币强度28和高级货币冲动)。它对整个外汇市场提供了一个伟大的概述。它显示高级货币强度值,货币运动速度和28个外汇对在所有(9)时间段的信号。想象一下,当你可以使用图表上的单一指标观察整个市场,以确定趋势和或剥头皮的机会时,你的交易将得到改善 我们已经在这个指标中建立了一些功能,使你更容易识别强势和弱势货币,同时识别和确认潜在的交易。该指标以图形方式显示货币的强势或弱势是增加还是减少,以及它在所有时间段的表现。 增加的新功能是动态市场斐波那契水平,它适应当前的市场条件变化,这是一个已经在我们的高级货币强度28和高级货币冲动指标中使用的成熟的加分项。 在交易时,总是将弱势货币和强势货币配对,这个新指标将帮助你做到这一点。 用户手册:点击这里  https://www.mql5.com/en/blogs/post/708783 特点  显示每个时间段的ACS28和GAP-speed(冲动)的货币强度值。 列:颜色代码以7种颜色
MetaBands M4
Vahidreza Heidar Gholami
5 (2)
MetaBands使用强大且独特的算法绘制通道并检测趋势,以便为交易者提供进出交易的潜在点。它是一个通道指标和强大的趋势指标。它包括不同类型的通道,可以通过使用输入参数简单地合并以创建新通道。MetaBands使用所有类型的警报通知用户市场事件。 功能 支持大多数通道算法 强大的趋势检测算法 能够合并不同类型的通道 多时间帧和多货币(信号矩阵) 所有类型的警报功能(声音、屏幕闪烁、推送通知、电子邮件、弹出窗口、箭头) 它永远不会重绘 趋势检测 MetaBands使用在通道内振荡的蓝色线来检测趋势。当该线遇到通道的上界时,表明开始下跌趋势,当它遇到下界时,表明开始上涨趋势。如果蓝线接近中线,则市场处于整理期。 该指标使用独特的方法来检测趋势。一开始可能看起来有些复杂,但如果您观看视频教程,您就会意识到它是多么强大且易于使用。 入场和出场信号 当趋势变化或价格穿过上下通道时,MetaBands会立即通过不同的方法提醒交易者,这些方法可以在指标设置中启用。 信号矩阵 要监视来自不同时间框架的多个符号并在一个地方查看信号,请单击右上角按钮或按键盘上的M键以打开信号矩阵。该矩阵可以
TrendMaestro
Stefano Frisetti
5 (3)
note: this indicator is for METATRADER4, if you want the version for METATRADER5 this is the link:  https://www.mql5.com/it/market/product/108106 TRENDMAESTRO ver 2.4 TRENDMAESTRO recognizes a new TREND in the bud, he never makes mistakes. The certainty of identifying a new TREND is priceless. DESCRIPTION TRENDMAESTRO identifies a new TREND in the bud, this indicator examines the volatility, volumes and momentum to identify the moment in which there is an explosion of one or more of these data a
MetaTrader 4 终极黄金顾问 – 您通向成功的尖端交易工具! Ultimate Gold Advisor 不仅仅是一个简单的指标:它是将彻底改变您在 MetaTrader 4 上交易方式的 技术瑰宝 。专为满足最苛刻的交易者需求而设计,这款先进的指标结合了精准度、复杂分析和强大的功能,为您提供无与伦比的市场竞争优势。 Ultimate Gold Advisor 是交易黄金的理想选择,同时也适用于各种资产类别,它是 解锁您盈利潜力 的关键。 为什么 Ultimate Gold Advisor 是每个交易者的必备工具? 顶级性能 :该指标的胜率高达 89%,不仅可靠,而且极其有效。每笔盈利和亏损交易都清晰地显示在图表上,让您可以实时评估您的策略潜力,并根据此优化操作策略,以 数学般的精准度 最大化您的利润。 清晰即时的交易信号 :红色和蓝色的箭头精确标记交易信号,帮助您把握每一个市场机会,提供您所需的 及时性 。 实时点差监控 : Ultimate Gold Advisor 对价格的 每个波动 进行点差测量,帮助您以 精确度 计划交易。 先进的趋势检测技术 :该指标通过虚线标记关
FX Volume
Daniel Stein
4.58 (33)
通过 mql5 和 Telegram 上 的 " 晨间简报 "获取每日市场更新,包括详细信息和屏幕截图 ! 外汇交易量(FX Volume)是第一个也是唯一一个从经纪商角度真正洞察市场情绪的交易量指标。 直接在您的图表上看到这些信息是真正改变游戏规则和突破性的交易解决方案。 受益于独特的市场数据洞察,如 比率(Ratios )显示货币多头和空头头寸的比率(百分比 比率变化 显示所选时间段内的多头比率及其百分比变化 总交易量 显示货币的总交易量(多头和空头),以手为单位 多头 交易量显示货币所有多头头寸的交易量 空头 交易量显示所有货币空头头寸的交易量 净多头 显示净多头交易量,即所有多头头寸减去所有空头头寸(以手为单位)。 净多头百分比 显示货币净多头交易量的变化 请阅读我们的基本教程 -> "如何使用外汇交易量进行交易 " 获取更多信息,如常见问题、交易技巧和教程视频,请访问我们的 外汇交易量公共信息频道 请 安装并运行 SI Connect 以建立与我们数据中心的持续连接 背景信息 我们都知道,外汇是一个分散的市场。这就是为什么我们必须打破常规思维,开发一个独
Entry Points Pro
Yury Orlov
4.62 (175)
这是一款 MT4 的趋势指标,可提供准确的入场交易信号,且无重绘或延迟。 它可应用在任何金融资产:外汇、加密货币、贵金属、股票、指数。 最好的结果出现在 M15+ 的时间帧内。 指标的 MT5 版本 重要! 购买后请联系我,以便获取详细指南和奖励。 视频 (6:22) - 一个信号赢取的利润等于指标价格的三倍。 视频 (4:44) - 它如何在测试器中工作,我的提示和技巧。 视频 (1:44) - 有关它如何处理加密货币和指数的几句话。 大多数交易者在 Entry Points Pro 指标的帮助下,在第一个交易周内就改善了他们的交易结果。 Entry Points Pro 指标的益处 入场信号无重绘或延迟 如果信号出现,并得到确认(如果信号所在烛条已收盘),则它不会再消失;不像是重绘指标,它会导致重大的财产损失,因为它们可以在显示信号后再将其删除。 无差错开仓 指标算法可令您找到入场交易(买入或卖出资产)的理想时机,从而提高每位交易者的成功率。 Entry Points Pro 可操作任何资产 它允许您在 MT4 平台上交易任何经纪商提供的加密货币、股票、
Quantum Breakout Indicator PRO
Bogdan Ion Puscasu
4.96 (25)
介绍     Quantum Breakout PRO   ,突破性的 MQL5 指标,正在改变您交易突破区域的方式!   Quantum Breakout PRO 由拥有超过 13 年交易经验的经验丰富的交易者团队开发,旨在通过其创新和动态的突破区域策略将您的交易之旅推向新的高度。 量子突破指标将为您提供带有 5 个利润目标区域的突破区域的信号箭头,以及基于突破框的止损建议。 它既适合新手交易者,也适合专业交易者。 量子 EA 通道:       点击这里 MT5版本:   点击这里 重要的!购买后请私信我领取安装手册。 建议: 时间范围:M15 货币对:GBPJPY、EURJPY、USDJPY、NZDUSD、XAUUSD 账户类型:ECN、Raw 或 Razor,点差极低 经纪商时间:GMT +3 经纪商:IC Markets、Pepperstone with Raw 和 Razor 的点差最低 规格: 不重漆! 最多 5 个建议利润目标区域 建议止损水平 可定制的盒子。您可以设置自己的 Box Time Start 和 Box Time E
Advanced Currency Strength28 Indicator
Bernhard Schweigert
4.9 (650)
目前26%的折扣 任何新手或专家交易者的最佳解决方案! 这个指标是一个独特的、高质量的、可负担得起的交易工具,因为我们纳入了一些专有的功能和一个新的公式。只需一个图表,你就可以读出28个外汇对的货币强度!想象一下,你的交易将如何得到改善,因为你的交易是在你的手中进行的。想象一下,你的交易将如何改善,因为你能够准确地确定新趋势或剥头皮机会的触发点? 用户手册:点击这里  https://www.mql5.com/en/blogs/post/697384 这是第一本,原版的! 不要买一个毫无价值的崇拜者的克隆品。 特别的 子窗口中的箭头显示强劲的货币势头GAP将指导你的交易! 当基础货币或报价货币处于超卖/超买区域(外盘斐波那契水平)时,在个人图表的主窗口中出现警告信号。 当货币力量从外围区间回落时,回撤/反转警报。 十字星模式的特别警报 可选择多个时间框架,以快速查看趋势! 货币强度线在所有的时间框架中都非常平稳,当使用较高的时间框架来识别总体趋势,然后使用较短的时间框架来确定精确的入口时,效果非常好。你可以根据自己的意愿选择任何时间框架。每个时间框架都由其自身进
Blahtech Supply Demand
Blahtech Limited
4.61 (33)
Was: $299  Now: $99   Supply Demand uses previous price action to identify potential imbalances between buyers and sellers. The key is to identify the better odds zones, not just the untouched ones. Blahtech Supply Demand indicator delivers functionality previously unavailable on any trading platform. This 4-in-1 indicator not only highlights the higher probability zones using a multi-criteria strength engine, but also combines it with multi-timeframe trend analysis, previously confirmed swings
Advanced Supply Demand
Bernhard Schweigert
4.91 (294)
现在优惠 33%! 任何新手或专业交易者的最佳解决方案! 该指标是一款独特、高质量、且价格合理的交易工具,因为我们已经整合了许多专有功能和新公式。 依据此更新,您将能够显示双重时间帧区域。 您不仅可以显示一个较高的时间帧,还可以同时显示图表时间帧,加上更高的时间帧:显示嵌套时区。 供需双方所有交易者都会喜欢它。 :) 重要信息披露 高级供需的最大潜力,请访问 https://www.mql5.com/zh/blogs/post/720245   想象您的交易如何得以改善,是因为您能够精准定位入场或目标位吗? 构建于新的底层算法,它可以更轻松地识别出买卖双方之间的潜在失衡。 这是因为它以图形方式展示供需最强劲区域,及其过去的表现(显示旧区域)。 这些功能旨在帮助您更轻松地发现最佳入场区域和价位。 现在您可以针对您的交易品种和时间帧来优化和编辑区域强度! 高级供需指标适用于所有产品和时间帧。 它是一个新的公式,非常新的功能是两个区域强度函数可由用户输入进行调整! 这在交易中是一大优势。 当您学习如何使用专有功能,例如带有价格游离最小 X 因子的区域强度时,您能够判断该区域强劲与否。 供
Automated Trendlines
Georgios Kalomoiropoulos
5 (16)
趋势线是外汇交易中最重要的技术分析工具。不幸的是,大多数交易者没有正确绘制它们。自动趋势线指标是专业交易者的专业工具,可帮助您可视化市场的趋势运动。 有两种类型的趋势线看涨趋势线和看跌趋势线。 在上升趋势中,外汇趋势线是通过价格变动的最低摆动点绘制的。 连接至少两个“最低点”将创建一条趋势线。 在下跌趋势中,趋势线是通过价格走势的最高摆动点绘制的。 连接至少两个“最高点”将创建一条趋势线。 趋势线何时突破? 当看跌蜡烛收于看涨​​趋势线下方并且蜡烛的高点在趋势线上方时,看涨趋势线会被打破。 当看涨蜡烛收于看跌趋势线上方并且蜡烛的低点低于趋势线时,看跌趋势线会被打破。 趋势线何时删除? 当一根完整的蜡烛在看涨趋势线下方形成时,看涨趋势线将被删除。 当完整的蜡烛在看跌趋势线上方形成时,看跌趋势线将被删除。 您可以从输入参数更改看涨和看跌趋势线的颜色和宽度。
Order Block Hunter
Noha Mohamed Fathy Younes Badr
5 (6)
Order block hunter indicator is the best indicator for  hunt the order blocks that area where there has been a large concentration of limit orders waiting to be executed Order blocks are identified on a chart by observing previous price action and looking for areas where the price experienced significant movement or sudden changes in direction .This indicator does that for you by using very complicated codes and helps you to take the best areas To buy and sell because it make marks at the best a
TakePropips Donchian Trend Pro
Eric John Pajarillaga Aldana
4.44 (16)
TakePropips Donchian Trend Pro   (MT4) 是一款功能强大且有效的工具,可使用 Donchian 通道自动检测趋势方向,并为您提供进场和退场交易信号! 这个多功能指标包括趋势扫描器、交易信号、统计面板、筛选器、交易时段和警报历史仪表板。它旨在为您提供交易信号并节省您分析图表的时间! 您可以在我们的博文中下载用户手册和安装指南:   https   :// www.mql5.com/en/blogs/post/751368 今天立减 50%!价格从 98 美元降到 49 美元! 您可以在 Strategy Tester 上测试该指标(启用可视模式) 视频教程也可在说明下方获得更多详细信息。 如果您有任何问题或需要任何帮助,请与我联系。 TakePropips Donchian Trend Pro 指标适用于所有外汇对、金属、商品、指数和加密货币。 主要特点 交易信号 - 检测多个时间范围内所有货币对的买卖机会。它将为您提供警报并在图表上绘制交易信号,最多 3 个止盈价和一个止损价。 Trend Scanner   - 用于快速扫描和识别跨多个时间
Best Currency Strength Indicator
Tumelo Patrick Rakotsoane
4.59 (46)
Advanced Currency Strength Indicator The Advanced Divergence Currency Strength Indicator. Not only it breaks down all 28 forex currency pairs and calculates the strength of individual currencies across all timeframes , but, You'll be analyzing the WHOLE forex market in 1 window (In just 1 minute) . This indicator is very powerful because it reveals the true movements of the market.  It is highly recommended to  analyze charts knowing the performance of individual currencies or the countries ec
Allows multiple indicators to be combined into a single indicator, both visually and in terms of an alert. Indicators can include standard indicators, e.g. RSI, CCI, etc., and also Custom Indicators, even those purchased through Market, or where just have the ex4 file. An early alert is provided, say when 4 out 5 indicators have lined up, and a confirmed alert when all are in agreement. A‌lso features a statistics panel reporting the success of the combined indicator by examining the current cha
Currency Strength Exotics
Bernhard Schweigert
4.87 (30)
目前8折优惠! 对任何新手或专家交易者来说都是最好的解决方案! 这个指标是专门用来显示任何符号的货币强度,如异国货币对、商品、指数或期货。它是同类产品中的第一个,任何符号都可以添加到第9行,以显示黄金、白银、石油、DAX、US30、MXN、TRY、CNH等的真实货币强度。这是一个独特的、高质量的、负担得起的交易工具,因为我们已经纳入了一些专有的功能和一个新的公式。想象一下,你的交易将如何改善,因为你能够准确地确定新趋势或剥头皮机会的触发点? 用户手册:点击这里   https://www.mql5.com/en/blogs/post/708876 它适用于所有时间框架。你将很快能够看到TREND! 根据新的基础算法设计,它使识别和确认潜在交易变得更加容易。这是因为它以图形方式显示了8种主要货币和一种符号的强弱。 该指标显示了8种主要货币(澳元加元瑞士法郎欧元英镑日元新西兰美元)的强弱线,再加上一个符号! 该指标显示了符号的真实价值。例如:对于XAUUSD(黄金):价格以美元报价。如果黄金在上涨,你怎么能知道是黄金的强势还是美元的弱势?只有当黄金走强时,我们才会进行
訂閱指標注意事項 此信號只支援電腦版MT4 不支援MT5、手機、平板 指標只顯示當日進場箭頭 非直播指標顯示歷史箭頭 (直播為展示用) 指標為交易輔助性質 非EA自動交易 無跟單功能 指標只標示進場位置 無出場(止盈)指示 進場止損點位設定30-50 PIPS 或是前高前低做為防守 止損不需拉太遠 紅色箭頭為多方進場訊號 綠色箭頭為空方進場訊號 撐阻力強度用箭頭大小表示 此指標適用於波段策略 不適合當沖策略盤整 多空反轉時不適用 指標載入後 右下角都會預設顯示盤整 載入指標一小時後 才會顯示多空 加入Youtube頻道會員 可參加每個月一次實體抽獎活動(台灣以外地區,獎品折現金用Paypal匯出) 每月抽獎時間為非農數據公布當週的週末盤勢分析(2100) 得獎者必須抽獎時在線上,逾期不候
NAM Order Blocks
NAM TECH GROUP, CORP.
5 (1)
MT4多時限訂單塊檢測指示器。 特徵 -在圖表控制面板上完全可自定義,提供完整的交互。 -隨時隨地隱藏和顯示控制面板。 -在多個時間範圍內檢測OB。 -選擇要顯示的OB數量。 -不同的OB用戶界面。 -OB上的不同過濾器。 -OB接近警報。 -ADR高低線。 -通知服務(屏幕警報|推送通知)。 概括 訂單塊是一種市場行為,它指示從金融機構和銀行收取訂單。著名的金融機構和中央銀行帶動了外匯市場。因此,交易者必須知道他們在市場上正在做什麼。當市場建立訂單塊時,它會像發生大多數投資決策的範圍一樣移動。 訂單建立完成後,市場將朝著上升和縮小的方向發展。訂單大宗交易策略的關鍵術語是它包括機構交易者正在做的事情。由於它們是主要的價格驅動因素,因此包括機構交易在內的任何策略都可以。 您將在任何時間範圍內實時看到訂單塊,使用我們的控制面板,您將能夠在所選的歷史記錄週期內檢測常規,拒收和未大寫的訂單塊。 現在您可以接收到訂單塊接近警報,我們在MT4上顯示屏幕通知,並將通知推送到您的手機!
Harmonic Papallons
Ramon Sobrevals Arce
3.33 (3)
Automatically scans the chart to find Harmonic Patterns, and give you the chance to enter early in good operations. Also if selected, it will alert you in advance when future patterns appears, showing you a projection of a posible future pattern. The main goal  for this algorithm is to determine with high precision the moment when a trend ends and a new one begins. Giving  you the best price within a reversal.   We have added the "Golden Trade", we define it as the perfect order: For those orde
Gold Channel XAUUSD
Paulo Rocha
5 (2)
Gold Channel is a volatility-based indicator, developed with a specific timing algorithm for the XAUUSD pair, which consists of finding possible corrections in the market. This indicator shows two outer lines, an inner line (retracement line) and an arrow sign, where the theory of the channel is to help identify overbought and oversold conditions in the market. The market price will generally fall between the boundaries of the channel. If prices touch or move outside the channel it is a tra
NextCandlePredictor No Repaint
Martin Alejandro Bamonte
1 (1)
NextCandlePredictor 指标 NextCandlePredictor 是一种带有警报的信号指标,不会重绘,不会改变颜色,不会移动,不会消失且没有延迟。它将帮助您识别任何时间框架内的下一个或即将到来的蜡烛的方向。高度推荐用于纽约、伦敦或甚至两者重叠等高波动市场。 主要特征: 时间框架的多功能性: 提供在任何时间框架内快速准确的信号,从 M1 到 H1 及更长时间。 清晰的买入/卖出信号: 使用 ADX 的 DI+ 和 DI- 线生成清晰的买入和卖出信号,确保您做出最佳的交易决策。 直观的可视化: 信号直接显示在图表上,绿色(买入)和红色(卖出)箭头,允许快速和轻松的读取。 可自定义的设置: 根据您的偏好和交易策略调整分析的柱数和警报选项。请根据您希望使用的 TF 查看下面的建议表。 即时和蜡烛收盘时的可选警报: 默认情况下,警报会在满足 ADX 条件的同一蜡烛上发出,确保信号的及时性。您还可以选择在当前蜡烛收盘时接收警报以获得更多确认。 快速性能: 设计为高效运行,理想用于高频操作和快速决策。 不重绘: 一旦信号发出,它将固定在当前蜡烛上,不会移动、改变颜色或消失。 无延
Trend Navigato
Oleksii Ferbei
The Forex indicator   TrendNavigator   is a technical indicator. TrendNavigator is a tool that allows traders employing this strategy to better understand what is happening in the market and predict in which direction the price will continue to move. The indicator's values are calculated based on price movements of the currency pair or any other financial asset. Within the scope of technical analysis, the TrendNavigator indicator is used by traders to forecast future price values or the overall
Royal Scalping Indicator M4
Vahidreza Heidar Gholami
4.17 (6)
Royal Scalping Indicator is an advanced price adaptive indicator designed to generate high-quality trading signals. Built-in multi-timeframe and multi-currency capabilities make it even more powerful to have configurations based on different symbols and timeframes. This indicator is perfect for scalp trades as well as swing trades. Royal Scalping is not just an indicator, but a trading strategy itself. Features Price Adaptive Trend Detector Algorithm Multi-Timeframe and Multi-Currency Trend Low
作者的更多信息
As the name implies, TIL Daily OHLC is a simple, straightforward yet effective tool to keep track of yesterday’s last Open, High, Low and Close prices. Any experienced trader knows the importance of these price levels – they are often used to navigate and predict the current day’s trend and price action as strong support and resistance. When applied to a chart, the indicator shows 4 plots that projects the 4 price levels from the previous day to the next one. Each price level is color coded and
FREE
TIL Multi RSI indicator applies RSI to 28 currency pairs all at once and displays the most current signal of each one in a two-column list. The currency pairs involved are the combinations of the eight major currencies (USD, EUR, GBP, CHF, JPY, CAD, AUD, and NZD). All the currency pairs are sorted automatically from the one with the highest signal down to the one with the lowest signal in a two-column list starting from the top left to the bottom right. Just a quick recap on what the Relative St
TIL New Bar Timer executes one simple yet very powerful task - it displays the time left before a new bar forms in any timeframe. With this indicator, you can effectively prepare to enter or exit trades in most occasions, as TIMING IS EVERYTHING. TIL New Bar Timer also changes color gradually as the timer ticks down to zero. This helps the user to estimate quickly how much time there is left in one glance. There are basically three colors that the timer changes to: Red - this means that a new ba
TIL Currency Performance Meter is an intuitive technical indicator for quantifying and visualizing the current momentum and relative strength of the eight major currencies, namely: USD, EUR, GBP, CHF, JPY, CAD, AUD, and NZD, on all timeframes. This is achieved by calculating and consolidating the price percent changes of 28 currency pairs from a certain point in time. The indicator generates a chart wherein each currency is represented by a color-coordinated bar that either shoots up or drops do
The Doji candlestick pattern is characterized by one that has its open and close prices nearly (if not exactly) equal and resembles the shape of a cross. It is often regarded as a sign of indecision and is especially significant if seen in a down trend or up trend, which potentially signals that sellers or buyers are losing conviction. The TIL Doji Price Action finds and marks all Doji candlestick patterns and intelligent approximations thereof. In addition, it predicts the direction of price wi
The TIL Timeframe Overlay indicator is the perfect tool for multiple timeframe analysis . It does the simple yet powerful task of overlaying a candlestick chart of a different timeframe over another allowing you to see the BIGGER picture and see the underlying TREND amid the noise and volatile price action. Please see the screenshots below for examples. Features: It works in ALL timeframe. It works in ANY instrument/symbol. Displays ENTIRE candlesticks (body and wick) of other timeframes includi
Fibonacci retracement is one of the most reliable and used technical analysis tools for trading. It uses the so called “golden ratio” to predict certain levels of support (price movement reverses from downward to upward) and resistance (price movement reverses from upward to downward) which is a mathematical pattern seen through out nature and even the universe. Because so many traders make use of this trading strategy and watch these price levels, more often than not the Fibonacci levels become
Trading Indicator Lab’s Trend Navigator for MT4 is an indicator that can help you reveal the underlying trends in any chart on any timeframe. Determining Trends It only takes a minute or two to analyze the indicator with its simple yet insightful methods of representing bullish, bearish and ranging price action across the chart. It forms a single line that runs in 3 directions: Upward direction – represents a significant bullish price action Horizontal direction – represents ranging price action
Trading Indicator Lab’s Candle Volume Heatmap for MT4 merges volume with price by applying gradient-colored dots on the bars. It can also detect bars that have the most volume and the least volume. Gradient Coloring When applied to a chart, the Candle Volume Heatmap indicator applies colored dots to each bar which may vary according to its volume. The chart becomes a heatmap where you can easily spot which parts of the bar history are “hottest” or the bars that had the greatest number of volume
Trading Indicator Lab's Volume by Price is a volume-based indicator for MT4 that reveals price levels with the most and least volume for each bar within a given period. How It Works You can think of the indicator as a running volume profile that displays the most voluminous price level and the price level that has the least volume. For each bar, the indicator calculates the volume vertically in the price axis. As this is calculated, the indicator creates 2 signals: (1) a large red dot which repr
筛选:
无评论
回复评论
版本 1.1 2021.11.21
Recompiled for newer MT4 builds