• 概述
  • 评论
  • 评论
  • 新特性

Smart Trading Signals

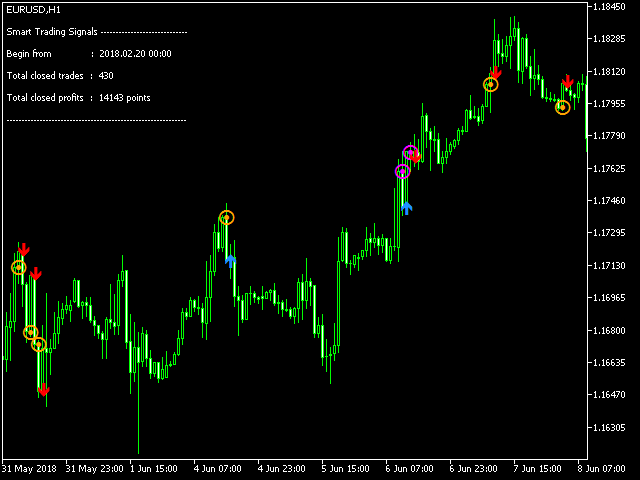
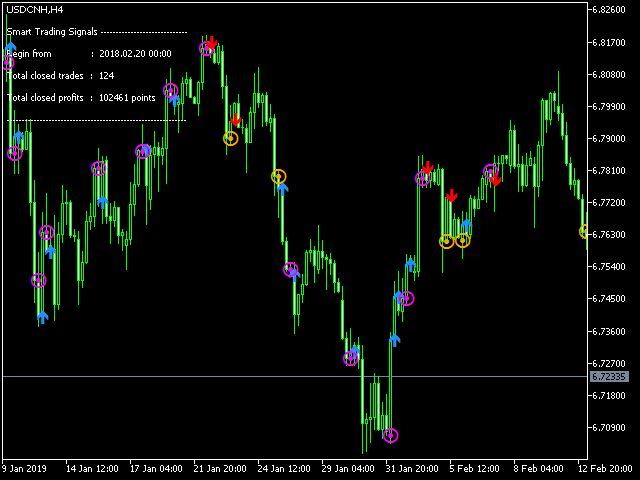
这是一个会自我学习的指标。你需要设定一个起始时间,并下载相应的历史数据,让它进行学习。学习的规则限制尽量少,给予指标最大的自由度。因此,以学习期间的最佳结果为选取原则,并不保证每次交易都是盈利的。通常而言,学习时间越长,结果越可靠。
在策略测试器中,你需要设定时间参数,早于测试开始的时间,以便让指标有充足的学习时间。

指标会发出买入或者卖出的信号,以箭头的方向作出区分。指标亦会发出关闭信号,以不同颜色的圆点作区分。

*************************************************************************************************************************************


推荐产品
Before installing the HeatMap indicator make sure you are using a broker that gives you access to the Depth of market (DOM) !! This indicator creates a heatmap on your chart allowing you to see the buy or sell limit orders easily and in real time. You have the possibility to change the setting and the colors of the HeatMap in order to adapt to all markets and all charts. Here is an example of a setting you can use with the NASDAQ100 on the AMPGlobal broker :  https://www.youtube.com/watch?v=x0
Crash 1000 Scalping Indicator for the Crash 1000 Deriv Synthetic Index. Introduction The Crash 1000 Scalping Indicator is a specialized tool designed for the Crash 1000 index on the Deriv Synthetic market. This indicator is particularly useful for scalping on the M1 timeframe, helping traders to identify precise entry and exit points for buy positions. It is designed to be non-repainting, providing clear signals with audible alerts and push notifications, and is compatible with mobile devices th
Adjustable Consecutive Fractals  looks for 2 or more fractals in one direction and sends out a on screen alert, sound alert and push notification, for strong reversal points . Adjustable Consecutive Fractals, shows the fractals on chart along with a color changing text for buy and sell signals when one or more fractals appear on one side of price. Adjustable Consecutive Fractals is based Bill Williams Fractals . The standard Bill Williams fractals are set at a non adjustable 5 bars, BUT withe
Blahtech Market Profile MT5
Blahtech Limited
5 (9)
Was: $249  Now: $99   Market Profile defines a number of day types that can help the trader to determine market behaviour. A key feature is the Value Area, representing the range of price action where 70% of trading took place. Understanding the Value Area can give traders valuable insight into market direction and establish the higher odds trade. It is an excellent addition to any system you may be using. Inspired by Jim Dalton’s book “Mind Over Markets”, this indicator is designed to suit the
**   All Symbols   x   All Timeframes   scan just by pressing scanner button ** *** Contact me  to send you instruction and add you in "Head & Shoulders Scanner group" for sharing or seeing experiences with other users. Introduction: Head and Shoulders   Pattern  is a very repetitive common type of price reversal patterns.   The pattern appears on all time frames and can be used by all types of traders and investors.   The  Head and Shoulders  Scanner indicator  Scans All charts just by pressing
- This is the exact conversion from TradingView: "Support/Resistance" By "BarsStallone". - This indicator lets you read the buffers for R/S values. - This is a non-repaint and light processing load indicator. - This is not a multi time frame indicator If you want the multi time frame version you should create a personal order and I deliver two files that you need them both to have the multi time frame indicator running on your system. - The MT4 version of the indicator is not light load from pr
General Description In the simplest terms this is a contrarian intra-day scalping system. Built to try and let correct trades run as far as possible and flip the trade when indicated. The indicator looks at historical daily trading ranges to lay out levels at which it takes long and short positions based on the statistical levels. The indicator is built around index futures, mainly around S&P and the DOW but can be used an any futures contract mainly using AMP Futures to trade. The indicator is
该指标将向您显示您已经为图表上的每个订单设置的 TP 和 SL 值(以该货币表示)(接近交易/订单行),这将帮助您估算每个订单的利润和损失。它还会向您显示 PIP 值。显示的格式是“我们的损益/PIP 值的货币值”。 TP 值将以绿色显示,SL 值将以红色显示。 如有任何问题或了解更多信息,请随时通过 fxlife.asia@hotmail.com 或 fxlife.asia@yahoo.com 与卖家联系 (而指标中即将加入的下一个功能是“自动或半自动TP和SL设置”,我们的客户将免费获得更新版本。谢谢...^_^) (或者如果您认为在指示中应该增加一些功能,请随时告诉我们) ========================================================
Your Trend Friend
Luigi Nunes Labigalini
5 (1)
The trend is your friend! Look at the color of the indicator and trade on that direction. It does not  repaint. After each candle is closed, that's the color of the trend. You can focus on shorter faster trends or major trends, just test what's most suitable for the symbol and timeframe you trade. Simply change the "Length" parameter and the indicator will automatically adapt. You can also change the color, thickness and style of the lines. Download and give it a try! There are big movements
Hello There, Today I want to show you my new researchable fore BUY SELL indicator, it work all asset, and also work Derive Volatility asset! it work all time frame, but i recommend start 5 minute to H1 when you receive a signal just take trade and stay wait for your take profit asset All Major Pair And minor IT WORK ALSO XAUUSD Fantastic results,  for more info,,, message us thank you   
Antique Trend
Nadiya Mirosh
The Antique Trend Indicator is a revolutionary trend trading and filtering solution with all the important features of a trend tool built into one tool! The Antique Trend indicator is good for any trader, suitable for any trader both for Forex and binary options. There is no need to configure anything, everything has been perfected by time and experience, it works great during flats and trends. The Antique Trend indicator is a tool for technical analysis of financial markets, reflecting curre
To download MT4 version please click here . This is the exact conversion from TradingView: "WaveTrend [LazyBear]" By "zeusuk3". One of the coolest indicators out there to detect overbought and oversold zones. It can be used as a part of more complicated strategy and for confirming a potential trade setup. There are buffers to use in EAs also. The indicator is loaded light and non-repaint. - You can message in private chat for further changes you need. Thanks for downloading 
Cycles Forecast
Pooriya Alirezaee
This indicator is based on a mathematical formula and an ANN combined, designed to make a model(using previous prices) of the most recent market condition (any chart*) in order to use the model as a forecasting tool. *This indicator can operate on any chart/timeframe, but it's suggested you use multiple timeframes for each trade because this method relies solely on the time factor, you can not use this indicator to predict price volatility, but if it's fit correctly it will show you when the nex
其中一个数字序列称为“森林火灾序列”。它被公认为最美丽的新序列之一。它的主要特点是该序列避免了线性趋势,即使是最短的趋势。正是这一属性构成了该指标的基础。 在分析金融时间序列时,该指标试图拒绝所有可能的趋势选项。只有当他失败时,他才会认识到趋势的存在并给出适当的信号。这种方法可以让人们正确地确定新趋势开始的时刻。然而,误报也是可能的。为了减少它们的数量,该指标添加了一个额外的过滤器。当新柱打开时会生成信号。在任何情况下都不会发生重绘。 指标参数: Applied Price   - 应用价格常数; Period Main   - 指标的主要周期,其有效值在 5 - 60 之间; Period Additional   - 附加周期,此参数的有效值为 5 - 40; Signal Filter   - 附加信号滤波器,有效值 0 - 99; Alerts   - 启用后,指示器会在出现新信号时提醒您; Send Mail   - 允许指标向电子邮件发送消息; Push   - 允许您发送 Push 消息。
Noize Absorption Index
Ekaterina Saltykova
Noize Absorption Index - is the manual trading system that measures the difference of pressure between bears forces and bulls forces. Green line - is a noize free index that showing curent situation. Zero value of index shows totally choppy/flat market.Values above zero level shows how powerfull bullish wave is and values below zero measures bearish forces.Up arrow appears on bearish market when it's ready to reverse, dn arrow appears on weak bullish market, as a result of reverse expectation.
Be notified of every color change of Heiken Ashi (HA) candles. The indicator will trigger past and new signals every time that HA candles change their colors. ( Note : this tool is based on the code of Heiken Ashi indicator developed by MetaQuotes Software Corp.) Features The signals are triggered at closing of last bar/opening of a new bar; Any kind of alerts can be enabled: Dialog Box, Email message, SMS notifications for smartphones and tablets, and Sound alerts; By default, up arrows are p
The new update makes this indicator a complete tool for studying, analyzing and operating probabilistic patterns. It includes: On-chart Multi-asset percentage monitor. Configurable martingales. Twenty-one pre-configured patterns, including Mhi patterns and C3. An advanced pattern editor to store up to 5 custom patterns. Backtest mode to test results with loss reports. Trend filter. Hit operational filter. Martingale Cycles option. Various types of strategies and alerts. Confluence between patter
Riko Trend mt5
Nadiya Mirosh
The Riko Trend indicator is a revolutionary trend trading and filtering solution with all the important features of a trend tool built into one tool! The Riko Trend indicator is good for any trader, suitable for any trader for both forex and binary options. You don’t need to configure anything, everything is perfected by time and experience, it works great during a flat and in a trend. The Riko Trend indicator is a technical analysis tool for financial markets that reflects the current price
Elevate Your Trading Experience with Wamek Trend Consult!   Unlock the power of precise market entry with our advanced trading tool designed to identify early and continuation trends. Wamek Trend Consult empowers traders to enter the market at the perfect moment, utilizing potent filters that reduce fake signals, enhancing trade accuracy, and ultimately increasing profitability.   Key Features: 1. Accurate Trend Identification: The Trend Consult indicator employs advanced algorithms and unparall
Trendline mt5 indicator
David Muriithi
3 (1)
Are you tired of drawing trendlines every time you're analyzing charts? Or perhaps you would like more consistency in your technical analysis. Then this is for you. This indicator will draw trend lines automatically when dropped on a chart. How it works Works similar to standard deviation channel found on mt4 and mt5. It has 2 parameters: 1. Starting Bar 2. Number of bars for calculation The   starting bar   is the bar which drawing of the trend lines will begin, while the   number of bars for c
FREE
Market Session Visual
Kambiz Shahriarynasab
The  Market Sessions Indicator for MT5 helps you  predict market turnarounds  by detecting major supply and demand areas. These pivot points tend to occur after a new session has started and the previous one is still open. It is also used to gauge how many points or pips the market moves on average during a session. This helps us to place better our take profits and stop losses. The indicator works on all forex pairs, gold, silver, commodities, stocks, indices and any other instrument that yo
Balance Aggression
Edson Cavalca Junior
The indicator measures the balance of aggression. The formula is as follows:   Aggression  = Purchase Volume - Sales Volume. Note : It is rec ommended to use the default configuration and VPS values. It does not work in Forex. Meet Our Products     Parameters : Numbers of days prior to the current one for calculation; Volume Divider e; Enables calculation of the current candle; Histogram Line style and; Size; Line Line style and; Size;  Follow us on our website to check the next new
KT Renko Patterns MT5
KEENBASE SOFTWARE SOLUTIONS
KT Renko Patterns scans the Renko chart brick by brick to find some famous chart patterns that are frequently used by traders across the various financial markets. Compared to the time-based charts, patterns based trading is easier and more evident on Renko charts due to their uncluttered appearance. KT Renko Patterns features multiple Renko patterns, and many of these patterns are extensively explained in the book titled Profitable Trading with Renko Charts by Prashant Shah. A 100% automate
Alpha Trend Pro
Eslam Mohamed Abdelrady Shehata
Alpha Trend Pro: Your Ultimate Trading Companion Embark on a new era of trading with Alpha Trend Pro Indicator. Crafted with precision and innovation, Alpha Trend is designed to elevate your trading experience by seamlessly blending powerful elements to navigate various market conditions. **Key Features:** **1. Dynamic Adaptability:**    - In sideways market conditions, Alpha Trend acts as a dead indicator. Say goodbye to many false signals and welcome a tool that adapts seamlessly to mar
True Day
Aurthur Musendame
5 (1)
True Days is a tool designed specifically for the trader who wants to catch intraday volatility in price charts.  True day makes it easier for the trader to avoid trading in the dead zone - a period in time where markets are considered dead or non volatile. The trader can concentrate on finding opportunities only during periods of profound market movements. By default the indicator gives you a true day starting at 02:00 to 19:00 hours GMT+2. You can adjust according to your Time Zone. By deafult
FREE
An indicator of patterns #9 and #10 ("Cup with handle") from Encyclopedia of Chart Patterns by Thomas N. Bulkowski. Parameters: Alerts - show alert when an arrow appears Push - send a push notification when an arrow appears (requires configuration in the terminal) PeriodBars - indicator period K1 - an additional parameter that influences the accuracy of recognition and pattern shape (the lower the value, the smoother the cup edge is) K2 - an additional parameter that influences the accuracy o
Hello I Want to introduce The Forex Buy Sell Arrow Premium MT5 i recently release this premium indicator! its 1000% Non Repaint Indicator, It Work Perfectly Well,, i tested it day by day, Just mind blowing Result,  Including Powerful trend Algorithm! How It Work? well, it work market trend formula, when trend Bullish Or when trend Bearish,  Recommend Timeframe M30, H1 it work all timeframe, and all currency pair, 100% non repaint, How to take signal From Forex Buy Sell Arr
Blahtech VWAP MT5
Blahtech Limited
5 (1)
Was: $69  Now: $34   Blahtech VWAP - Volume Weighted Average Price (VWAP) is the ratio of price to total volume. It provides an average price over a specified time interval.  Links [  Install  |  Update  |  Documentation   ] Feature Highlights Configurable VWAP Line Sessions, intervals, anchored or continuous Previous day settlement line Standard Deviation bands Alerts at bar close or real time Automatic Broker or Tick volumes Significantly reduced CPU usage Input Parameters Expert Advisor
Medias colors
Sergio Domingues
O indicador media colors se baseia num canal que pode ser criado a partir de duas médias Media colors  é um indicador de tendência utilizado no trading para identificar a direção predominante do mercado. Pode ser baseado na Média Móvel Simples (SMA) e na  Média Móvel Exponencial  (EMA) que dá mais peso aos preços mais recentes, tornando-a mais sensível às mudanças de preço. Como Funciona: Cálculo:   A EMA é calculada aplicando um fator de suavização aos preços de fechamento de um ativo financeir
Fibonacci and RSI Demo version MQL5
Carlos Daniel Vazquez Rosas
Fibonacci and RSI. Demo versión only works with GBPUSD. For full version, please, visit visit https://www.mql5.com/en/market/product/52101 The indicator is a combination of the Fibonacci and RSI indicators. Every time the price touches one of the fibonacci levels and the rsi condition is met, an audible alert and a text alert are generated. Parameters number_of_candles : It is the number of candles that will be calculated. If you put 100, the indicator will give you the maximum and min
FREE
该产品的买家也购买
TPSpro RFI Levels MT5
Roman Podpora
4.73 (11)
指示       俄罗斯 -        英语   建议 与指示器一起使用     -       TPSpro 趋势专业版 -   MT4版本       交易中的一个关键要素是做出买卖交易工具决定的区域或水平。尽管主要参与者试图隐藏他们在市场中的存在,但他们不可避免地会留下痕迹。我们的任务是学习如何识别这些痕迹并正确解释它们。 主要功能: 向卖家和买家显示活跃区域! 该指标显示所有正确的初始买入和卖出脉冲水平/区域。激活这些水平/区域后,开始寻找切入点,水平会改变颜色并填充特定阴影。此外,还会显示箭头,以便更直观地了解情况。 显示更高时间范围内的级别/区域(MTF 模式) 添加了使用更高时间间隔显示级别/区域的功能。此外,该指标还具有自动趋势检测功能(   TPSproTREND PRO   )。 用于交易的单独专业的逐步算法。 该算法专为日内交易而设计,既可顺势交易,也可逆势交易。每个活动模板均提供详细说明。 适用于多种时间范围 。 TPSpro RFI 水平指标可用于图表上的任何时间范围,从一分钟(M1)开始一直到每月(MN)。 图形和声音警报。 该指标提供图形和声音指示
Atomic Analyst MT5
Issam Kassas
4.42 (19)
首先值得强调的是,该交易指标是非重绘、非延迟的指标,这使其成为手动和机器人交易的理想选择。 用户手册:设置、输入和策略。 Atomic Analyst是一种PA价格行动指标,利用价格的力量和动量来寻找市场上更好的机会。配备了高级过滤器,可帮助去除噪音和假信号,并提高交易潜力。使用多层复杂的指标,Atomic Analyst扫描图表,并将复杂的数学计算转化为任何初学者都能理解并用来做出一致交易决策的简单信号和颜色。 “Atomic Analyst”是专为新手和经验丰富的交易者量身定制的综合交易解决方案。它将高级指标和一流功能融合为一体的交易策略,使其成为所有类型交易者的多功能选择。 日内交易和剥头皮策略:专为快速准确的日内交易和短期交易而设计。 日内和摆动交易策略:可用作追求价格大幅波动的日内和摆动交易者的可靠工具。 多货币和市场:凭借其可靠的精度,在不同的工具和市场上运作。 多个时间框架:可在多个时间框架上使用,性能良好。 稳定性:所有指标均不重绘、不重绘和不滞后,确保可靠的信号。 信号清晰度:提供箭头信号,用于清晰的入场和出场点。 实时警报:通过交易入场、SL和TP警报通知交
Atbot
Zaha Feiz
4.91 (34)
AtBot: 它是如何工作的以及如何使用它 ### 它是如何工作的 “AtBot”指标用于MT5平台,通过结合技术分析工具生成买入和卖出信号。它集成了简单移动平均线(SMA)、指数移动平均线(EMA)和平均真实波幅(ATR)指标,以识别交易机会。此外,它还可以利用Heikin Ashi蜡烛来增强信号的准确性。 购买后留下评论,您将获得特别的奖励礼物。 ### 主要特点: - 不重绘: 信号在绘制后不会改变。 - 不变动: 信号保持一致,不会被更改。 - 无延迟: 提供及时的信号,没有延迟。 - 多种时间框架: 可在任何时间框架上使用,以适应您的交易策略。 ### 操作步骤: #### 输入和设置: - firstkey (TrendValue): 调整趋势检测的灵敏度。 - Secondkey (SignalValue): 定义买入/卖出信号生成的灵敏度。 - masterkey (ExitValue): 控制信号的退出策略。 - h: 切换是否根据Heikin Ashi蜡烛生成信号(真/假)。 - notifications: 启用或禁用信号提醒。 #### ATR计算: ATR测
Gold Stuff mt5
Vasiliy Strukov
4.92 (165)
Gold Stuff mt5 是专为黄金设计的趋势指标,也可用于任何金融工具。 该指标不会重绘,也不会滞后。 推荐时间框架 H1。 购买后立即联系我以获得设置和个人奖励!   你可以在我的个人资料中找到它。   重要! 购买后立即与我联系,以获得说明和奖金!   您可以免费收到我们的强力支持和趋势扫描指标的副本,请私信。大部头书!   设置 绘制箭头 - 打开关闭。 在图表上绘制箭头。 警报 - 打开关闭声音警报。 电子邮件通知 - 打开关闭。 电子邮件通知。 Puch-notification - 打开关闭。 推送通知。 接下来,调整色域。 Gold Stuff mt5 是专为黄金设计的趋势指标,也可用于任何金融工具。 该指标不会重绘,也不会滞后。 推荐时间框架 H1。 购买后立即联系我以获得设置和个人奖励!   设置 绘制箭头 - 打开关闭。 在图表上绘制箭头。 警报 - 打开关闭声音警报。 电子邮件通知 - 打开关闭。 电子邮件通知。 Puch-notification - 打开关闭。 推送通知。 接下来,调整色域。
首先,值得强调的是,这个交易系统是一个非重绘、非重画和非滞后的指标,这使得它非常适合手动和机器人交易。 在线课程,手册和下载预设。 “智能趋势交易系统 MT5”是专为新手和经验丰富的交易者量身定制的综合交易解决方案。它结合了超过 10 个优质指标,具有 7 多个强大的交易策略,使其成为适用于各种市场条件的多功能选择。 趋势跟随策略:提供精确的入场和止损管理,以有效地跟随趋势。 反转策略:识别潜在的趋势反转,使交易者能够利用区域市场的机会。 剃头策略:专为快速准确的日内交易和短期交易而设计。 稳定性:所有指标都不会重绘、不会重画和不会滞后,确保可靠的信号。 定制:支持自定义策略,以满足个人交易偏好。超过 7 种策略和组合可帮助您找到最佳策略。 信号清晰度:提供箭头信号,以指示清晰的入场和退出点。 实时警报:通过交易进出警报使交易者保持了解。 深入分析:提供更高时间框架的趋势分析和实时交易监控。 自适应颜色编码:利用蜡烛颜色编码来显示成交量、趋势和反转蜡烛信号。通过蜡烛颜色分析市场方向。 “智能趋势交易系统 MT5”赋予交易者必要的工具,以便在各种市场条件下做出明智和战略性的交易决策。无论
Quantum Trend Sniper
Bogdan Ion Puscasu
4.8 (49)
介绍   量子趋势狙击指标 ,突破性的 MQL5 指标,正在改变您识别和交易趋势反转的方式!由拥有超过13年交易经验的资深交易员团队开发,     量子趋势狙击指标   旨在通过其创新的方式以极高的准确度识别趋势反转,将您的交易之旅推向新的高度。 ***购买量子趋势狙击指标,即可免费获得量子突破指标!*** 当量子突破指标识别出趋势反转时,它会向您发出警报和信号箭头,并建议您三个止盈水平。 它既适合新手交易者,也适合专业交易者。 量子 EA 通道:       点击这里 MT4版本:       点击这里 建议: 时间范围: 所有时间范围。为了获得最佳结果,我们建议在 M15、M30 和 H1 时间范围内使用它。 货币对:欧元兑美元、英镑兑美元、澳元兑美元、欧元兑英镑、, EURAUD,  XAUUSD 账户类型:ECN、Raw 或 Razor,点差极低 经纪时间:任意 经纪商:IC Markets、Pepperstone with Raw 和 Razor 的点差最低 建议止损:50 点 建议止盈水平:20 点、50 点和
该仪表盘显示所选符号的最新可用谐波形态,因此您可以节省时间并提高效率 /  MT4 版本 。 免费指标:  Basic Harmonic Pattern 指标列 Symbol:   显示所选符号 Trend:     看涨或看跌 Pattern:    形态类型(Gartley、蝴蝶、蝙蝠、螃蟹、鲨鱼、Cypher 或 ABCD) Entry:     入口价格 SL: 止损价 TP1: 第一止盈价 TP2: 第二次获利价格 TP3: 第三次获利价格 Current price:    当前价格 Age (in bars):   最后绘制的模式的年龄 主要输入 Symbols :   从 "28 种主要货币对 "或 "选定符号 "中选择。 Selected Symbols :   希望监控的符号,用逗号分隔("EURUSD,GBPUSD,XAUUSD")。如果您的经纪商为货币对设置了后缀或前缀,您必须在以下两个参数中添加(货币对前缀或货币对后缀)。 Max Iteration:   调整模式的最大迭代次数(如果该值越小,则模式越少,性能越快;如果该值越大,则模式越多,性能
FX Power MT5 NG
Daniel Stein
5 (5)
通过 mql5 和 Telegram 上 的晨间简报获取每日市场更新,包括详细信息和屏幕截图 ! FX Power MT5 NG 是我们长期以来非常受欢迎的货币强度计算器 FX Power 的下一代产品。 这款下一代强度计算器能提供什么?您所喜爱的原版 FX Power 的所有功能 附加功能 黄金/XAU 强度分析 更精确的计算结果 可单独配置的分析周期 可自定义计算限制,以获得更好的性能 为希望查看更多信息的用户提供特殊的多实例设置 无尽的图形设置,可在每个图表中设置您最喜欢的颜色 无数的通知选项,让您再也不会错过任何重要信息 采用 Windows 11 和 macOS 风格的全新圆角设计 神奇的移动指标面板 FX Power 主要功能 所有主要货币的完整强势历史 所有时间框架内的货币强弱历史 所有经纪商和图表的计算结果完全相同 100% 可靠的实时计算 -> 无重绘 可通过下拉列表选择分析时段 通过自定义模式单独配置分析时段 可在一个图表中使用多个实例 可移动 FX Power 显示屏(通过拖放) 适用于高分辨率 QHD、UHD 和 4K 显示器 自动终端配置 针对平板电脑
Trend Screener Pro MT5
STE S.S.COMPANY
4.87 (63)
使用趋势筛选指标释放趋势交易的力量:由模糊逻辑和多货币系统提供支持的终极趋势交易解决方案! 使用趋势筛选器(由模糊逻辑提供支持的革命性趋势指标)提升您的趋势交易。 它是一个强大的趋势跟踪指标,结合了超过 13 种高级工具和功能以及 3 种交易策略,使其成为使您的 Metatrader 成为趋势分析器的多功能选择。 限时优惠:趋势筛选指标终身仅需 50 美元。 ( 原价 250$ ) (优惠延长) 体验趋势筛选器 100% 无需重新绘制的准确性,确保您的交易决策不受过去价格变化的影响。 释放多时间框架和多货币功能的多功能性,使您能够以无与伦比的信心在外汇、商品、加密货币和指数领域进行交易。 利用 Trend Screener 的综合策略套件增强您的交易: - 趋势跟踪策略和趋势延续策略 :趋势筛选器的趋势跟踪策略提供清晰的趋势延续信号,让您有效捕捉趋势走势并管理风险。 - 反转策略和早期入场点策略 :趋势筛选器的反转策略可检测市场方向的潜在变化,使您能够预测趋势反转并利用疲弱的市场趋势。通过早期入场点,您可以在潜在的趋势变化之前定位自己 获取可观的利润。 - 倒卖策略: 趋势筛选器的倒卖
首先,值得强调的是,这个交易工具是非重绘、非重画和非滞后的指标,非常适合专业交易。 在线课程,用户手册和演示。 智能价格行动概念指标是一个非常强大的工具,既适用于新手,也适用于经验丰富的交易者。它将超过20个有用的指标合并到一个指标中,结合了高级交易思想,如内圈交易员分析和智能资金概念交易策略。该指标侧重于智能资金概念,提供有关大型机构交易方式的见解,帮助预测它们的动向。 它在流动性分析方面尤其擅长,有助于理解机构的交易方式。它擅长预测市场趋势,并仔细分析价格波动。通过将您的交易与机构策略对齐,您可以更准确地预测市场走向。该指标多才多艺,擅长分析市场结构,识别重要的订单区块,并识别各种模式。 它擅长识别BOS和CHoCH等模式,理解动量的转变,并突出显示供需强劲的关键区域。它还擅长发现强大的不平衡,并分析价格创造更高高点或更低低点的模式。如果您使用斐波那契回撤工具,该指标可以满足您的需求。它还可以识别相等的高点和低点,分析不同的时间框架,并通过仪表板显示数据。 对于使用更高级策略的交易者,该指标提供了工具,如公平价值差指标和优惠和折扣区域的识别。它特别关注高时间框架订单
AT Forex Indicator MT5
Marzena Maria Szmit
5 (4)
The AT Forex Indicator MT5 is a sophisticated trading tool designed to provide traders with a comprehensive analysis of multiple currency pairs. This powerful indicator simplifies the complex nature of the forex market, making it accessible for both novice and experienced traders. AT Forex Indicator uses advanced algorithms to detect trends, patterns and is an essential tool for traders aiming to enhance their forex trading performance. With its robust features, ease of use, and reliable signal
TrendMaestro5
Stefano Frisetti
note: this indicator is for METATRADER4, if you want the version for METATRADER5 this is the link:  https://www.mql5.com/it/market/product/108106 TRENDMAESTRO ver 2.4 TRENDMAESTRO recognizes a new TREND in the bud, he never makes mistakes. The certainty of identifying a new TREND is priceless. DESCRIPTION TRENDMAESTRO identifies a new TREND in the bud, this indicator examines the volatility, volumes and momentum to identify the moment in which there is an explosion of one or more of these data a
TPA True Price Action indicator reveals the true price action of the market makers through 100% non-repainting signals strictly at the close of a candle! TPA shows entries and re-entries, every time the bulls are definitely stronger than the bears and vice versa. Not to confuse with red/green candles. The shift of power gets confirmed at the earliest stage and is ONE exit strategy of several. There are available now two free parts of the TPA User Guide for our customers. The first "The Basics"
FxaccurateLS
Shiv Raj Kumawat
WHY IS OUR FXACCCURATE LS MT5 THE PROFITABLE ? PROTECT YOUR CAPITAL WITH RISK MANAGEMENT Gives entry, stop and target levels from time to time. It finds Trading opportunities by analyzing what the price is doing during established trends. POWERFUL INDICATOR FOR A RELIABLE STRATEGIES We have made these indicators with a lot of years of hard work. It is made at a very advanced level. Established trends provide dozens of trading opportunities, but most trend indicators completely ignore them!
Auto Order Block with break of structure based on ICT and Smart Money Concepts (SMC) Futures Break of Structure ( BoS )             Order block ( OB )            Higher time frame Order block / Point of Interest ( POI )    shown on current chart           Fair value Gap ( FVG ) / Imbalance   -  MTF      ( Multi Time Frame )    HH/LL/HL/LH  -  MTF      ( Multi Time Frame )  Choch  MTF      ( Multi Time Frame )  Volume Imbalance     ,  MTF          vIMB Gap’s Power of 3 Equal High
Advanced Supply Demand MT5
Bernhard Schweigert
4.5 (14)
任何新手或专业交易者的最佳解决方案! 该指标是一款独特、高质量、且价格合理的交易工具,因为我们已经整合了许多专有功能和新公式。 依据此更新,您将能够显示双重时间帧区域。 您不仅可以显示一个较高的时间帧,还可以同时显示图表时间帧,加上更高的时间帧:显示嵌套时区。 供需双方所有交易者都会喜欢它。 :) 重要信息披露 高级供需的最大潜力,请访问 https://www.mql5.com/zh/blogs/post/720245   想象您的交易如何得以改善,是因为您能够精准定位入场或目标位吗? 构建于新的底层算法,它可以更轻松地识别出买卖双方之间的潜在失衡。 这是因为它以图形方式展示供需最强劲区域,及其过去的表现(显示旧区域)。 这些功能旨在帮助您更轻松地发现最佳入场区域和价位。 现在您可以针对您的交易品种和时间帧来优化和编辑区域强度! 高级供需指标适用于所有产品和时间帧。 它是一个新的公式,非常新的功能是两个区域强度函数可由用户输入进行调整! 这在交易中是一大优势。 当您学习如何使用专有功能,例如带有价格游离最小 X 因子的区域强度时,您能够判断该区域强劲与否。 供需区域用作警报触发器
ICT, SMC, SMART MONEY CONCEPTS, SMART MONEY, Smart Money Concept, Support and Resistance, Trend Analysis, Price Action, Market Structure, Order Blocks, BOS/CHoCH,   Breaker Blocks ,  Momentum Shift,   Supply&Demand Zone/Order Blocks , Strong Imbalance,   HH/LL/HL/LH,    Fair Value Gap, FVG,  Premium  &   Discount   Zones, Fibonacci Retracement, OTE, Buy Side Liquidity, Sell Side Liquidity, BSL/SSL Taken, Equal Highs & Lows, MTF Dashboard, Multiple Time Frame, BigBar, HTF OB, HTF Market Structure
ICT,SMC,智能货币概念,支撑和阻力,趋势分析,价格行为,市场结构,订单区块,突破区块,动量转变,强大的不平衡,HH/LL/HL/LH,公允价值差距,FVG,溢价和折扣区域,斐波那契回撤,OTE,买方流动性,卖方流动性,流动性空白,市场交易时间段,NDOG,NWOG,银弹,ICT模板。 在金融市场中,准确的市场分析对于投资者来说至关重要。为了帮助投资者更好地理解市场趋势和流动性,我们提供了一份使用教程,旨在实现高级市场分析功能。以下是一些功能的简要介绍和实现方法: 1. 显示高时间框架市场结构:    通过设置参数,您可以在图表上显示高时间框架市场结构。这将帮助您更好地理解市场的整体走势和结构。您可以根据自己的需求设置时间周期,并在图表上显示市场结构。 2. 显示流动性:    流动性是市场的重要指标之一。通过设置参数,您可以在图表上显示买方和卖方的流动性。您可以自定义文本和颜色,以便更好地识别不同的流动性水平。您还可以选择显示伦敦AM会话和纽约午餐时间的流动性。 3. 显示公平价值差距:    公平价值差距是指市场价格与公平价值之间的差异。通过设置参数,您可以在图表上显示公平价
Entry Points Pro for MT5
Yury Orlov
4.46 (124)
这款指标用于 MT5,可提供准确的入场交易信号,且无重绘。 它可应用在任何金融资产:外汇、加密货币、贵金属、股票、指数。 它将提供极其精准的评估,并告诉您何时开仓和平仓的最佳时机。 观看 视频 (6:22),其中包含一个仅处理单一信号的示例,该信号即可值回指标购价! 大多数交易者在 Entry Points Pro 指标的帮助下,在第一个交易周内即改善了他们的交易结果。 订阅我们的 Telegram 群 ! Entry Points Pro 指标的益处。 入场信号无重绘 如果信号出现,并得到确认,则它不会再消失;不像是重绘指标,它会导致重大的财产损失,因为它们可以在显示信号后再将其删除。 无差错开仓 指标算法可令您找到入场交易(买入或卖出资产)的理想时机,从而提高每位交易者的成功率。 Entry Points Pro 可操作任何资产 它允许您在 MT5 平台上交易任何经纪商的加密货币、股票、贵金属、指数、大宗商品和货币。 提供任何方向的信号 Entry Points Pro 指标提供针对任意价格走势的入场交易信号 - 上涨、下跌或横盘(横向)。
Matrix Arrow Indicator MT5
Juvenille Emperor Limited
5 (12)
矩阵箭头指标 MT5   是一种独特的 10 合 1 趋势,遵循   100% 非重绘多时间框架指标 ,可用于所有符号/工具: 外汇 、 商品 、 加密货币 、 指数 、 股票 。 Matrix Arrow Indicator MT5 将在其早期阶段确定当前趋势,从多达 10 个标准指标中收集信息和数据,它们是: 平均定向运动指数 (ADX) 商品渠道指数 (CCI) 经典 Heiken Ashi 蜡烛 移动平均线 移动平均收敛散度 (MACD) 相对活力指数 (RVI) 相对强弱指数 (RSI) 抛物线SAR 随机振荡器 威廉姆斯的百分比范围 当所有指标给出有效的买入或卖出信号时,相应的箭头将打印在图表上,在下一根蜡烛/柱线开盘时,指示强劲的上升趋势/下降趋势。用户可以选择使用哪些指标,并可以单独调整每个指标的参数。 Matrix Arrow Indicator MT5 仅从选定的指标中收集信息,并仅根据其数据打印箭头。   Matrix Arrow Indicator MT5   还可以为所有新信号发送终端、推送通知或电子邮件警报。无论您是黄牛、日内交易者还是波段交易者, Mat
IX Power MT5
Daniel Stein
4.17 (6)
IX Power 终于将 FX Power 的无与伦比的精确性带到了非外汇交易符号中。 它能准确判断您喜爱的指数、股票、商品、ETF 甚至加密货币的短期、中期和长期趋势强度。 您可以 分析 终端提供的 一切 。试试吧,体验一下您在交易时如何把握 时机 。 IX Power 主要功能 100% 精确的非重绘计算结果 - 适用于您终端中的所有交易符号 下拉式选择预配置以及可单独配置的强度分析周期 通过电子邮件、消息和手机通知的无数种通知选项 可访问的 EA 请求缓冲区 可自定义计算限制,以获得更好的性能 为希望查看更多信息的用户提供特殊的多实例设置 无尽的图形设置,让您在每个图表中都能找到最喜欢的颜色 采用 Windows 11 和 macOS 风格的圆角新面板设计 神奇的移动指标面板,可在子窗口和主图表之间无缝移动 适用于高分辨率 QHD、UHD 和 4K 显示器,并针对平板电脑和触摸屏进行了优化 IX Power 参数 最重要的参数不言自明,但我们很快会在另一篇文章中为您提供所有 IX Power 参数的完整说明。 使用别名 "参数可为技术交易符号
Blahtech Supply Demand MT5
Blahtech Limited
4.54 (13)
Was: $299  Now: $99   Supply Demand uses previous price action to identify potential imbalances between buyers and sellers. The key is to identify the better odds zones, not just the untouched ones. Blahtech Supply Demand indicator delivers functionality previously unavailable on any trading platform. This 4-in-1 indicator not only highlights the higher probability zones using a multi-criteria strength engine, but also combines it with multi-timeframe trend analysis, previously confirmed swings
The 1 2 3 Pattern Scanner MT5
Reza Aghajanpour
5 (18)
** All Symbols x All Timeframes scan just by pressing scanner button ** *** Contact me  to send you instruction and add you in "123 scanner group" for sharing or seeing experiences with other users. After 17 years of experience in the markets and programming, Winner indicator is ready. I would like to share with you! Introduction The 123 Pattern Scanner indicator with a special enhanced algorithm is a very repetitive common pattern finder with a high success rate . Interestingly, this Winner in
Stratos Pali mt5
Michela Russo
5 (1)
Stratos Pali Indicator is a revolutionary tool designed to enhance your trading strategy by accurately identifying market trends. This sophisticated indicator uses a unique algorithm to generate a complete histogram, which records when the trend is Long or Short. When a trend reversal occurs, an arrow appears, indicating the new direction of the trend. Important Information Revealed Leave a review and contact me via mql5 message to receive My Top 5 set files for Stratos Pali at no cost ! Do
PZ Swing Trading MT5
PZ TRADING SLU
5 (4)
Swing Trading 是第一个旨在检测趋势方向的波动和可能的反转波动的指标。它使用在交易文献中广泛描述的基准摆动交易方法。该指标研究多个价格和时间向量,以追踪总体趋势方向,并检测市场超卖或超买并准备好进行修正的情况。 [ 安装指南 | 更新指南 | 故障排除 | 常见问题 | 所有产品 ] 市场波动的利润不会被窃取 指示器始终显示趋势方向 彩色价格带代表机会基准 彩色虚线表示可能的反转波动 该指标分析其自身的质量和性能 它实现了一个多时间仪表板 可定制的趋势和波动周期 它实现了电子邮件/声音/推送警报 指示器为非重涂或重涂 什么是摇摆交易 摇摆交易是一种尝试在一天到一周内从证券中获得收益的交易方式,尽管某些交易最终可以保持更长的寿命。摇摆交易者使用技术分析来买入弱点和卖出力量,并有耐心等待这些机会的发生,因为在发生一波抛售浪潮之后购买证券而不是陷入抛售更有意义。 机会基准 关于历史数据的大量研究证明,适合于波动交易的市场倾向于在基线价格带上下交易,基线价格带由图表显示,使用平均真实区间计算得出。波动交易者使用基线,该策略是购买常态和卖出躁狂,或做空常态并掩盖沮丧。
FX Volume MT5
Daniel Stein
4.93 (14)
通过 mql5 和 Telegram 上 的 " 晨间简报 "获取每日市场更新,包括详细信息和屏幕截图 ! 外汇交易量(FX Volume)是第一个也是唯一一个从经纪商角度真正洞察市场情绪的交易量指标。 直接在您的图表上看到这些信息是真正改变游戏规则和突破性的交易解决方案。 受益于独特的市场数据洞察,如 比率(Ratios )显示货币多头和空头头寸的比率(百分比 比率变化 显示所选时间段内的多头比率及其百分比变化 总交易量 显示货币的总交易量(多头和空头),以手为单位 多头 交易量显示货币所有多头头寸的交易量 空头 交易量显示所有货币空头头寸的交易量 净多头 显示净多头交易量,即所有多头头寸减去所有空头头寸(以手为单位)。 净多头百分比 显示货币净多头交易量的变化 请阅读我们的基本教程 -> "如何使用外汇交易量进行交易 " 获取更多信息,如常见问题、交易技巧和教程视频,请访问我们的 外汇交易量公共信息频道 请 安装并运行 SI Connect 以建立与我们数据中心的持续连接 背景信息 我们都知道,外汇是一个分散的市场。这就是为什么我们必须打破常规思维,开发一个独
可以说,这是您可以为MetaTrader平台找到的最完整的谐波价格形成自动识别指标。它检测19种不同的模式,像您一样认真对待斐波那契投影,显示潜在的反转区域(PRZ),并找到合适的止损和获利水平。 [ 安装指南 | 更新指南 | 故障排除 | 常见问题 | 所有产品 ] 它检测19种不同的谐波价格形态 它绘制了主要,衍生和互补的斐波那契投影(PRZ) 它评估过去的价格走势并显示每个过去的形态 该指标分析其自身的质量和性能 它显示合适的止损和获利水平 它使用突破来表明合适的交易 它在图表上绘制所有样式比率 它实现了电子邮件/声音/视觉警报 受斯科特·M·卡尼(Scott M. Carney)的书的启发,该指标旨在满足最纯粹和最熟练的交易者的需求。但是,它采取了一种使交易更容易的方式:在向交易发出信号之前,它会等待Donchian朝正确方向突破,从而使交易信号非常可靠。 斐波那契投影与向量无关 它实现了电子邮件/声音/推送警报 它绘制了ABCD投影 重要提示: 为了符合 Scott M. Carney先生 的商标申诉,某些图案名称已重命名为不言自明的替代方式, Scot
XQ Indicator MetaTrader 5
Marzena Maria Szmit
3 (2)
Step into the realm of Forex trading with confidence and precision using XQ, a cutting-edge Forex indicator designed to elevate your trading game to unprecedented heights. Whether you're a seasoned trader or just stepping into the world of currency exchange, XQ Forex Indicator empowers you with the insights and signals needed to make informed trading decisions. The signal conditions are a combination of three indicators, and XQ Forex Indicator only display  medium and long-term trends . The ind
Golden Spikes Premium
Kwaku Bondzie Ghartey
5 (1)
Golden Spikes Detector Acknowledgement and Dedications:  The name of this indicator was Inspired by an Original; Mr Grant Koopman; a Knowledgeable and experienced Synthetics trader. I dedicate this indicator to Mr Grant.  Overview: The Golden Spikes Premium is a groundbreaking trading indicator meticulously crafted for the Boom and Crash indices on the Deriv market. Tailored to meet the needs of discerning traders, this powerful tool operates exclusively on the one-minute timeframe, providin
作者的更多信息
Color Bollinger Bands
Jinsong Zhang
5 (2)
。。。。。。。。。。。。。。。。。。。。。。。。。。。。。。。。。。。。。。。。。。。 This indicator is based on Bollinger Bands indicator. It helps user clearly know the Band is expand or contract. The method of use is the same as the traditional Brin channel index. Users can use different color areas to distribute forest channel indicators in expansion or contraction stage. -------------------------------------------------------------------------------------------
FREE
Reverse TradeCopier for Followers   can copy trades from an account that is running Reverse TradeCopier Source . Features: Copies trades from one source (master) account to multiple following (slave) accounts. Allows investor (read only) password for source (master) account. There are no complicated settings and input parameters, everything is easy. Works with different brokers. Works with different quotes symbols (EURUSD_FX, eurusd_m, etc.). Can copy orders from 4-digit quotes platform to 5-dig
Reverse TradeCopier for Followers can copy trades from an account that is running   Reverse TradeCopier for Source . Features: Copies trades from one source (master) account to multiple following (slave) accounts. Allow investor (read only) password for source (master) account. There are no complicated settings and input parameters, everything is easy. Works with different brokers. Works with different quotes symbols (EURUSD_FX, eurusd_m, etc.). Can copy orders from 4-digit quotes platform to 5-
FREE
If you want something as below: Sell FOREX trading signal. Manage multiple accounts. Follow the trading from somebody. "TradeCopier_follow" and   "TradeCopier_source"   can help you! Features: Copying from one source (master) account to multiple follower (slave) accounts. Allow investor (read only) password for the source (master) account. There are no complicated settings and input parameters, everything is easy. Works with different Brokers. Works with different symbols (EURUSD_FX, eurusd_m, e
FREE
本产品可以方便用户比较不同图表的K线,还可以方便地查看同一商品在不同时间周期中的K线形态。 将脚本附加到一个图表上,移动K线,或者改变显示比例,所有打开的图表上的K线将与当前的图表上的K线按照时间对齐,并且同步移动。 如果不同图表上的K线的周期不同,将会根据K线的起始时间进行对齐。 使用前请确保相关的历史数据已经下载到本地。 欢迎提出宝贵建议或意见,请与我联系。 。。。。。。。。。。。。。。。。。。。。。。。。。。。。。。。。。。。。。。。。。。。。。。。。。。。。。。。。。。。。。。。。。。。。。。 。。。。。。。。。。。。。。。。。。。。。。。。。。。。。。。。。。。。。。。。。。。。。。。。。。。。。。。。。。。
。。。。。。。。。。。。。。。。。。。。。。。。。。。。。。。。。。。。。。。。。。。。。。。。。。。。。 本产品用于检测外汇行情历史数据。 质量好的历史数据对于交易者作行情分析或回测非常重要。但是各家外汇券商提供的历史数据的质量参差不齐,有时我们会留意到K线序列有缺失,但有时不易察觉。本产品帮助用户定位这些缺失位置。如果某图表上某个时段出现许多缺口,你就要小心历史数据是否可靠,也许要考虑换一个更好的行情服务器。 这个产品用编号标记K线上出现的缺口,并计算出缺口大小,以及其他相关参数。 。。。。。。。。。。。。。。。。。。。。。。。。。。。。。。。。。。。。。。。。。。。。。。。。。。。。。。。。。。。。。。。。
有的交易策略适合波动较小的、安静的行情,而有的策略适合波动较大、剧烈的行情。不管是哪种策略,交易者都应当对行情的冷热程度有清晰的量化标准。 本产品方便交易者对比不同交易品种的冷热程度,或者同一交易品种在不同时间段的交易热度。 你可以将它放在不同图表上,获得直观的感受。哪个品种热度更高,哪个交易更淡静,一目了然。 下方的颜色指示器显示瞬时的价格跳动情况,而左上角的数字显示的是一段时间内的温度累积均值。 。。。。。。。。。。。。。。。。。。。。。。。。。。。。。。。。。。。。。。。。。。。。。。。。。。。。。。 。。。。。。。。。。。。。。。。。。。。。。。。。。。。。。。。。。。。。。。。。。。。。。。。。。。
该指标用于指示K线的最高价与最低价之差,以及收盘价与开盘价之差的数值,这样交易者能直观地看到K线的长度。 上方的数字是High-Low的差值,下方数字是Close-Open的差值。 该指标提供过滤功能,用户可以只选出符合条件的K线,例如阳线或者阴线。 ---------------------------------------------------------------- 该指标用于指示K线的最高价与最低价之差,以及收盘价与开盘价之差的数值,这样交易者能直观地看到K线的长度。 上方的数字是High-Low的差值,下方数字是Close-Open的差值。 该指标提供过滤功能,用户可以只选出符合条件的K线,例如阳线或者阴线。 ----------------------------------------------------------------
有些交易者不喜欢让他们头寸中的止盈/止损价格暴露出来,这个EA可以帮助他们。 把EA拖放在图表上,并设定止盈/止损点(0意味着忽略),如果图表上的商品有头寸,它会在图表上监察商品的价格,如果价格达到用户设定的止盈/止损水平,就关闭这个头寸。 这个工具可以有效隐藏用户的止盈/止损价格。止盈/止损价格由开仓价格与用户设定的止盈/止损点子所决定。 欢迎提出宝贵建议和意见。 。。。。。。。。。。。。。。。。。。。。。。。。。。。。。。。。。。。。。。。。。。。。。。。。。。。。。。。。。。。。。。。。。。。。。。。。。。 。。。。。。。。。。。。。。。。。。。。。。。。。。。。。。。。。。。。。。。。。。。。。。。。。
This script allows traders to easily close positions if their profit/loss reaches or exceeds a value specified in pips. The script allows users to easily close positions if their profit/loss reaches or exceeds a value specified in pips. Please set slippage value first. Sometimes some positions do not close due to high volatility of the market. Please set larger slippage or restart the script. ..............................................................................................
Script to Delete Pending Orders Sometimes you placed many Pending Orders and then you want delete certain kind of these orders, this script can help you! Usage: Download and drag and drop this script to the chart. Check "Allow AutoTrading" in "Common" tab and set input parameters in "Inputs" tab. Input Parameters: TypeOfPending: which type Order you would delete. mySymbol: which Symbol you would delete. The input format of the Symbol is such as "EURUSD" or "eurusd".
The script allows to easily watch the date and time of several cities selected by the user from more than 30 important cities all over the world. It also shows GMT, Server time and Local time. The cities on the screen are automatically sorted by the date and time. You can save your setting on the Inputs tab and use them in future. Notice: Daylight saving time is not considered.
有的交易策略适合波动较小的、安静的行情,而有的策略适合波动较大、剧烈的行情。不管是哪种策略,交易者都应当对行情的冷热程度有清晰的量化标准。 本产品方便交易者对比不同交易品种的冷热程度,或者同一交易品种在不同时间段的交易热度。 你可以将它放在不同图表上,获得直观的感受。哪个品种热度更高,哪个交易更淡静,一目了然。 下方的颜色指示器显示瞬时的价格跳动情况,而左上角的数字显示的是一段时间内的温度累积均值。 。。。。。。。。。。。。。。。。。。。。。。。。。。。。。。。。。。。。。。。。。。。。。。。。。。。 .......................................................................................................
Painting Deals
Jinsong Zhang
4.67 (3)
Painting Deals on active chart. It allows analyzing trade history on an account to which you have an investor (read only) password. Type of the arrow displayed indicated the deal type: Right Arrow means In and In/Out deals Arrow Left Left means Out deals. Blue arrows are for Buy deals and Red arrows are for Sell deals. The indicator displays deals in the real time mode, it also displays their Stop Loss and Take Profit levels. Put the mouse over the arrows to see the details of deals including op
The script shows statistics of trades for the specified period. For example, if you want to know the details of trades of the ATC2010 Winner ( bobsley ): Login with his account using the investor (read-only) password (MetaTrader5); Open the chart of his trading symbol (EURUSD); Run this script on the chart; Specify 2010.10.1 in "date from", and the diagram will be shown.
本产品可以方便用户比较不同图表的K线,还可以方便地查看同一商品在不同时间周期中的K线形态。 将脚本附加到一个图表上,移动K线,或者改变显示比例,所有打开的图表上的K线将与当前的图表上的K线按照时间对齐,并且同步移动。 如果不同图表上的K线的周期不同,将会根据K线的起始时间进行对齐。                       使用前请确保相关的历史数据已经下载到本地。 欢迎提出宝贵建议或意见,请与我联系。                                —————————————————————————————————————————————————————————————————————————————————————— 。。。。。。。。。。。。。。。。。。。。。。。。。。。。。。。。。。。。。。。。。。。。。。。。。。。。。。。。。。。。。。
该工具帮助用户轻松地一键平仓,当某个持仓头寸的损益达到或者超过用户设定的点子时。 使用时请先设置滑移值。 有时,由于市场的高度波动,一些头寸不能及时关闭,这时 请设置较大的滑移值,或重新按动平仓按键。 ...................................................................................................................................................... ===================================================================================================
This script notifies a user about different events by playing sounds, sending emails and text messages to a mobile device. The following events are supported: New deals (in/in out/out). Expiration of Pending orders. The terminal disconnected. The terminal or the script closed. Please set a notification type for each event separately. If you need notifications via Email, please make sure that the settings on the Email tab are correct. If you need to receive notifications on a mobile device, pleas
This script alerts a user via sounds and alert box at the end of a countdown. It is like an alarm clock. There are 2 ways to start counting down: Set a value of remaining minutes. Example: if you need an alert after 1 hour, set it to 60. Set countdown end time. If you like to use a custom sound for the alert, copy your sound files to "terminal_path\Sounds" folder and set the exact file name in the input parameters. The sound file must be in *.wav format.
本产品用于检测外汇行情历史数据。 质量好的历史数据对于交易者作行情分析或回测非常重要。但是各家外汇券商提供的历史数据的质量参差不齐,有时我们会留意到K线序列有缺失,但有时不易察觉。本产品帮助用户定位这些缺失位置。如果某图表上某个时段出现许多缺口,你就要小心历史数据是否可靠,也许要考虑换一个更好的行情服务器。 这个产品用编号标记K线上出现的缺口,并计算出缺口大小,以及其他相关参数。 。。。。。。。。。。。。。。。。。。。。。。。。。。。。。。。。。。。。。。。。。。。。。。。。。。。。。。。。。。。。。。。。。。。。。 ..................................................................................................
SmartMA
Jinsong Zhang
This is a trend indicator, as you can see here. When the white line is above the red, it means a bull market. Conversely, the white line below the red line is a bear market. This index is suitable for long - term trading and is suitable for most trading varieties. --------------------------------------------------------------------------------------------
This indicator let user clearly see Buy/Sell signals. When a bar is closed and conditions meet, arrow signal will come up at Close Price, up is Buy and down is Sell. It works on all Timeframes. And you can set sound alert when signals come up.
这个指标用于比较图表上的交易品种与其他几个所选交易品种之间的强弱相对关系。 根据每个交易品种基于相同基准日的价格走势进行比较,可以看到几条不同走向的趋势线,反映出几个不同交易品种之间的强弱关系,这样可以更清楚地了解市场的趋势。 例如,你可以在EURUSD图表上应用这个指标,将其与货币对EURJPY和EURGBP进行比较,看看哪个更强。 你需要为指标输入参数: 需要比较的几个交易品种的名称 您需要选择比较基准日期。 请注意,使用指标前应确保相关交易品种的历史数据已经下载。 免费模拟版本是: https://www.mql5.com/zh/market/product/63921 .............................................
.................................. This script is intended to help users to get information about ticks and spreads (e.g. ticks count, minimum/maximum/average spread). It can export reports in the CSV format with this information. Traders can see spread statistics in real time in the chart window It is useful for comparing spreads of different brokers. --------------------------------------------------------------------------
这是一款基于市场深度的可视化指标,它可工作于所有提供市场深度的品种。它显示每笔卖价/出价的交易量与总卖价/出价的交易量的比值,这样用户可以直观地判断买卖方向的瞬时强度。你可以同时在几个图表上应用这个指标,观察不同品种的买卖队列。 购买前请确认你的交易商有提供市场深度这个功能。 。。。。。。。。。。。。。。。。。。。。。。。。。。。。。。。。。。。。。。。。。。。。。。。。。。。。。。。。。。。。。。。。。。。。。。。。 。。。。。。。。。。。。。。。。。。。。。。。。。。。。。。。。。。。。。。。。。。。。。。。。。。。。。。。。。。。。。。。。。。。。。。。。。 。。。。。。。。。。。。。。。。。。。。。。。。。。。。。。。。。。。。。。。。。。。。。。。。。。。
这个指标用于比较图表上的交易品种与其他两个所选交易品种之间的强弱相对关系。 根据每个交易品种基于相同基准日的价格走势进行比较,可以看到三条不同走向的趋势线,反映出三个不同交易品种之间的强弱关系,这样可以更清楚地了解市场的趋势。 例如,你可以在EURUSD图表上应用这个指标,将其与货币对EURJPY和EURGBP进行比较,看看哪个更强。 你需要为指标输入参数: 您可以输入两个交易品种的名称 您需要选择比较基准日期。 请注意,使用指标前应确保相关交易品种的历史数据已经下载。 免费模拟版本是: https://www.mql5.com/zh/market/product/63888 .........................................
Trade Area
Jinsong Zhang
Most time the market is in a small oscillation amplitude. The Trade Area indicator helps users to recognize that time. There are 5 lines in this indicator: Area_high, Area_middle, Area_Low, SL_high and SL_low. Recommendations: When price is between Area_high and Area_Low, it's time to trade. Buy at Area_Low level and sell at Area_high level. The SL_high and SL_low lines are the levels for Stop Loss. Change the Deviations parameter to adjust SL_high and SL_low.
该指标用于指示K线的最高价与最低价之差,以及收盘价与开盘价之差的数值,这样交易者能直观地看到K线的长度。 上方的数字是High-Low的差值,下方数字是Close-Open的差值。 该指标提供过滤功能,用户可以只选出符合条件的K线,例如阳线或者阴线。 ---------------------------------------------------------------- 该指标用于指示K线的最高价与最低价之差,以及收盘价与开盘价之差的数值,这样交易者能直观地看到K线的长度。 上方的数字是High-Low的差值,下方数字是Close-Open的差值。 该指标提供过滤功能,用户可以只选出符合条件的K线,例如阳线或者阴线。
这个脚本允许比较来自不同交易服务器或者不同经纪商的报价和价差,以识别出一个提供最好的买价/卖价和最小价差的服务器/经纪商。 一次可与最多6个不同的服务器或经纪商进行比较,通过分数很容易就能找到最好的报价提供商。 用法:打开最多6个MetaTrader 客户端终端,分别登入不同的服务器/经纪商,然后在每个终端的图表上启动脚本。 。。。。。。。。。。。。。。。。。。。。。。。。。。。。。。。。。。。。。。。。。。。。。。。。。。。。。。。。。 。。。。。。。。。。。。。。。。。。。。。。。。。。。。。。。。。。。。。。。。。。。。。。。。。。。。。。。 。。。。。。。。。。。。。。。。。。。。。。。。。。。。。。。。。。。。。。。。。。。。。。。。。。。
Rocket Projectile
Jinsong Zhang
1 (1)
这是一个多货币配对交易系统。具体原理我就不详细解释了,用户需要关心的是它的实际表现。 强烈建议阁下下载此产品,并对它进行充分的检验,包括以历史数据进行回测、在模拟账户进行实测。 由于此EA交易多个货币对,在首次对其进行历史回测时,将会自动下载相关的历史数据,数据量约为每个月6GB左右,下载时间约一小时(如果电脑配置高,而且网速快,会节省下载时间)。 数据下载完成后,你可以在策略测试器中对其进行充分的测试。测试一个月的历史数据需要大约10分钟。具体测试方法在本网站的文章中有介绍。 由于市场上有很多交易商,同一交易商有多个不同的服务器,各有不同特性,会让本产品的测试结果有较大影响,建议用户多开不同账户对产品进行测试,以获得较佳结果。关于交易商的服务器,用户可以参考我在MQL5社区上的相关博客。 可以确定的是,服务器的延时越少、滑点越小、点差越低、报价越稳定,则本EA盈利机会越多。交易者需要做的是找到这样的服务器。如果你找到了,祝贺你!你可以利用VPS,对产品作进一步的实时测试。 祝好运!
筛选:
无评论
回复评论
版本 1.21 2021.11.20
Recompile as required by MQL5.community