Adamant Levels Logic A
- 指标
- Sattiraju Kottapalli
- 版本: 5.0
- 更新: 4 十一月 2020
- 激活: 5
該指標繪製的水平非常“堅定”且性質強烈。
這些水平在一生中充當強烈的價格拒絕水平,從不重新粉刷。
為了將我所有的邏輯級別整合到您的交易系統中,需要以1個月的訂閱價格訂購6個月的所有邏輯級別。
希望這會有所幫助。
免責聲明:如果您正在尋找一個花哨,色彩鮮豔,引人注目的指示,請遠離。
沒有考慮價格可以保持,反彈或突破的水平,任何交易者都不能成為一個好交易者。
這些水平幫助交易者以更便宜的價格進入市場。它們可以是支撐阻力,需求供給,支點,斐波納契水平等。
經過多年對價格圖表的研究和分析,我發現很少有復雜的算法和邏輯來找出未來可能的價格行為。
在某些價格點上應用這些邏輯和算法,我達到了價格可以反彈或突破的水平。
我將它們命名為“Adamant Levels”。
是的,它們本質上是堅定的和靜態的。
價格被這些水平吸引並擊退。
這些是未來的價格行為水平,交易者可以通過更高的風險回報率進入市場。
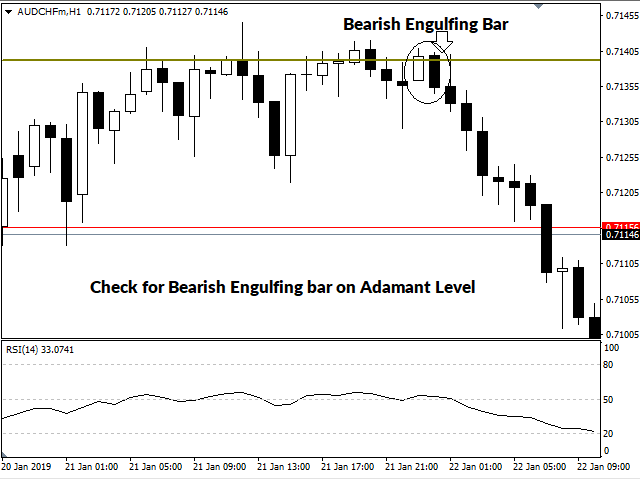
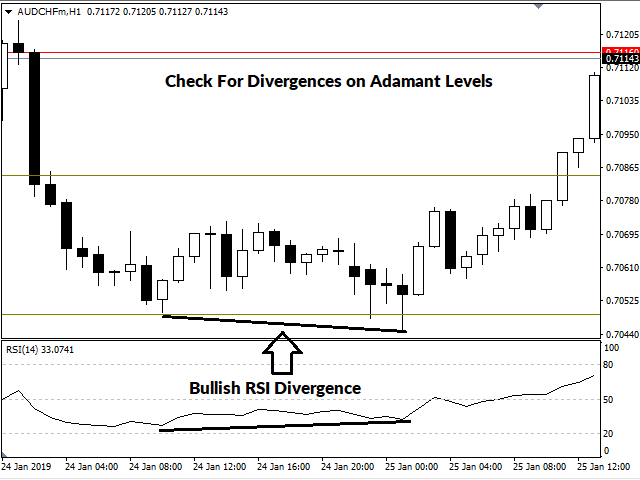
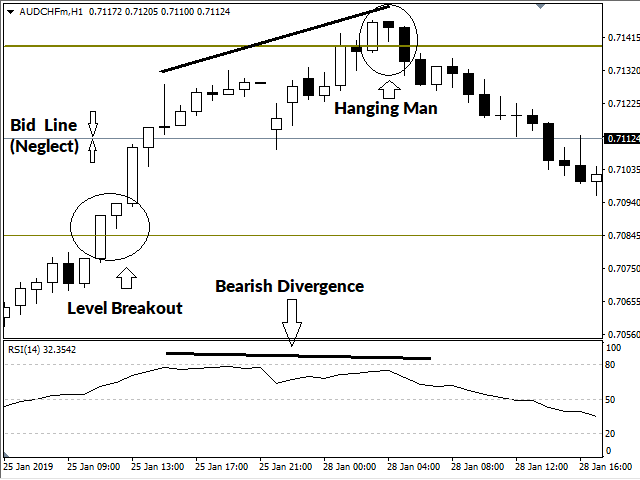
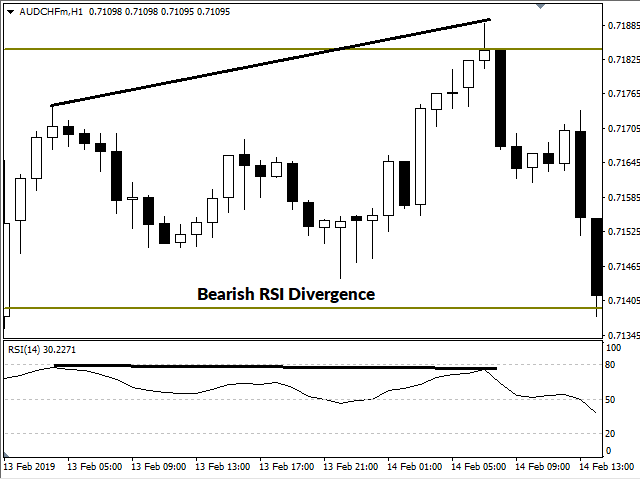
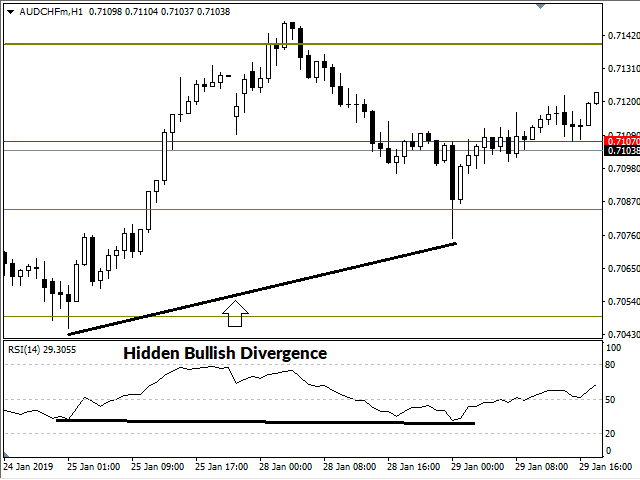
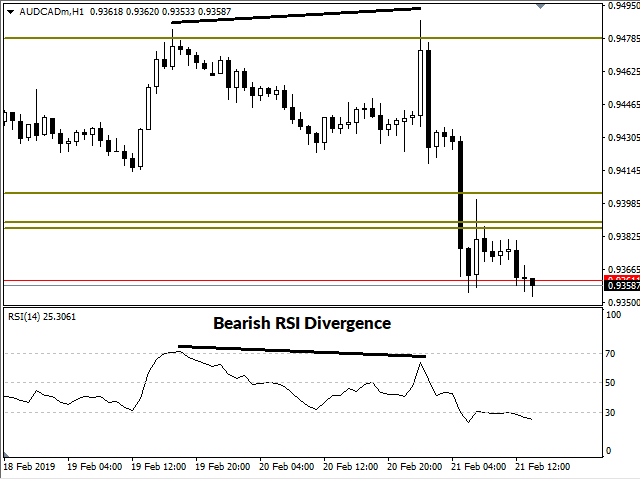
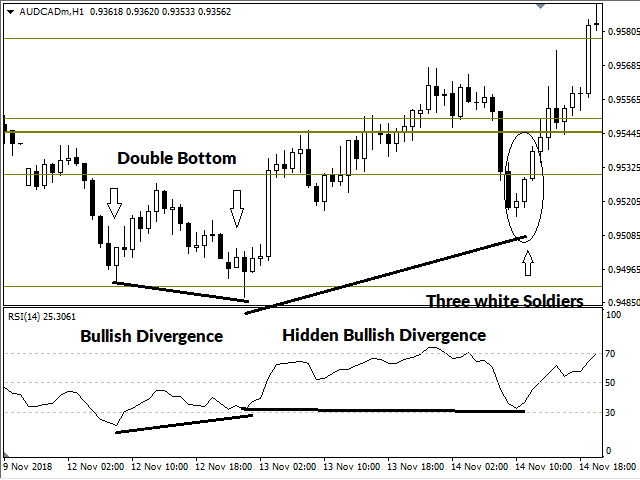
大多數觸發點如價格模式,圖表模式,收斂和分歧,趨勢線故障等都出現在這些“堅定的水平”上。
所以等待在這些級別上發生觸發並進入。
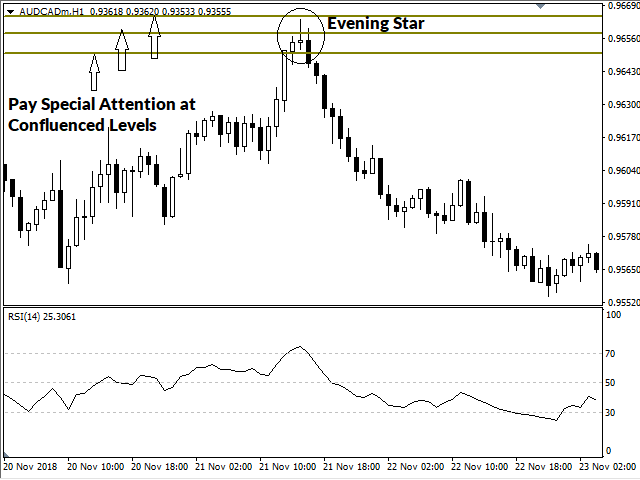
特別注意不同堅定程度的融合
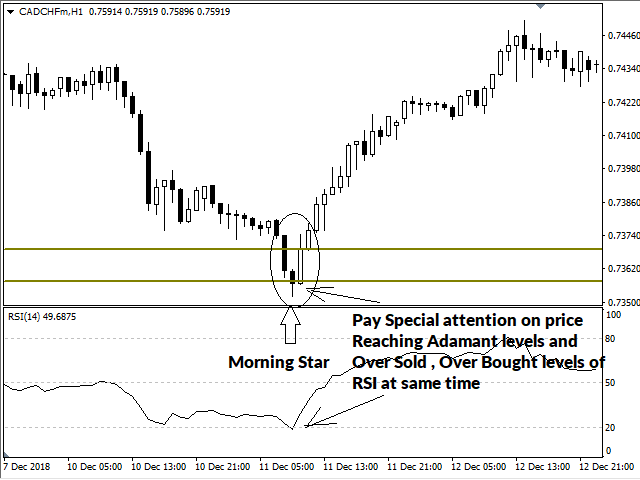
特別注意RSI同時達到Adamant Levels和Over Sold,Over Bought區域的價格,然後是Price Patterns。
這些是您交易的每張圖表必須具有的水平。
該指標是根據我的第一個邏輯設計的,即“邏輯A”。
我個人在實時交易中對AUDCHF對測試了這個指標一個多月,結果非常出色。
基於其他邏輯的指標正在測試中。
大多數畫線都比幾個月到幾年都要早。
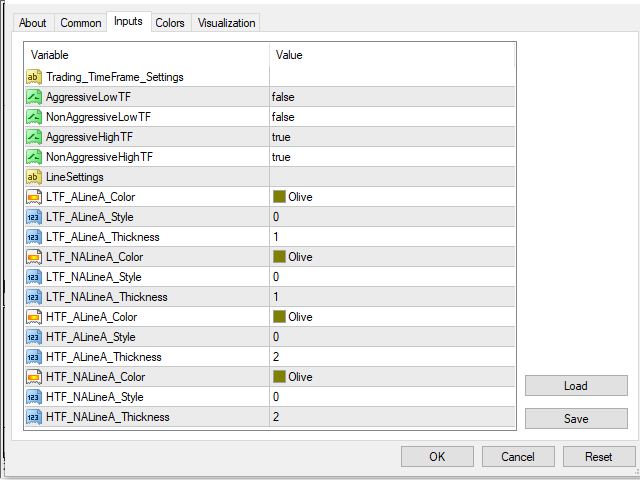
來到輸入參數,
參數易於設置。
記住不同的交易者及其交易風格,輸入參數有四個類別。
始終建議使用高級過濾器級別(默認設置)。 如果交易者想要更積極地使用二級水平。 如果交易者想要進一步激進可以使用正常水平。
但交易者可以自由使用他們想要的任何設置。如果某些貨幣對(符號)的水平不合適,交易者可以通過更改適當的設置來達到準確的水平。
強烈建議使用更高的時間範圍,即至少1Hour。
在大多數對上,默認參數工作正常。
如果您覺得某個符號上繪製的層次過多,請選擇“上一個較低的時間範圍”。
突出的特點
*易於設置。
* 容易明白。
*適用於任何交易系統。
*未來價格行動的永久水平。
* 100%Non Repaint能。
*自當前交易日起過去5天內無法獲得新的水平。
*可以在任何貨幣對,股票和商品交易。
*級別與時間範圍無關。
*適用於所有市場。這就是這個全新的指標“Adamant Levels Logic A”。
所以他們的交易員,熱身你的策略測試員並開始測試。
希望您對此指標的投資可以幫助您實現明亮的交易目標。


Good, very much useful with my trading strategy