• 概述
  • 评论 (2)
  • 评论
  • 新特性

OneKey DeleteOrder

推荐产品
Manual Assistant MT5
Igor Kotlyarov
4.67 (3)
Bonus when buying an indicator or an advisor from my list. Write to me in private messages to receive a bonus. Manual Assistant MT5 is a professional manual trading tool that will make your trading fast and comfortable. It is equipped with all the necessary functions that will allow you to open, maintain and close orders and positions with one click. It has a simple and intuitive interface and is suitable for both professionals and beginners. The panel allows you to place buy and sell orders
FREE
HiperCube Renko Candles
Adrian Lara Carrasco
欢迎使用 HiperCube Renko Candles 此指标为您提供真实的市场信息,将其转换为 Renko Candle Style。 定义 Renko 图表是一种金融图表,用于测量和绘制价格变化,使用砖块(或条形)表示价格变动。与传统烛台图不同,Renko 图表不显示基于时间的信息,仅关注价格波动。 特点: 单独窗口中的指标 自定义蜡烛颜色 自定义蜡烛/砖块大小(以点为单位) Chatgpt 和 AI 被用于开发它 Renko 策略示例: 识别趋势 等待回调和使用 Renko 蜡烛吞没 输入您的入场点 SL 吞没的较低点 TP 风险回报 1:2、1:3... 请注意,这是一个示例,可以作为基础或新策略,无论如何在真实账户中尝试和测试它,这些信息仅供您了解如何使用 Renko Candles Hipercube 指标
FREE
Trendline mt5 indicator
David Muriithi
3 (1)
Are you tired of drawing trendlines every time you're analyzing charts? Or perhaps you would like more consistency in your technical analysis. Then this is for you. This indicator will draw trend lines automatically when dropped on a chart. How it works Works similar to standard deviation channel found on mt4 and mt5. It has 2 parameters: 1. Starting Bar 2. Number of bars for calculation The   starting bar   is the bar which drawing of the trend lines will begin, while the   number of bars for c
FREE
Renko Builder GLX1
Eranga Thilina Dhanushka Gallage
GLX1 Renko Builder   Expert Advisor (EA) can create the Renko bar charts on any symbol. The Renko charts are generated as real-time custom symbol charts which can be further used for technical analysis with any MT5 compatible indicator.  Find the free   GLX1 Renko Euro   Expert Advisor from here.  https://www.mql5.com/en/market/product/115074 Included Features: Truly responsive Renko Charting on a custom symbol chart Accurate automatic live chart update Ability to attach any MT5 indicator
Renko Chart
Marcin Konieczny
3.63 (8)
This indicator allows to display Renko charts in the indicator window. Renko charts show only price movements that are bigger than the specified box size. It helps to eliminate noise and allows to focus on main trends. Time is not a factor here. Only price movements are taken into account. That's why Renko chart is not synchronized with the main chart it is attached to. Indicator works in two modes: CLOSE - only close prices are taken into account while building the chart HIGH_LOW - only high/
FREE
Renko Plus
Eadvisors Software Inc.
With Renko Plus you can use the features in the Indicator functionality, just add it to the Metatrader5 chart.             The Renko chart is a type of chart, developed by the Japanese, that is constructed using price movement rather than standardized prices and time intervals like most charts. It is believed to be named after the Japanese word for bricks, "renga", as the graphic looks like a series of bricks.             A new brick is created when the price moves a specified p
Trend Catcher with Alert MT5
Issam Kassas
4.63 (62)
趋势捕捉器: 具有警示指标的趋势捕捉器策略是一种多功能的技术分析工具,可帮助交易员识别市场趋势和潜在的进出点。它采用动态趋势捕捉器策略,根据市场条件进行调整,清晰地呈现趋势方向。交易员可以自定义参数,以符合其偏好和风险容忍度。该指标有助于识别趋势,发出潜在的反转信号,充当跟踪止损机制,并提供实时警报,以便及时应对市场。 具有警示指标的趋势捕捉器策略是一种多功能的技术分析工具,可帮助交易员识别市场趋势和潜在的进出点。它采用动态趋势捕捉器策略,根据市场条件进行调整,清晰地呈现趋势方向。交易员可以自定义参数,以符合其偏好和风险容忍度。该指标有助于识别趋势,发出潜在的反转信号,充当跟踪止损机制,并提供实时警报,以便及时应对市场。 特点: 趋势识别:信号牛市趋势和熊市趋势。 趋势反转:当蜡烛颜色从牛市变为熊市,反之亦然时,提醒可能的反转。 实时警报:为新趋势识别生成警报。 建议: 货币和货币对:EURUSD,AUDUSD,XAUUSD... 时间框架:H1。 账户类型:任何ECN,低点差账户。
FREE
Order Book, known also as Market Book, market depth, Level 2, - is a dynamically updated table with current volumes of orders to buy and to sell specific financial instument at price levels near Bid and Ask. MetaTrader 5 provides the means for receiving market book from your broker, but in real time only, without access to its history. The indicator OrderBook Cumulative Indicator accumulates market book data online and visualizes them on the chart. In addition, the indicator can show the market
Account Info EA It is a tool that presents on the graph all the positions of the account, and specific information concerning the positions, but also the account. It enables the user to have an image of his account at a glance. Use like any expert advisor. You can't attach it in the same chart with other expert advisor. It does not have the ability to open or manage positions. You can attach it on any chart and any timeframe.
FREE
对于那些使用趋势线、矩形和文本等元素进行技术分析的人来说,VR 颜色级别是一个方便的工具。可以直接向图表添加文本并截取屏幕截图。 设置、设置文件、演示版本、说明、问题解决,可以从以下位置获取 [博客] 您可以在以下位置阅读或撰写评论 [关联] 版本为 [MetaTrader 4] 一键点击 即可使用该指标。为此,请单击带有线条的按钮,之后光标下方将出现一条趋势线。然后,通过移动光标,您可以选择 行位置 并通过再次单击来修复它。 该指标的特点 是,样式和颜色的所有更改都会自动保存,并随后应用于所有 新创建的 图形对象。 该指标配备了两个独立的按钮,用于设置不同样式的趋势线,两个独立的不同样式的矩形,一个具有自己风格的文本字段以及一个用于创建屏幕截图的按钮。 屏幕截图在 MetaTrader 终端目录的 Files 文件夹中创建,保存路径和文件名写入专家日志中。 大致路径:C:\Users\用户名\AppData\Roaming\MetaQuotes\Terminal\Character set\MQL5\Files\VR Color Levels 有大量类似于 VR Color
FREE
Basic Theme Builder MT5
Mehran Sepah Mansoor
5 (1)
基本主题构建器:简化您的图表自定义 通过 基本主题构建器 指标,彻底改变您的交易体验。这款多功能工具旨在简化您在MetaTrader 5 平台上自定义图表外观的过程。该指标提供了一个用户友好的面板,您可以轻松切换不同的主题和配色方案,提升交易环境的视觉吸引力和功能性。 Free MT4 version 基本主题构建器 指标是那些希望轻松个性化MetaTrader 5图表的交易者的终极工具。通过其简单的面板界面和各种主题预设,您可以迅速调整图表的外观,以匹配您的交易风格或心情。无论您偏爱经典外观还是现代美学,基本主题构建器提供了一系列选项,以增强您的视觉体验并提高专注度。立即优化您的交易设置,体验这款实用且易于使用的指标。 主要特点: 轻松管理主题: 使用便捷的面板界面,单击即可快速更改图表主题。 预定义预设: 从几种预配置的主题和配色方案中进行选择,包括经典、深色、浅色等,以适应您的交易偏好。 可自定义选项: 调整颜色和样式,按您的喜好定制图表外观。 用户友好界面: 享受简单直观的设计,无需复杂设置或配置。 提升交易专注度: 通过视觉吸引力强且无干扰的图表环境,改善您的交易体验。
FREE
Gino Renko
Stephane, Andr Valette
1 (1)
Another renko-based indicator. It returns different usable values ​​for an EA, and is directly displayed on the main chart. Its setting is very simple: The size of the renko The number of bars taken into account The falling color The color on the rise Returned values: Buffer 0 : Value of the middle Buffer 1 : Value of the Top Buffer 2 : Value of the Bottom Buffer 3 : Direction of renko (0.0 for top ; 1.0 for bottom) Buffer 4 : Ratio of the renko, for example, if it is twice, 3 times, ro more of
Important Lines
Terence Gronowski
4.85 (20)
This indicator displays Pivot-Lines, preday high and low, preday close and the minimum and maximum of the previous hour. You just have to put this single indicator to the chart to have all these important lines, no need to setup many single indicators. Why certain lines are important Preday high and low : These are watched by traders who trade in a daily chart. Very often, if price climbs over or falls under a preday low/high there is an acceleration in buying/selling. It is a breakout out of
FREE
This indicator will mirror the assets in use in another metatrader, being able to choose the timeframe and a template. This is the Metatrader 5 Client, it needs the Metatrader 4 or 5 Server versions: Metatrader 4 Mirror Chart Server:   https://www.mql5.com/en/market/product/88644 Metatrader 5 Mirror Chart Server: https://www.mql5.com/en/market/product/88652 Details of how it works in the video.
FREE
Highly configurable Adx indicator. Features: Highly customizable alert functions (at levels, crosses, direction changes via email, push, sound, popup) Multi timeframe ability Color customization (at levels, crosses, direction changes) Linear interpolation and histogram mode options Works on strategy tester in multi timeframe mode (at weekend without ticks also) Adjustable Levels Parameters: ADX   Timeframe:  You can set the lower/higher timeframes for Adx. ADX   Bar Shift:   you can set the
FREE
Market Profile 3 ForexArby com
Hussien Abdeltwab Hussien Ryad
3.83 (12)
Market Profile 3 MetaTrader 5 indicator  version 4.70— is a classic Market Profile implementation that can show the price density over time, outlining the most important price levels, value area, and control value of a given trading session. This indicator can be attached to timeframes between M1 and D1 and will show the Market Profile for daily, weekly, monthly, or even intraday sessions. Lower timeframes offer higher precision. Higher timeframes are recommended for better visibility. It is als
FREE
Gm Volumes
Antonio Augusto Barreto De Melo
4 (3)
A simple volume indicator according to the color of the candle! - Custom background! - Supports Volume by Ticks or Real Volume. The original Metatrader Volume indicator does not show the colors of the bar according to the color of the Candle, it only changes color when the volume of a candle is greater than the previous one, this sometimes creates confusion for beginners and does not know the real reason for the color change. Free indicator, support may take a while to respond!
FREE
ChartPan
Leandro Rodrigo Giron
Hey Trader! Boring with the Meta chart? Do you want to move it as you do in Profit? Your problems are over! Now available   Chart Panoramic   or   ChartPan   for closer friends, a utility that allows you to move the chart to better visualize the most relevant points for your trade. Recommend you to add a keyboard shortcut for quick access (Ctrl + Q - for example), because you will need to run   ChartPan   after symbol changing to "release" the chart again. To add a hotkey: after downloa
FREE
Breakevan Utility
Jose Luis Thenier Villa
BreakEvan Utility  Is a simple tool in a panel with this utilities: This utility will draw a Golden Line in the chart applied showing the breakeven price, considering all the positions opened for that specific symbol. Also the information panel shows: Balance Breakeven Price for that chart Force Breakeven (for that symbol) as ON/OFF Force Breakeven Global (takes into account all trades opened) as ON/OFF Total Lots opened for Symbol Total Lots opened Global And two buttons: Force Breakeven: W
Data Extractor (DE) is designed to extract symbol price movement data and save it to file. It's a simple tool, designed to be used in combination with other software. SETTINGS (INPUTS) Period_in_days - How many days of data for Data Extractor to process (including non-work days).  File extension - Defines the type of file in which data will be saved. CSV is readable for a human, HST and BIN are binary data intended for machine reading. File name (without extension) - User defined part of file
FREE
The   Close script   is a simple tool that allows traders to close their trades by three methods. Just run the script and choose the close method. Closing methods Symbol  - Allows closing all open trades for a specific symbol. All_Trades  - Allows closing all open trades. Magic_Number  - Allows closing all open trades according to their magic number. Recommendation AutoTrading functions must be activated.  If the AutoTrading function is disabled, the script will not work. EA should be stopped
FREE
Size Bars
Viktor Loginov
Size Bars – индикатор отображает на графике максимальный, минимальный, текущий и средний размер баров (свечей) за выбранный период. Отображаемые параметры индикатора Size Bars: 1)       Текущий размер бара в писах (по максимум/минимум, тело бара). 2)       Максимальный, минимальный и средний размер свечей BUY . 3)       Максимальный, минимальный, средний размер свечей SELL . 4)       Количество свечей BUY и количество свечей SELL . 5)       Среднее количество свечей подряд BUY и SELL . 6)    
BoletaMiniPanel
PATRICK ANTONIO MORELO A.
5 (3)
Simple panel with  Stop loss (Loss), Stop gain (Gain) , Trailing stop (TS) and Breakeven (BE-P). Lot is the number of contracts to be traded. Gain is the number, in points, that the stop gain will be positioned. If you don't want to put stop gain, just put 0 (zero) in place and when you open the order it won't have this stop. Loss is the number, in points, that the stop loss will be placed. If you don't want to put stop loss, just put 0 (zero) in place and when you open the order it won't
FREE
FX Info Spread MT5
Pedro Fernandez
3 (1)
Minimalist and fully customizable info panel. It works on any chart and timeframe, with 2 - 4 digits brokers and with 3 - 5 digits ones. It can show: Current Spread in pips (1 decimal digit if you are on a 3 - 5 digits broker) ATR (Average True Range) in pips Current Server Time Current GMT Time Important Account Info: Current Leverage and Stop-out Level (%) Time left for the current bar. Very useful on 4 h charts All info labels have a tooltip with the same data Available customizations : En
FREE
The Rayol Code Hour Interval Lines indicator was  designed to assist your trading experience.  It  draws the range of hours chosen by the user directly on the chart, so that it enables traders to visualize price movements during their preferred trading hours, providing  traders a more comprehensive view of price movements and market dynamics. This indicator allows the user to choose not only the Broker's time, but also the Local time. This way, the user no longer needs to calculate local time in
FREE
RenkoChart EA
Paulo Henrique Da Silva
4.33 (3)
The RenkoChart tool presents an innovative and highly flexible approach to visualizing market data in MetaTrader 5. This expert creates a custom symbol with Renko bricks directly on the chart, displaying accurate prices at the respective opening date/time for each brick. This feature makes it possible to apply any indicator to the Renko chart. Furthermore, this tool also allows access to historical brick data through native methods in the MQL5 programming language, such as iOpen, iHigh, iLow and
FREE
Follow The Line MT5
Oliver Gideon Amofa Appiah
4.5 (28)
This indicator obeys the popular maxim that: "THE TREND IS YOUR FRIEND" It paints a GREEN line for BUY and also paints a RED line for SELL. (you can change the colors). It gives alarms and alerts of all kinds. IT DOES NOT REPAINT and can be used for all currency pairs and timeframes. Yes, as easy and simple as that. Even a newbie can use it to make great and reliable trades. NB: For best results, get my other premium indicators for more powerful and reliable signals. Get them here: https://www.m
FREE
LT Rainbow Trend
Thiago Duarte
5 (1)
Do you, like me, like to trade with the trend? Then this indicator will help you! Rainbow Trend is a trend indicator, which uses several Moving Averages on the chart. It measures different trend strenght zones for different periods: very long term, long term, mid term, short term and very short term. Each zone has its color, and it is possible to have sound alert when the prices leaves a zone and enters another. Its configuration is very simple. If you find any bug or have any suggestions, co
GoldTrader
Yashar Seyyedin
Please backtest with the exact balance of your live account before applying to real money. ==> If account balance is too low it may not trade at all! For MT4 version please contact via private message. martingale version is available here . Strategy description - Detect trend based on EMA18-EMA50-SMA200 alignment in three time frames: M15, H1, H4 - Trade in trend direction and exit when above alignment is broken. - The bot is tuned to trade XAUUSD(Gold). - The bot output is break even in rangi
FREE
该产品的买家也购买
Trade Assistant MT5
Evgeniy Kravchenko
4.38 (164)
它有助于计算每笔交易的风险,容易安装新的订单,具有部分关闭功能的订单管理, 7 种类型的追踪止损和其他有用的功能。   注意,该应用程序在策略测试器中不起作用。 您可以在描述页面下载演示版  Manual, Description, Download demo 线条功能  - 在图表上显示开仓线、止损线、止盈线。 有了这个功能,就可以很容易地设置一个新的订单,并在开仓前看到它的附加特性。   风险管理  - 风险计算功能在考虑到设定的风险和止损单的大小的情况下,计算新订单的成交量。它允许你设置任何大小的止损,同时观察设定的风险。 批量计算按钮 - 启用 / 禁用风险计算。 在 " 风险 " 一栏中设置必要的风险值,从 0 到 100 的百分比或存款的货币。 在 " 设置 " 选项卡上选择风险计算的变量: $ 货币, % 余额, % 资产, % 自由保证金, % 自定义, %AB 前一天, %AB 前一周, %AB 前一个月。   R/TP 和 R/SL - 设置止盈和止损的关系。 这允许你设置相对于损失的利润大小。 例如, 1 : 1 - 这决定了 TP = SL 的大小。 2 :
您认为在价格可以瞬间变化的市场中,下单应该尽可能简单吗? 在 Metatrader 中,每次您要开单时,您都必须打开一个窗口,您可以在其中输入开盘价、止损和止盈以及交易规模。 在金融市场交易中,资本管理对于维持您的初始存款并使其倍增至关重要。 因此,当您想下订单时,您可能想知道应该开多大的交易? 在这单笔交易中,您应该承担多少百分比的存款? 您可以从这笔交易中获利多少,利润风险比是多少? 在您设置交易规模之前,您需要进行必要的计算,以获得交易规模应该是多少的问题的答案。 想象一下,您有一个工具可以自动完成所有这些工作。 您打开图表,进行市场分析并用水平线标记入场点、防御点(止损)和目标(止盈),最后您定义风险水平,例如 作为可用资本的百分比,您可以在此交易中承担,此时程序提供: 定义风险和止损规模的可接受交易规模 以点数、点数和账户货币计的止损和获利值 风险回报率 现在剩下的就是点击面板上的相应按钮来打开交易。 如果您是黄牛,需要在不设置防御或目标的情况下快速打开和关闭交易,那么您可以在交易管理器面板中轻松掌握一切,您可以在其中定义固定订单参数并通过单击“购买”或 “卖出”按钮。 关闭
TradePanel MT5
Alfiya Fazylova
4.85 (114)
交易面板是一个多功能的交易助手。 该应用程序包含 50 多个手动交易功能,并允许您自动执行大多数交易操作。 购买之前,您可以在模拟帐户上测试演示版本。 演示 此处 。 完整说明 此处 。 贸易。 让您一键执行基本交易操作: 开立挂单和开仓。 打开订单网格。 平仓挂单和持仓。 仓位反转(平仓买入并开仓卖出,或平仓卖出并开仓买入)。 锁定仓位(通过开立相反仓位使卖出和买入仓位的交易量相等)。 对所有仓位进行部分平仓。 将所有头寸的止盈和/或止损设置为同一水平。 将所有仓位的止损设置为盈亏平衡水平。 开仓订单和仓位时,您可以: 根据既定风险自动计算订单量。 一键打开多个订单。 将计算出的交易量分配给多个订单。 使用面板创建的线条和标记在图表上可视化未来订单的交易水平位置。 开仓时,设置最大点差限制。 使用止盈规模与止损规模的自动比率。 使用虚拟止损和止盈。 将当前点差添加到止损和止盈。 使用 ATR 指标计算止盈和止损。 设置待处理订单的到期日期。 使用挂单跟踪(挂单自动移动到价格后面指定的距离)。 平仓订单和平仓时,您可以: 一键按订单或仓位类型关闭。 只需点击一下,即可仅平仓盈利或无利可
Local Trade Copier EA MT5
Juvenille Emperor Limited
4.99 (67)
通过 Local Trade Copier EA MT5 获得非常快速的交易复制体验。它的简单1分钟设置,使您可以在同一台Windows计算机或Windows VPS上在多个MetaTrader终端之间复制交易,具有闪电般快速的复制速度,低于0.5秒。 无论您是初学者还是专业交易者, Local Trade Copier EA MT5 都提供了广泛的选项,可根据您的特定需求进行自定义。对于任何希望增加利润潜力的人来说,这都是终极解决方案。 今天就尝试一下,看看为什么它是市场上最快、最简单的贸易复印机! 提示: 您可以在您的模拟账户中下载并试用 Local Trade Copier EA MT5 模拟版: 这里 将下载的免费演示文件粘贴到您的 MT5 >> 文件 >> 打开数据文件夹 >> MQL5 >> 专家文件夹并重新启动您的终端。  免费演示版本每次可在 4 小时内发挥全部功能,仅限演示帐户。 要重置试用期,请转至 MT5 >> 工具 >> 全局变量 >> Control + A >> 删除。 请仅在非关键模拟账户上执行此操作,不要在挑战道具公司账户中执行此操作。 Loc
The product will copy all telegram signal to MT5 ( which you are member) , also it can work as remote copier.  Easy to set up, copy order instant, can work with almost signal formats, image signal,  s upport to translate other language to English Work with all type of channel or group, even channel have "Restrict Saving Content", work with  multi channel, multi MT5 Work as remote copier: with signal have ticket number, it will copy exactly via ticket number. Support to backtest signal. How to s
Trade Dashboard MT5
Fatemeh Ameri
4.96 (47)
疲于复杂的订单下达和手动计算?Trade Dashboard 是您的解决方案。凭借其用户友好的界面,订单下达变得轻而易举,只需点击一下,您就可以开设交易、设置止损和止盈水平、管理交易手数,并计算风险回报比,让您只需专注于您的策略。告别手动计算,使用 Trade Dashboard 简化您的交易体验。 立即下载演示版本 。 您可以在这里找到仪表盘功能和特性的详细信息 。 加入 Telegram 频道 。 购买后请给我发消息以获取支持。如果您需要添加更多功能,可以在产品的评论区留下您的想法,我愿意听取任何建议,希望您能在使用我的产品时获得最佳体验 。 这是 MT4 版本。 风险管理:使用 Trade Dashboard,可以将您的风险设置为账户余额或权益的百分比,或将风险设置为总金额。在图表上直观地定义您的止损,让工具准确计算每个货币对的适当手数。该工具还可以根据您期望的风险回报比自动设置止盈水平。它甚至可以在手数计算中涵盖佣金和点差费用。此外,您的止损和止盈可以转变为虚拟水平,隐藏于经纪商。通过 Trade Dashboard 的高级风险管理功能,掌控风险,保护您的资本。
MT5 to Telegram Signal Provider 是一个易于使用且完全可自定义的工具,它允许向 Telegram 的聊天室、频道或群组发送 指定 的信号,将您的账户变为一个 信号提供商 。 与大多数竞争产品不同,它不使用 DLL 导入。 [ 演示 ] [ 手册 ] [ MT4 版本 ] [ Discord 版本 ] [ Telegram 频道 ] 设置 提供了逐步的 用户指南 。 不需要了解 Telegram API;开发者提供了您所需的一切。 关键特性 能够自定义发送给订阅者的订单详情 您可以创建分层的订阅模型,例如铜、银、金。其中金订阅获得所有信号等。 通过 id、符号或评论过滤订单 包括执行订单的图表截图 在发送的截图上绘制已关闭的订单,以便额外核实 延迟发送新订单消息的可能性,以便在发送前对位置进行调整 订单详情完全透明: 新的市场订单*带截图 订单修改(止损、获利) 已关闭的订单*带截图 部分关闭的订单** 新的挂单 修改的挂单(进场价格) 挂单激活(作为新的市场订单附加) 已删除的挂单 历史订单报告*** 可自定义的评论 注意: *
Exp COPYLOT CLIENT for MT5
Vladislav Andruschenko
4 (22)
MT5 交易复印机是 МetaТrader 5 平台的交易复印机 。 它复制外汇交易 之间   任何账户 MT5   -   MT5, MT4   -   MT5 对于 COPYLOT MT5 版本(或 MT4   - MT4 MT5   -   MT4 对于 COPYLOT MT4 版本) 值得信赖的复印机! MT4版本 详细描述   +DEMO +PDF 如何购买 如何安装     如何获取日志文件     如何测试和优化     Expforex 的所有产品 您还可以在 МТ4 终端 (   МТ4   -   МТ4, МТ5   -   МТ4   ) 中 复制交易: COPYLOT CLIENT for MT4 此版本包括在终端 МТ5   -   МТ5, МТ4   -   МТ5 之间 。 交易复制器用于在 2/3/10 终端之间复制交易/头寸。 支持从模拟账户和投资账户复制。 该程序可以在多个终端绑定上运行。 使用它作为您在一个账户上交易的各种投资者账户的交易的同步器, - COPYLOT 会将您的交易复制到其他终端。 从 多个 终端复制到一个; 从一
将信号从您所属的任何渠道(包括私人和受限渠道)直接复制到您的 MT5。 该工具在设计时充分考虑了用户的需求,同时提供了管理和监控交易所需的许多功能。 该产品采用易于使用且具有视觉吸引力的图形界面。 自定义您的设置并在几分钟内开始使用该产品! 用户指南 + 演示  |   MT4版本  |   不和谐版本 如果您想尝试演示,请参阅用户指南。 Telegram To MT5 接收器在策略测试器中不起作用! Telegram 至 MT5 功能 一次复制多个通道的信号 从私人和受限频道复制信号 不需要机器人令牌或聊天 ID(如果出于某种原因需要,您仍然可以使用这些) 使用风险百分比或固定手数进行交易 排除特定符号 选择复制所有信号或自定义要复制的信号 配置单词和短语以识别所有信号(默认值应适用于 99% 的信号提供商) 配置时间和日期设置以仅在需要时复制信号 设置一次打开的最大交易量 交易和头寸管理 使用信号或自动设置的管理 通过设置每月、每周、每天、每小时或每分钟的最大交易次数,停止过度交易和报复性交易。 支持市价订单和挂单 每日最大利润目标(以美元为单位)以确保头寸并停止过度交易
Attention: this is a multicurrency EA, which trades by several pairs from one chart!  Therefore, in order to avoid duplicate trades, it is necessary to attach EA only to one chart, ---> all trading in all pairs is conducted only from one chart! we can trade simultaneously in three different pairs, as by default (EURUSD + GBPUSD + AUDUSD), which take into account the correlation when entering the market for all three; we can trade only EURUSD (or any currency pair) and at the same time take into
Hedge Ninja
Robert Mathias Bernt Larsson
5 (1)
請務必在 www.Robertsfx.com 加入我們的 Discord 社區,您也可以在 robertsfx.com 購買 EA 無論價格向哪個方向移動,都能贏得勝利 無論價格向哪個方向移動,該機器人都會根據價格的移動方向改變方向,從而獲勝。這是迄今為止最自由的交易方式。 因此,無論它向哪個方向移動,您都會贏(當價格移動到屏幕截圖中的任何一條紅線時,它會以您設置的利潤目標獲勝)。 您面臨的唯一風險是價格是否正在整合(停留在一個地方)。 對沖忍者是一種半自動交易工具,您可以使用下面的對沖設置進行設置。當您告訴它進行交易時,購買或出售它,然後為您處理一切。 每次機器人改變方向時,它都會彌補你之前的損失,所以當你到達任何一條紅線時,你的利潤將是你決定的。 一個好的經驗法則是使用相當高的風險來獲得回報,但是你在這個鏈接上知道如何交易這個機器人的交易秘密。你想要的是價格移動,一旦它開始移動,你就直接走向你的利潤資金:) 設置 ADR / 平均點差 ADR 是平均每日範圍,顯示該工具在一天內通常平均移動多少點。很高興知道這一點,因為您不希望該機器人在點差變得更高
YuClusters
Yury Kulikov
4.93 (41)
Attention: You can view the program operation in the free version  YuClusters DEMO .  YuClusters is a professional market analysis system. The trader has unique opportunities to analyze the flow of orders, trade volumes, price movements using various charts, profiles, indicators, and graphical objects. YuClusters operates on data based on Time&Sales or ticks information, depending on what is available in the quotes of a financial instrument. YuClusters allows you to build graphs by combining da
Trade copier MT5
Alfiya Fazylova
4.44 (25)
Trade Copier 是一种专业实用程序,旨在复制和同步交易账户之间的交易。 复制发生从供应商的帐户/终端到收件人的帐户/终端,安装在同一台计算机或 vps 上。 在购买之前,您可以在演示帐户上测试演示版本。 演示 这里 。 完整说明 这里 。 主要功能和优点: 支持复制MT5>MT5、MT4>MT5、MT5>MT4,包括МТ5 netting账户。 供应商和收件人模式在同一产品中实现。 简单直观的界面,允许您直接从图表中实时控制复制。 连接中断或终端重新启动时不会丢失设置和位置。 允许您选择要复制的符号,也可以替换接收者的符号,例如 EURUSD> USDJPY。 支持回拷贝。 能够仅复制某些订单。 允许您设置开仓交易价格的最大差异和最大时间延迟。 正确复制部分订单关闭的执行。 计算复制手数的几种方法。 同步止盈和止损。有几种方法可以计算它们的位置。 支持通过执行在“Market account”上工作,其中 SL / TP 仅在开仓后设置。 如何使用简单的设置复制交易 将供应商终端和接收终端安装在同一台计算机或 VPS 上。 在供应商终端上以“Master”模式安装复印机,然后
Mentfx Mmanage mt5
Anton Jere Calmes
4.25 (8)
The added video will showcase all functionality, effectiveness, and uses of the trade manager. Drag and Drop Trade Manager. Draw your entry and have the tool calculate the rest. Advanced targeting and close portions of a trade directly available in tool (manage trades while you sleep). Market order or limit order on either side with factored spread. Just draw the entry, the tool does the rest. Hotkey setup to make it simple. Draw where you want to enter, and the stop loss, the tool calculates al
交易管理器可帮助您快速进入和退出交易,同时自动计算风险。 包括帮助您防止过度交易、报复性交易和情绪化交易的功能。 交易可以自动管理,账户绩效指标可以在图表中可视化。 这些功能使该面板成为所有手动交易者的理想选择,并有助于增强 MetaTrader 5 平台。多语言支持。 MT4版本  |  用户指南+演示 交易经理在策略测试器中不起作用。 如需演示,请参阅用户指南 风险管理 根据%或$自动调整风险 可选择使用固定手数或根据交易量和点自动计算手数 使用 RR、点数或价格设置盈亏平衡止损 追踪止损设置 最大每日损失百分比,在达到目标时自动平仓所有交易。 保护账户免遭过多提款并阻止您过度交易 最大每日损失(以美元为单位)在达到目标时自动关闭所有交易。 保护账户免遭过多提款并阻止您过度交易 一键实现所有交易的盈亏平衡 自动计算从手机/电话发送的交易的风险 OCO 在设置中可用 交易和头寸管理 通过设置每月、每周、每天、每小时或每分钟的最大交易次数,停止过度交易和报复性交易。 高级挂单管理。 调整何时关闭挂单的规则 追踪挂单 支持市价订单和挂单 每日最大利润目标(以美元为单位)以确保头寸并停
Set price targets, and leave everything else to HINN Lazy Trader! This tool is designed for automatic position sizing from specified levels to designated targets. Using a VPS is recommended (*). The demo version   limited in functionality, be sure to watch this video before using -->  https://youtu.be/geLQ6dUzAr8 A community for users, product discussion, update news, and first line of support are organized in a free Discord: https://discord.gg/zFhEZc7QDQ Use Webmoney For payments in cryptocu
News Filter Tool
Apex Software Ltd
5 (1)
提升您的交易表现,通过新闻事件洞察 在快節奏的交易世界中,新聞事件可能會對市場價格產生重大影響。了解這些事件如何影響價格變動對於在波動時期管理交易至關重要。新聞工具 EA 旨在提供對歷史和即將發生的新聞事件的見解,幫助您做出明智的交易決策。 此EA无法在策略测试器中运行。 用户指南 主要功能: 历史影响分析 了解价格如何响应特定过去新闻事件的波动。分析事件是否通常伴随着看涨或看跌趋势,并查看平均价格影响,以点数或百分比形式,随时间框架的调整而变化。可视化图表帮助您观察新闻事件与价格反应的关系,从而获得更深入的市场见解。 实时新闻集成 在MT5中直接接收即将发生的新闻事件的实时更新。为特定事件或重要性级别设置提醒,并按货币和相关性筛选事件,以关注对您的交易策略至关重要的内容。 自动化EA管理 此工具帮助您在新闻事件期间管理专家顾问(EA),允许您在重大新闻事件之前暂停EA,并在事件后无缝重新应用。您可以自定义时间设置,确保EA恢复时保持相同的参数,避免中断。 用户友好界面 使用符号选择器轻松切换分析不同的市场工具。新闻事件以颜色编码的重要性级别和国家旗帜标记在图表上,便于快速识别
Trade Assistant 38 in 1
Makarii Gubaydullin
4.89 (18)
多功能工具:超过65个功能,其中包括:手数计算,价格行为,盈亏比,交易管理,供需区域。 演示版   |   用户手册   |  MT5版 任何问题 / 改进意见 / 如果发生了故障或错误    都可以联系我 该实用程序在策略测试器中不起作用:您可以在此处下载 演示版来测 试产品。 Trading functions require permitted auto trading (including on the broker's side) 简化,加快并且自动化你的交易过程。利用这款工具的控制功能就能增强普通交易端的执行力。 建立一笔新的交易:手数 / 风险 / 盈亏计算 1. 手数计算工具 (基于风险规模的交易量计算) 2. 风险计算工具 (基于手数大小的风险额计算) 3. 盈亏比 4. 订单的激活和触发,买入或卖出限价/买入或卖出止损 5. 虚拟的止损/止盈 (隐藏的止损,止盈:交易商不可见) 6.  智能的止损/入场点:当价格柱在收盘时已超越了才入场 (避免无效触发) 7. 隐藏掉挂单 (虚拟的订单) 8. 预订挂单:在市场关闭的时候你也可以下挂单 (适合周末
The News Filter MT5
Leolouiski Gan
4.5 (8)
这个产品在新闻时间过滤所有的专家顾问和手动图表,因此您不必担心突然的价格波动会破坏您的手动交易设置或其他专家顾问输入的交易。此产品还带有完整的订单管理系统,可在任何新闻发布前处理您的持仓和挂单。一旦您购买了   The News Filter ,您将不再需要依赖以后的专家顾问内置的新闻过滤器,因为这个产品可以从此过滤它们所有。 新闻选择 新闻来源于Forex Factory的经济日历。 选择可以基于任何一种货币,如USD,EUR,GBP,JPY,AUD,CAD,CHF,NZD和CNY等。 选择也可以基于关键识别,例如Non-Farm (NFP),FOMC,CPI等。 能够选择新闻影响级别的筛选,从低、中、到高影响。 自动模式只选择与图表相关的新闻。 新闻来源每小时自动刷新,以确保最新的新闻数据。 为每个新闻影响级别提供单独的输入,以确定您要过滤掉的新闻发布前后的分钟数。 订单管理选项 在新闻发布前关闭未平仓头寸的选项,并在新闻发布后恢复它们。 在新闻发布前删除挂单的选项,并在新闻发布后恢复它们。 在新闻发布前移除止损和止盈水平的选项,并在新闻发布后恢复它们。 在新闻发布前移动
-25% discount ($199 -> $149) Advanced trading tool: One click smart orders that execute under your conditions Developed by trader for trading community:  position size calculator (lot size), open position after price action, strategy builder, set and forget trading, mobile notifications... Risk Management -  Risk percentage position size calculator, gain percentage, target risk reward ratio, spread and commissions are included in calculations 7 Advanced order types  - Set and forget trading w
RiskGuard Management
MONTORIO MICHELE
5 (13)
ATTENTION the expert does not work in strategy tester, for a trial version visit my profile. Manual RiskGuard Management   RiskGuard management was born with the idea of ​​helping traders from their initial journey to becoming expert and aware traders. Compatible with any operating system whether Mac or Windows. The operations panel is integrated into the graph giving the possibility to choose size and position between right and left, while the various buttons light up when they can be used,
交易面板一键交易。 处理仓位和订单! 通过 图表 或 键盘 进行交易 。 使用我们的交易面板,您只需单击一下即可直接从图表中执行交易,执行交易操作的速度比使用标准 MetaTrader 控件快 30 倍。 参数和函数的自动计算使交易者的交易更加快捷、方便。 图形提示、信息标签和有关贸易交易的完整信息均位于图表 MetaTrader 上。 MT4版本 详细描述   +DEMO +PDF 如何购买 如何安装     如何获取日志文件     如何测试和优化     Expforex 的所有产品 打开和关闭、反转和锁定、部分关闭/Autolot。虚拟/真实止损/止盈/追踪止损/盈亏平衡,订单网格... МetaТrader 5 中主要订单的交易控制面板 :买入、卖出、buystop、buylimit、sellstop、selllimit、平仓、删除、修改、追踪止损、止损、获利。 有 5 个选项卡 可用:头寸、挂单、账户信息、信号和总利润。 Description on English VirtualTradePad在“  MQL5语言最佳图形面板  ”竞赛中 获得二等奖 。 注意
Adam FTMO MT5
Vyacheslav Izvarin
5 (2)
ADAM EA Special Version for FTMO Please use ShowInfo= false for backtesting ! Our 1st EA created using ChatGPT technology Trade only GOOD and checked PROP FIRMS  Default parameters for Challenge $100,000 Tested on EURUSD and GBPUSD only  Use 15MIN Time Frame Close all deals and Auto-trading  before Weekend at 12:00 GMT+3  Friday For Prop Firms MUST use special Protector  https://www.mql5.com/en/market/product/94362 -------------------------------------------------------------------------------
Grid Manual MT5
Alfiya Fazylova
4.87 (15)
Grid Manual是一个交易面板,用于处理订单网格。 该实用程序是通用的,具有灵活的设置和直观的界面。 它不仅可以在亏损方向上设置订单网格,还可以在盈利方向上设置订单网格。 交易者不需要创建和维护订单网格,实用程序会这样做。 打开一个订单就足够了,Grid manual会自动为它创建一个订单网格,并伴随它直到非常关闭。 完整说明和演示版 此處 。 该实用程序的主要特性和功能: 伴隨以任何方式打開的訂單,包括從移動終端打開的訂單。 適用於兩種類型的網格:“限制”和“停止”。 使用兩種方法計算網格間距:固定和動態(基於 ATR 指標)。 允許您更改未結訂單網格的設置。 顯示圖表上每個網格的盈虧平衡水平。 顯示每個網格的利潤率。 允許您一鍵關閉網格中的盈利訂單。 讓您一鍵關閉每個訂單網格。 允許您對訂單網格應用追踪止損功能。 允許您在訂單網格上應用將訂單網格的止損轉移到盈虧平衡水平的功能。 相對於訂單網格的盈虧平衡水平自動重新排列止盈(僅在限價網格模式下,距離取決於所選的計算類型:“保守”或“激進”)。 最多可管理 20 個訂單網格,每個網格最多可包含 100 個訂單。 計算初始手數時,
Cerberus Equity Watcher
Samuel Bandi Roccatello
5 (2)
Cerberus the Equity Watcher 是一种风险管理工具,可以持续监控您的账户资产并避免因错误的 EA 或您的情绪行为(如果您是全权交易者)导致的重大亏损。对于依赖 EA 的系统交易者来说,它非常有用,EA 可能包含错误,或者在意外的市场条件下可能表现不佳。 Cerberus 允许您设置最小净值和(可选)最大值,如果达到其中任何一个,则所有头寸都被平仓,所有挂单被关闭,所有 EA 被“杀死”。在展平所有位置后,将向用户手机发送通知,并在屏幕上显示一条清晰的消息。在“扁平化”之后, Cerberus 继续关注股权价值,并继续扼杀任何进一步的交易尝试,直到它被重新初始化。 Cerberus 执行的任何操作都清楚地显示在屏幕上,报告在“专家顾问”选项卡上,并向用户发送通知。为了避免用户错误,对用户输入的输入值和自动交易的当前状态进行了多次检查。 ****** 特征 最小和最大权益值可以以账户货币或初始权益的百分比设置 最大净值是可选的 如果达到最小/最大净值,则所有 EA 将独立于它们交易的符号被终止 第一次压扁后几秒钟进行双重检查 Cerberus 在拉平后也继续监控股权
The  Easy Strategy Builder (ESB)  is a " Do It Yourself " solution that allows you to create a wide range of the automated trading strategies without any line of codes. This is the world’s easiest method to automate your strategies that can be used in STP, ECN and FIFO brokers. No drag and drop is needed. Just by set conditions of your trading strategy and change settings on desired values and let it work in your account. ESB has hundreds of modules to define unlimited possibilities of strategi
The top-selling EAs on the market cost a lot and one day they are suddenly gone. This is because one strategy will not work in the forex market all the time. Our product is unique from all others in the MQL Marketplace because our EA comes with 34+ built-in indicators that allow develop strategies every time.  You build your strategy and keep updating it. If one strategy does not work, simply build another all using only one EA. This is All-In-One EA   in this market place. You can use as trade
Unlimited Trade Copier Pro MT5 is a tool to copy trade remotely to multiple MT4, MT5 and cTrader accounts at different computers/locations over internet. This is an ideal solution for you if you are a signal provider and want to copy your trades to other receivers globally on your own rules. One provider can copy trades to multiple receivers and one receiver can get trade from multiple providers as well. The provider can even set the subscription expiry for each receiver, so that receiver will n
UTM Manager 是一款直观且易于使用的工具,可提供快速高效的交易执行。其中一项突出的功能是“忽略价差”模式,该模式使您能够以蜡烛的价格进行交易,完全忽略价差(例如,允许在 LTF 上交易更高价差的货币对,避免因价差而退出交易)。 UTM Manager 的另一个关键方面是其独特的本地交易复印机,允许在每个经纪商中灵活地运行不同的交易策略和设置,例如不同的 TP、BE 和风险规则。 交易执行: 快速高效的交易执行:通过点击图表上的入场价格和止损价格或使用一键固定止损尺寸功能轻松进入交易。 自动手数计算:根据预定义的风险设置计算手数,当通过拖动修改仓位时会重新计算手数。 能够同时处理一个或多个职位。 止盈和盈亏平衡: 灵活的止盈设置:通过特定的风险回报 (RR) 比率设置灵活的部分止盈水平。 可配置的自动盈亏平衡功能:当达到一定的利润水平时,将止损移至盈亏平衡点。 用户友好的界面: 用户友好的图形界面 (GUI),可轻松保存和加载设置。 内置帮助工具提示来解释其他功能。 职位定制: 仓位定制和调整:经理将所有仓位绘制在图表上,通过拖动线条即可轻松定制和调整。 图表上的按钮: 图
这是一个可视化的交易面板,可帮助您轻松进行交易管理,避免人为错误并增强交易活动。它结合了易于使用的视觉界面以及完善的风险和位置管理方法。 [ 安装指南 | 更新指南 | 故障排除 | 常见问题 | 所有产品 ] 易于使用 从图表轻松交易 精确的风险管理交易,无忧 保本是重中之重 让利润不受您的关注 尽快享受无风险交易 所有已开通交易的自动追踪止损 交易开始后立即设置初始止损 进行交易后,EA将执行以下任务: 初始止损/获利被自动放置 它会尽快锁定自由行(可选) 它将止损首次移动到盈亏平衡点(可选) 它使用您所需的方法跟踪止损,直到止损为止 其他很酷的功能是: 出色的终端活动报告 单一但功能强大的尾随止损方法 干净的图表界面 没有输入参数 我进行交易后会怎样? 这是您进行交易后EA的操作: 它放置初始止损并获利订单。 尽快搭便车并确保保本。默认情况下,这是通过在达到盈亏平衡点时关闭50%的交易来完成的,默认情况下为5点。这意味着,如果您日后被淘汰,您将一无所获(可选)。 盈亏平衡后,跟踪止损开始运行。 它跟踪止损,直到止损为止,让利润运行。 尾随止损如何运作? 追踪止损表示
作者的更多信息
This product can be used to synchronize multiple Charts, and each Chart can be set to a different sync mode. With this product you can better view and manipulate charts: different time frames for a single Symbol, the same time frame for multiple Symbols... and more. PS: The link below is the FreeDemo product, you can use it on EURUSD/XUAUSD/USDCNH symbol: https://www.mql5.com/en/market/product/38557 Feature: Chart settings  can be synchronized, including : background, indentation, size, etc.
Do you think it's a bit cumbersome when you need to switch symbols or timeframes with mouse click? 1. What is this? This is a program that can switch symbols and timeframes with direction keys. Fast switching, very convenient, no mouse click required. For traders, one symbol with multi-timeframe charts are usually added,  you can change symbol on those charts easily. For multi-currency traders, different symbol charts are usually added, you can also change those timeframes easily. I wrote this p
1.这是什么         上涨波动和下降波动是不一样的,无论是学术研究还是实际检验都说明了这一点。         原始的ATR指标是把上涨波动和下降波动放在一起进行计算。本指标则是把上涨波动和下降波动分开进行计算,这样能更好的帮助你研究市场。 2.指标说明         本指标的计算有两种模式,如下表所示: 0 1 2 3 4 5 波动方向 + - + + - + TR 15 20 17 5 16 8 原始ATR (15+20+17+5+16+8)/6=13.5 模式1 不以0填充位置,周期数改变 模式1上涨TR 15 17 5 8 模式1下跌TR 20 16 模式1上涨ATR (15+17+5+8)/4=11.25 模式1下跌ATR (20+16)/2=18 模式2 以0填充位置,周期数不变 模式2上涨TR 15 0 17 5 0 8 模式2下跌TR 0 20 0 0 16 0 模式2上涨ATR (15+0+17+5+0+8)/6=7.5 模式2下跌ATR (0+20+0+0+16+0)/6=6         如上表。比如周期为6的序列中,有4个上涨2个下跌。模式
1.这是什么: 下载Market Watch中所有的Symbol数据到系统。PS:不是把数据输出到文档。 2.为什么要用这个: 如果系统中没有数据:网络链接不好的时候,用MT5看一个Symbol需要等待很长时间;在不同Symbol或不同TimeFrame切换,如果系统没有数据也需要等待很久;如果进行长时间回测,系统没有数据,需要下载很长时间。 所以提前把历史数据下载到系统中,能提高工作效率。 3.怎么使用: parameters: input bool bool_usualtimeframe=true; //true-系统默认TimeFrames; || false-所有的TimeFrames. input bool bool_allSymbol=true; //true-Market Watch中所有品种; || false-根据你的输入 input string input_Symbol=NULL; //上面参数为false时,输入你的Symbol名称 input datetime time_Start=D'2017.01.01'; //默认数据下载开始时间 input int s
Do you think it's a bit cumbersome when you need to switch symbols or timeframes with mouse click? 1. What is this? This is a program that can switch symbols and timeframes with direction keys. Fast switching, very convenient, no mouse click required. For traders, one symbol with multi-timeframe charts are usually added,  you can change symbol on those charts  easily . For multi-currency traders, different symbol charts are usually added, you can also change those timeframes easily. I wrote thi
According to trading experience: Some symbols are easy to reverse on certain days, such as Monday, or afternoon, and so on. So comparing the current price with the corresponding historical moment price is valuable. If the price coordinate system uses a logarithmic price, you will get a lot of valuable information. 1. What is this? This program can convert the symbol price and add it to your Chart. You can compare it with your major chart. The DEMO version Link: https://www.mql5.com/en/market/p
What is this: Violent trading: means sending a large number of orders to your brokerage server,  it can conduct a stress test of the trading. In this program you can run a variety of trading tests.  Now you can trade at high speed, For example 1000 orders in an instant. The Demo version's link:  https://www.mql5.com/en/market/product/38431/ Why to use: Whether manual trading or EA trading,  the status of the broker server is very important. So it is beneficial to conduct a trading stress test on
1. Why did I develop this series of indicators I found that most traders need to use multiple time frame indicators. They usually switch time frame to see indicators. However, once the timeframe is switched, you cannot see the  corresponding relationship  between  the price in the smaller timeframe  and  the indicator in the larger timeframe . For example: if your price chart is in H1 timeframe, you can see H4, D1 and W1 indicators in H1 timeframe Chart. This is more helpful for you to find t
筛选:
[删除] 2019.02.14 14:59 
 

用户没有留下任何评级信息

[删除] 2019.02.14 14:08 
 

用户没有留下任何评级信息

回复评论
版本 1.11 2021.10.23
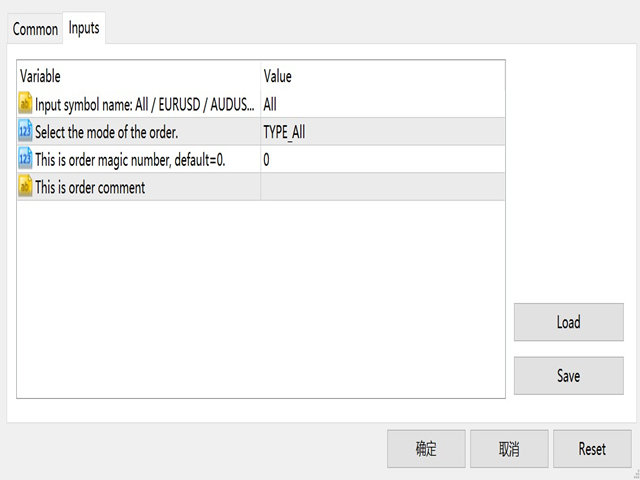
magic number: default 0 means all.
comment: default "" means all.
版本 1.10 2020.12.01
Now you can delete pending tickets at high speed, for example 1000 pending tickets can be deleted instantaneously.

版本 1.7 2020.06.06
recompiled for MT5 update.
版本 1.6 2019.05.07
Add to print the total time of deleting all pending orders.
版本 1.2 2019.02.14
1.01 Fix some bug.

1.02 Add alert when you have the wrong operation.