• 概述
  • 评论
  • 评论

Bayes Quantum Signals

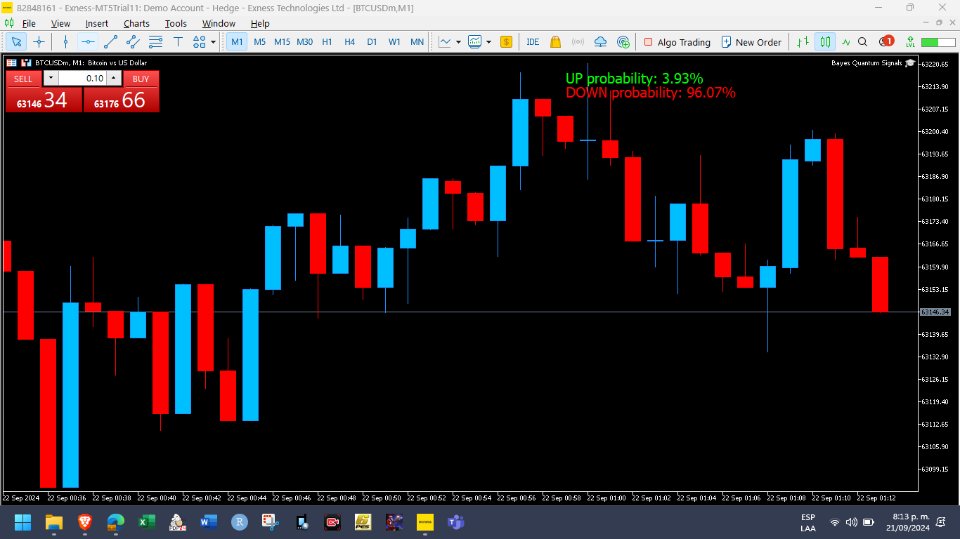
This is a system that allows you to instantly calculate future predictions about the movement of a listed asset, to better inform your buying or selling decisions and reduce the risk of your operations.  Bayes Quantum Signal can be used in algorithmic trading mode as an Expert Advisor, or also in a complementary way to support your own trading strategy. In this case, the system will display the bullish or bearish probabilities on your Metatrader 5 screen.

How does Bayes Quantum Signal work?

This algorithm is mainly based on a dynamic application of Bayes' theorem, concepts of differential calculus and financial econometrics.

The system steps are as follows:

1. A historical database is taken, whose extension and temporality are defined by the same operator.

2. From this base, the system calculates the bullish and bearish prior probabilities, and weights them based on their standard deviation measured dynamically through an eGARCH model. The basic idea is that larger and more skewed returns will have a larger impact on the calculation of posterior probabilities.

3. At all times the system calculates the real-time return of the candle that is forming and weights it with the previously calculated standard deviation. This is where the system applies Bayes' Theorem to constantly update the conditional probability calculation. In natural language, this can be expressed as "given that return x is occurring right now, what is the probability that the price will go up or down?"

It is important to highlight that both the previous and posterior probabilities are updated in real time, that is,  Bayes Quantum Signal always takes the last n candles for its calculations. This is the key point of the system, and it allows us to offer added value to our clients. Of course, a human cannot do this calculation in real time, or at least his/her margin of error will be much higher.

4. If the posterior probabilities are equal or exceed the inputs given by the user, then a buy or sell order will be activated as appropriate. The system allows you to modify the lot of both bying and selling operations before execution, as well as the take profit and stop loss of said orders (measured in points). Furthermore, these probabilities can be seen on the operator's screen, the color and font of which can be customized.

Input parameters: 

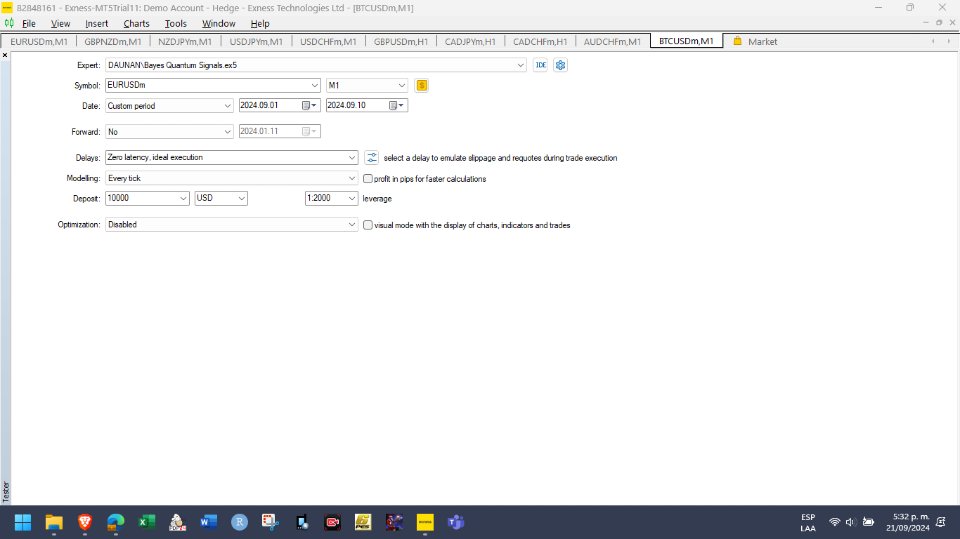
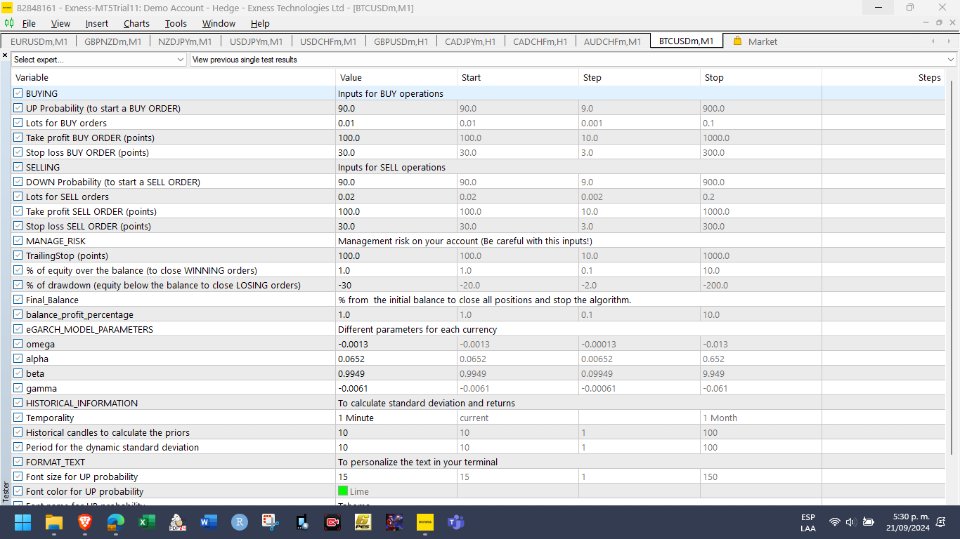
For a better visualization, the EA will display a dialog box separated by the following sections, in which the user must define the following inputs for each type of order: 

Buying operations

  • UP Probability (to start a BUY ORDER): Minimum probability value for which the user wants to start a buy order. It is defined as a number from 0 to 100. For example, to enter when the algorithm calculates an 80% UP probability, you enter the number 80 as input (without percentage notation).
  • Lots for BUY orders: Number of lots for each buy order. It is a fixed amount.
  • Take profit BUY ORDER (points): Fixed level of take profit for each buy order. It is defined in points.  
  • Stop loss BUY ORDER (points): Fixed stop loss level for each buy order. It is defined in points. 

Selling operations

  • DOWN Probability (to start a SELL ORDER): Minimum probability value for which the user wants to start a sale order.  It is defined as a number from 0 to 100. For example, to enter a sale order when the algorithm calculates an 80% down probability, you enter the number 80 as input (without percentage notation).
  • Lots for SELL orders: Number of lots for each sale order. It is a fixed amount.
  • Take profit SELL ORDER (points): Fixed take profit level for each sale order. It is defined in points.  
  • Stop loss SELL ORDER (points): Fixed stop loss level for each sale order. It is defined in points.  

Risk management in your account:

Important note:  Bayes Quantum Signal applies take profit and stop loss on some orders, which can be linked to the TrailingStop (points) input, where the user can define the points to apply trailing stops to previously defined levels. 

In those orders that are created without take profit or stop loss, the algorithm manages its profits and losses with the 3 points defined below: 

  • % of equity over the balance (to close WINNING orders): Define the percentage of equity above the balance at which all WINNING orders will be closed.
  • % of drawdown (equity below the balance to close LOSING orders): Define the percentage of equity below the balance at which all LOSING orders will be closed.
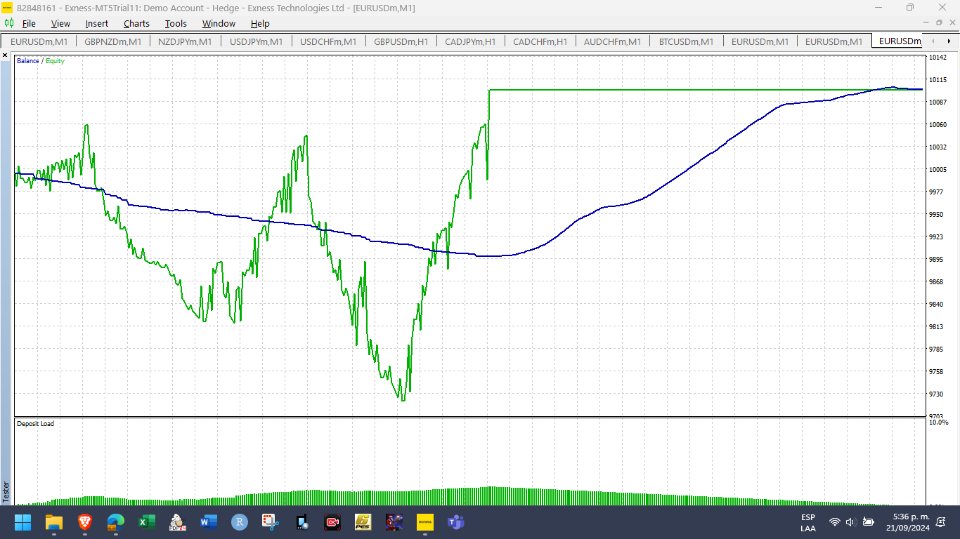
  • Balance_profit_percentage: Define the final percentage you expect to obtain on your balance and at which all WINNING and LOSING orders will be closed.

eGARCH Model Specification:

At this point it is important to highlight that each financial asset will have its own parameters. It is recommended to study the fundamentals of the eGARCH model or access reliable sources to obtain these parameters. You can also run your own regressions in some statistical software for this purpose.

  • omega: Long-term volatility
  • alpha: Impact of lagged volatility on current volatility
  • beta: Persistence of volatility over time
  • gamma: Asymmetry or leverage on volatility

Parameters for historical information

  • Temporality: Drop-down list in which the user can choose a temporality from one minute to one month.
  • Historical candles to calculate the priors: Number of candles that the user considers for the model to calculate the prior probabilities. These are related to the previously chosen temporality. For example, if the user chooses a time frame of 1 minute, and in this input defines 10, the model will take prior information from the previous 10 minutes. 
  • Period for the dynamic standard deviation: Number of candles that the user considers for the model to calculate the standard deviation through the eGARCH model.

Inputs to format the text

The user can give the desired format to the text displayed on the screen, like this: 

  • Font size for UP probability: Font size for the bullish probability text.
  • Font color for UP probability: Font color for the bullish probability text.
  • Font name for UP probability: Font name for the bullish probability text.
  • Font size for DOWN probability: Font size for the bearish probability text.
  • Font color for DOWN probability: Font color for bearish probability text
  • Font name for DOWN probability: Font name for the bearish probability text.

Final recommendations:

1. According to the tests carried out, this system is designed to open positions from 1 minute and on. It is important that you test the system to adjust it according to your own needs and investment objectives.

2. Please watch the full video in which I explain how the system works.

Thank you for your time.

推荐产品
Market Profile 3 ForexArby com
Hussien Abdeltwab Hussien Ryad
3.83 (12)
Market Profile 3 MetaTrader 5 indicator  version 4.70— is a classic Market Profile implementation that can show the price density over time, outlining the most important price levels, value area, and control value of a given trading session. This indicator can be attached to timeframes between M1 and D1 and will show the Market Profile for daily, weekly, monthly, or even intraday sessions. Lower timeframes offer higher precision. Higher timeframes are recommended for better visibility. It is als
FREE
Renko Plus
Eadvisors Software Inc.
With Renko Plus you can use the features in the Indicator functionality, just add it to the Metatrader5 chart.             The Renko chart is a type of chart, developed by the Japanese, that is constructed using price movement rather than standardized prices and time intervals like most charts. It is believed to be named after the Japanese word for bricks, "renga", as the graphic looks like a series of bricks.             A new brick is created when the price moves a specified p
Renko Chart
Marcin Konieczny
3.63 (8)
This indicator allows to display Renko charts in the indicator window. Renko charts show only price movements that are bigger than the specified box size. It helps to eliminate noise and allows to focus on main trends. Time is not a factor here. Only price movements are taken into account. That's why Renko chart is not synchronized with the main chart it is attached to. Indicator works in two modes: CLOSE - only close prices are taken into account while building the chart HIGH_LOW - only high/
FREE
Trend Catcher with Alert MT5
Issam Kassas
4.63 (62)
趋势捕捉器: 具有警示指标的趋势捕捉器策略是一种多功能的技术分析工具,可帮助交易员识别市场趋势和潜在的进出点。它采用动态趋势捕捉器策略,根据市场条件进行调整,清晰地呈现趋势方向。交易员可以自定义参数,以符合其偏好和风险容忍度。该指标有助于识别趋势,发出潜在的反转信号,充当跟踪止损机制,并提供实时警报,以便及时应对市场。 具有警示指标的趋势捕捉器策略是一种多功能的技术分析工具,可帮助交易员识别市场趋势和潜在的进出点。它采用动态趋势捕捉器策略,根据市场条件进行调整,清晰地呈现趋势方向。交易员可以自定义参数,以符合其偏好和风险容忍度。该指标有助于识别趋势,发出潜在的反转信号,充当跟踪止损机制,并提供实时警报,以便及时应对市场。 特点: 趋势识别:信号牛市趋势和熊市趋势。 趋势反转:当蜡烛颜色从牛市变为熊市,反之亦然时,提醒可能的反转。 实时警报:为新趋势识别生成警报。 建议: 货币和货币对:EURUSD,AUDUSD,XAUUSD... 时间框架:H1。 账户类型:任何ECN,低点差账户。
FREE
该指标建立当前报价,可以与历史报价进行比较,并在此基础上进行价格走势预测。指示器有一个文本字段,用于快速导航到所需日期。 选项: 符号 - 选择指标将显示的符号; SymbolPeriod - 选择指标从中获取数据的时段; IndicatorColor - 指示器颜色; HorisontalShift - 由指标绘制的报价移动指定的柱数; Inverse - true 反转引号,false - 原始视图; ChartVerticalShiftStep - 图表垂直移动(键盘上的向上/向下箭头); 接下来是文本字段的设置,您可以在其中输入日期,您可以通过按“回车”立即跳转到该日期。 接下来是文本字段的设置,您可以在其中输入日期,您可以通过按“回车”立即跳转到该日期。
This indicator uses a mathematical calculation algorithm . This algorithm calculates the remainder between the updated model and the actual values and produces the possible progress of the graph on the graph. It is not a super prophet in trading, but it is very good for the trader when entering the market and to analyze it before entering. Applicable for all currencies. Данный индикатор использует алгоритм математических вычислений . Данный алгоритм вычисляет остаток между обновленной моделью и
Introduction This indicator detects volume spread patterns for buy and sell opportunity. The patterns include demand and supply patterns. You might use each pattern for trading. However, these patterns are best used to detect the demand zone (=accumulation area) and supply zone (=distribution area). Demand pattern indicates generally potential buying opportunity. Supply pattern indicates generally potential selling opportunity. These are the underlying patterns rather than direct price action. T
FREE
Lorentzian AI
Michael Prescott Burney
Lorentzian A.I Indicator System Revolutionize your trading strategy with the Lorentzian A.I Indicator System, an advanced tool designed for traders who demand precision and adaptability. Whether you're trading Crypto, Indices, Forex, or Stocks, this state-of-the-art indicator uses cutting-edge technology to keep you ahead of the market. Key Features: Advanced Lorentzian Classification (LC): Utilize sophisticated LC algorithms to generate precise buy and sell signals, ensuring you make informed
FREE
The indicator detects and displays М. Gartley's Butterfly pattern. The pattern is plotted by the extreme values of the ZigZag indicator (included in the resources, no need to install). After detecting the pattern, the indicator notifies of that by the pop-up window, a mobile notification and an email. The pattern and wave parameters are displayed on the screenshots. The default parameters are used for demonstration purposes only in order to increase the amount of detected patterns. Parameters
Auto Fibonacci
Ali Gokay Duman
5 (2)
This indicator calculates fibonacci levels via moving averages trend and draw these lines. You can change fast and slow Moving Averages settings for customization. Inputs: Fast MA Time Period :  64 Fast MA Shift: 0 Fast MA Method: Smoothed Fast MA Apply To: Median Price Slow MA Time Period: 32 Slow MA Shift: 0 Slow MA Method: Smoothed Slow MA Apply To: Median Price ZigZag: False ZigZag Color: Red ZigZag Type: DashDot ZigZag Width: VeryThin Fibo Settings TrendFibonacci: True FiboTrendColor: Blac
FREE
GoldTrader
Yashar Seyyedin
Please backtest with the exact balance of your live account before applying to real money. ==> If account balance is too low it may not trade at all! For MT4 version please contact via private message. martingale version is available here . Strategy description - Detect trend based on EMA18-EMA50-SMA200 alignment in three time frames: M15, H1, H4 - Trade in trend direction and exit when above alignment is broken. - The bot is tuned to trade XAUUSD(Gold). - The bot output is break even in rangi
FREE
What is this indicator? This indicator is the MACD (Moving Average Convergence/Divergence) supporting Virtual Trading mode of  Knots Compositor . When the mode is turned on, the indicator will be recalculated based on the displayed candlesticks. When the mode is turned off, the indicator will be recalculated based on the original chart candlesticks. Types of the applied price - Close - Open - High - Low - Median Price (HL/2) - Typical Price (HLC/3) - Weighted Price (HLCC/4) KC-Indicators
FREE
Order Book, known also as Market Book, market depth, Level 2, - is a dynamically updated table with current volumes of orders to buy and to sell specific financial instument at price levels near Bid and Ask. MetaTrader 5 provides the means for receiving market book from your broker, but in real time only, without access to its history. The indicator OrderBook Cumulative Indicator accumulates market book data online and visualizes them on the chart. In addition, the indicator can show the market
Advanced 4xZeovo MT5 Indicator (MetaTrader 5)   Product Description  4xZeovo is a powerful trading indicator system monitoring 24/7 financial markets. Metatrader5 tool designed to find the best buying/selling opportunities and notifies the user.    Making life easy for traders in helping with the two most difficult decisions with the use of advanced innovate trading indicators aiming to encourage users to hold the winning positions and take profit at the best times.    Equipped with a unique tra
Ultimate Candle Patterns
Wojciech Daniel Knoff
This is a multi-symbol and multi-timeframe table-based indicator designed for a candlestick patterns detection with 46 patterns for META TRADER 5. Each formation has own image for easier recognition. Here you find most popular formations such as "Engulfing", "Hammer", "Three Line Strike", "Piercing" or Doji - like candles. Check my full list of patterns on my screenshots below. Also you can not only switch all bearish or bullish patterns from input, but also select formation for a specified symb
Basic Harmonic Pattern MT5
Mehran Sepah Mansoor
4.8 (54)
该指标可识别预测市场反转点的最常用谐波形态。这些谐波形态是外汇市场上不断重复出现的价格形态,暗示着未来可能的价格走势/ 免费 MT4 版本 此外,该指标还内置了市场进入信号以及各种止盈和止损。需要注意的是,虽然谐波形态指标本身可以提供买入/卖出信号,但建议您使用其他技术指标来确认这些信号。例如,在进行买入/卖出之前,您可以考虑使用 RSI 或 MACD 等震荡指标来确认趋势方向和动能强度。 该指标的仪表盘扫描器:( Basic Harmonic Patterns Dashboard ) 包括的谐波形态 加特里 蝶形 蝙蝠型 螃蟹 鲨鱼 赛弗 ABCD 主要输入 Max allowed deviation (%):   该参数是指谐波图形形成时的允许偏差。该参数决定了谐波图样的结构可以变化多少,而指标不会将其视为有效图样。因此,如果设置的百分比越高,则模式识别的灵活性就越大,而如果设置的值越低,则限制性就越大。例如:如果设定值为 30%,那么指标将把当前价格 ±30% 范围内符合形态比例的形态视为有效形态。 Depth:   该参数决定了谐波形态的每个波浪中必须
FREE
What is this indicator? This indicator is the RSI (Relative Strength Index) supporting Virtual Trading mode of  Knots Compositor . When the mode is turned on, the indicator will be recalculated based on the displayed candlesticks. When the mode is turned off, the indicator will be recalculated based on the original chart candlesticks. Types of the applied price - Close - Open - High - Low - Median Price (HL/2) - Typical Price (HLC/3) - Weighted Price (HLCC/4) KC-Indicators -   KC-MA   (M
FREE
Gino Renko
Stephane, Andr Valette
1 (1)
Another renko-based indicator. It returns different usable values ​​for an EA, and is directly displayed on the main chart. Its setting is very simple: The size of the renko The number of bars taken into account The falling color The color on the rise Returned values: Buffer 0 : Value of the middle Buffer 1 : Value of the Top Buffer 2 : Value of the Bottom Buffer 3 : Direction of renko (0.0 for top ; 1.0 for bottom) Buffer 4 : Ratio of the renko, for example, if it is twice, 3 times, ro more of
Important Lines
Terence Gronowski
4.85 (20)
This indicator displays Pivot-Lines, preday high and low, preday close and the minimum and maximum of the previous hour. You just have to put this single indicator to the chart to have all these important lines, no need to setup many single indicators. Why certain lines are important Preday high and low : These are watched by traders who trade in a daily chart. Very often, if price climbs over or falls under a preday low/high there is an acceleration in buying/selling. It is a breakout out of
FREE
LT Agression Indicator
Thiago Duarte
5 (3)
This is a buyer and seller aggression indicator that analyzes the shape of each candle and project this data in a histogram form. There are 4 histograms in one. On the front we have two: Upper - Buyer force. Lower - Seller force. At the background we also have two histogram, both with same color. They measure the combined strenght of buyers and sellers. This histograms can be turned off in Input Parameters. It is also possible to have the real or tick volume to help on this force measurement. IN
FREE
Donchian Pro
Paulo Henrique Faquineli Garcia
5 (2)
The Donchian Channel Channels are among the most popular tools of technical analysis, as they visually convey to the analyst the limits within which most price movement tends to occur. Channel users know that valuable information can be obtained at any time, whether prices are in the central region of a band or close to one of the border lines. One of the best known techniques to explore these concepts is Bollinger Bands. However, John Bollinger was not the only one to research the applicatio
FREE
High Low Open Close
Alexandre Borela
4.97 (37)
如果你象这个项目一样,就有5个饥饿审查。 塔克的后续工作: borelatech 这项指标采用了既定价格的公开、高、低价和关闭价格 可以对特定时间区加以调整。 许多机构和专业人士都认为这些是重要的。 贸易商可以为你了解他们可能更进一步的地点, 积极。 现有期间为: 前一日。 前一星期。 曾任Month。 曾任。 前一年。 或: 目前日。 目前周。 目前 Month。 目前配额。 今年。
FREE
WH DrawFib Pro MT5
Wissam Hussein
5 (4)
您是否厌倦了在图表上手动绘制斐波那契水平?您是否正在寻找一种方便有效的方法来确定交易中的关键支撑位和阻力位?别再犹豫了! 隆重推出 DrawFib Pro,这是一款可自动执行 ibonacci 水平的 终极 MetaTrader 5 指标   在图表上绘制,并在突破这些水平时及时发出警报。借助 DrawFib Pro,您可以增强交易策略、节省时间并做出更明智的决策。 我的基于斐波那契的指标:   Advanced Gartley Pattern MT5   ||    Price Wave Pattern MT5 主要特征: 自动 斐波那契绘图 . 可定制的 参数 . 准确 可靠. 实时 警报. 用户 友好的 界面 . 对于任何寻求高效、可靠且用户友好的方式在图表上自动绘制斐波那契的交易者来说,DrawFib Pro 是必备工具。 DrawFib Pro 能够提供实时警报并支持各种时间范围,使交易者能够做出更准确、更及时的决策。节省宝贵的时间和精力,同时提高您的交易绩效。立即使用 DrawFib Pro 释放自动斐波那契分析的力量!
FREE
HiperCube Renko Candles
Adrian Lara Carrasco
欢迎使用 HiperCube Renko Candles 此指标为您提供真实的市场信息,将其转换为 Renko Candle Style。 定义 Renko 图表是一种金融图表,用于测量和绘制价格变化,使用砖块(或条形)表示价格变动。与传统烛台图不同,Renko 图表不显示基于时间的信息,仅关注价格波动。 特点: 单独窗口中的指标 自定义蜡烛颜色 自定义蜡烛/砖块大小(以点为单位) Chatgpt 和 AI 被用于开发它 Renko 策略示例: 识别趋势 等待回调和使用 Renko 蜡烛吞没 输入您的入场点 SL 吞没的较低点 TP 风险回报 1:2、1:3... 请注意,这是一个示例,可以作为基础或新策略,无论如何在真实账户中尝试和测试它,这些信息仅供您了解如何使用 Renko Candles Hipercube 指标
FREE
Owl Smart Levels MT5
Sergey Ermolov
4.07 (28)
MT4版本  |   FAQ Owl Smart Levels Indicator 是一個完整的交易系統,包含 Bill Williams 的高級分形、構建正確的市場波浪結構的 Valable ZigZag 以及標記準確入場水平的斐波那契水平等流行的市場分析工具 進入市場和地方獲利。 策略的详细说明 指示灯使用说明 顾问-贸易猫头鹰助手助理 私人用户聊天 ->购买后写信给我,我会将您添加到私人聊天中,您可以在那里下载所有奖金 力量在於簡單! Owl Smart Levels 交易系統非常易於使用,因此適合專業人士和剛開始研究市場並為自己選擇交易策略的人。 策略和指標中沒有隱藏的秘密公式和計算方法,所有策略指標都是公開的。 Owl Smart Levels 允許您快速查看進入交易的信號,突出顯示下訂單的水平並向您發送有關已出現信號的通知。 優點很明顯: 清楚地顯示主要和更高時間框架的趨勢方向。 指示儀器信號的出現。 標記開單、止損設置和固定利潤的水平。 沒有多餘的,只有必要的結構! ZigZag 表示全球趨勢的方向,因此也表示貿易方向。 市場反轉點的短線清楚地表明在什麼水平上構建斐波
特殊蜡烛 您想使用其中一个最佳的外汇指标和成功的Ichimoku策略吗?您可以使用基于Ichimoku策略的这个令人惊叹的指标。 MT4版本在这里 。 第一策略: 此策略涉及识别很少出现相似强交叉。 此策略的最佳时间框架为30分钟(30M)和1小时(H1)。 适用于30分钟时间框架的合适符号包括: • CAD/JPY • CHF/JPY • USD/JPY • NZD/JPY • AUD/JPY • EUR/USD • EUR/GBP 对于1小时时间框架,适当的符号包括: • GBP/USD • GBP/NZD • GBP/AUD • USD/CAD • USD/CHF • USD/JPY • EUR/AUD 第二策略: 此策略涉及识别与趋势方向相同的强大Tenkunsen和Kijunsen交叉。 此策略的最佳时间框架为1分钟(1M)至15分钟(15M)。 此策略可应用于大多数货币和符号。 第三策略: 此策略涉及将第一和第二策略组合起来,它们之间有x个蜡烛的距离。您可以从设置中更改X。默认设置为3。 我们提供支持,无论何时出
Countdown Candle Close
Sid Ali Temkit
3 (1)
The Candle Countdown Timer for MetaTrader 4 (also available for MT5) is a vital indicator designed to help you manage your trading time effectively. It keeps you updated about market open and close times by displaying the remaining time before the current candle closes and a new one forms. This powerful tool enables you to make well-informed trading decisions. Key Features: Asia Range: Comes with an option to extend the range. Broker Time, New York, London Time: Displays the current broker time
FREE
DALA Forecast
Grigorii Matsnev
About the indicator: DALA Forecast is a universal tool for predicting the dynamics of time series of any nature. For prediction, modified methods of nonlinear dynamics analysis are used, on the basis of which a predictive model is built using machine learning methods.  To get the trial version of the indicator, you can contact me in private messages. How to use the indicator: Apply the indicator to your chosen financial instrument or indicator with the settings you need. The prediction will b
FREE
Follow The Line MT5
Oliver Gideon Amofa Appiah
4.5 (28)
This indicator obeys the popular maxim that: "THE TREND IS YOUR FRIEND" It paints a GREEN line for BUY and also paints a RED line for SELL. (you can change the colors). It gives alarms and alerts of all kinds. IT DOES NOT REPAINT and can be used for all currency pairs and timeframes. Yes, as easy and simple as that. Even a newbie can use it to make great and reliable trades. NB: For best results, get my other premium indicators for more powerful and reliable signals. Get them here: https://www.m
FREE
Free automatic Fibonacci is an indicator that automatically plots a Fibonacci retracement based on the number of bars you select on the BarsToScan setting in the indicator. The Fibonacci is automatically updated in real time as new highest and lowest values appears amongst the selected bars. You can select which level values to be displayed in the indicator settings. You can also select the color of the levels thus enabling the trader to be able to attach the indicator several times with differe
FREE
该产品的买家也购买
Attention: this is a multicurrency EA, which trades by several pairs from one chart!  Therefore, in order to avoid duplicate trades, it is necessary to attach EA only to one chart, ---> all trading in all pairs is conducted only from one chart! we can trade simultaneously in three different pairs, as by default (EURUSD + GBPUSD + AUDUSD), which take into account the correlation when entering the market for all three; we can trade only EURUSD (or any currency pair) and at the same time take into
Hedge Ninja
Robert Mathias Bernt Larsson
5 (1)
請務必在 www.Robertsfx.com 加入我們的 Discord 社區,您也可以在 robertsfx.com 購買 EA 無論價格向哪個方向移動,都能贏得勝利 無論價格向哪個方向移動,該機器人都會根據價格的移動方向改變方向,從而獲勝。這是迄今為止最自由的交易方式。 因此,無論它向哪個方向移動,您都會贏(當價格移動到屏幕截圖中的任何一條紅線時,它會以您設置的利潤目標獲勝)。 您面臨的唯一風險是價格是否正在整合(停留在一個地方)。 對沖忍者是一種半自動交易工具,您可以使用下面的對沖設置進行設置。當您告訴它進行交易時,購買或出售它,然後為您處理一切。 每次機器人改變方向時,它都會彌補你之前的損失,所以當你到達任何一條紅線時,你的利潤將是你決定的。 一個好的經驗法則是使用相當高的風險來獲得回報,但是你在這個鏈接上知道如何交易這個機器人的交易秘密。你想要的是價格移動,一旦它開始移動,你就直接走向你的利潤資金:) 設置 ADR / 平均點差 ADR 是平均每日範圍,顯示該工具在一天內通常平均移動多少點。很高興知道這一點,因為您不希望該機器人在點差變得更高
Adam FTMO MT5
Vyacheslav Izvarin
5 (2)
ADAM EA Special Version for FTMO Please use ShowInfo= false for backtesting ! Our 1st EA created using ChatGPT technology Trade only GOOD and checked PROP FIRMS  Default parameters for Challenge $100,000 Tested on EURUSD and GBPUSD only  Use 15MIN Time Frame Close all deals and Auto-trading  before Weekend at 12:00 GMT+3  Friday For Prop Firms MUST use special Protector  https://www.mql5.com/en/market/product/94362 -------------------------------------------------------------------------------
Gold Pip Sniper MT5
Muhammed Sharookh Chittethukudiyil
限时优惠: 当前价格 119 美元仅适用于前 5 次购买!之后,价格将上涨至 999 美元。不要错过这个独家机会——在优惠结束前迅速行动! Rich Market Minds Scalper EA:针对新市场趋势的精确剥头皮交易。   Rich Market Minds Scalper EA 经过精心设计,可以快速准确地利用新兴市场趋势。这种自动交易工具旨在识别关键的市场动向,使交易者能够通过执行快速交易来快速获利。凭借先进的算法和实时分析,EA 可以最大限度地降低风险,同时最大限度地提高回报,非常适合希望利用短期市场变化的交易者。无论您是经验丰富的交易者还是刚刚起步,这款 Scalper EA 都能确保在快节奏的交易世界中高效表现。  符号XAUUSD时间范围H1 设置 默认设置 经纪商 我们强烈推荐零点差经纪商 最低存款 $100 手数1% 的资本(低风险)   订单始终受止损保护 一些特点: - 不要使用任何危险的交易方法:无网格、无马丁格尔……只需一笔交易 - 订单始终受止损保护 - 使用默认设置优化 EA - 易于使用 我们推荐以下提供
FiboPlusWaves MT5
Sergey Malysh
5 (1)
FiboPlusWave Series products Ready-made trading system based on Elliott waves and Fibonacci retracement levels . It is simple and affordable. Display of the marking of Elliott waves (main or alternative option) on the chart. Construction of horizontal levels, support and resistance lines, a channel. Superposition of Fibonacci levels on waves 1, 3, 5, A Alert system (on-screen, E-Mail, Push notifications).    Features: without delving into the Elliott wave theory, you can immediately open one of
Mt5BridgeBinary
Leandro Sanchez Marino
我自动其商业策略的使用二进制 MT5 和我们 Mt5BridgeBinary 我发送的命令其二进制账户和我名单: 开始使用这种方式容易! 专家顾问也容易形成、优化和实现抗寒试验; 还在测试中我们可以预测其长期盈利能力,所以我们创造了 Mt5BridgeBinary 连接其最佳战略二进制文件。 特点: 它可以使用很多战略如我所愿。 (专家顾问)。 他不需要额外的程序。 随函附上我方- EA 没有导入的时限。 它可以想象所有的公开行动。 他只需要执行我们 EA 只在一个图形采取所有的订单。 -它不需要复杂的配置,以使我们的就业工作。 输入参数: 电子邮件: 有关其电子邮件帐户的二进制文件。 -标记: 代码访问它生成的二进制来操作。 -数量操作: 该合同价值。 位置警报: 会启用/禁用警报作业时开放。 -小组菲尔斯滕: 它显示所有打开的行动。 注: -期限的合同: 请参阅《资产指数来了解这笔总额中,最小和最大期限的合同。 - Volatile 性质指标不能在德国、法国、西班牙、新加坡、澳大利亚、意大利和卢森堡。
Xrade EA
Yao Maxime Kayi
Xrade EA is an expert advisor as technical indicator. For short period trade it's the best for next previsions of the trend of the market. +--------------------------------------------------------------------------------------- Very Important Our robot(data anylizer) does'nt take a trade procedure. If using only our robot you must take positions by yoursels +--------------------------------------------------------------------------------------- The technical indiator provide for a give
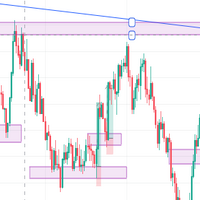
Technical confluence zones is a very popular tool for traders. This EA detects such zones by studying chart patterns, naked price levels, fib levels, SMA/EMA over multiple timeframes and more. The source data is loaded from Mytradingpet.com. To find out what are factored in when determining such zones, visit https://mytradingpet.com - a free service for all traders. The zones are color coded. Purple indicates the highest level of confluence.
PROMOTION!! $499 until 1 Mar. After that, EA will be $1,050 Developed and tested for over 3 years, this is one of the safest EAs on the planet for trading the New York Open. Trading could never be easier.  Trade On NASDAQ US30 (Dow Jones Industrial Average) S&P 500  What Does The EA do? The EA will open a Buy Stop Order and a Sell Stop Order(With SL and TP) on either side of the market just a few seconds before the NY Open.  As soon as 1 of the 2 trades is triggered, the EA automatically delete
Saving data from the order book. Data replay utility: https://www.mql5.com/en/market/product/71640 Library for use in the strategy tester: https://www.mql5.com/en/market/product/81409 Perhaps, then a library will appear for using the saved data in the strategy tester, depending on the interest in this development. Now there are developments of this kind using shared memory, when only one copy of the data is in RAM. This not only solves the memory issue, but gives faster initialization on each
Gold instrument scanner is the chart pattern scanner to detect the triangle pattern, falling wedge pattern, rising wedge pattern, channel pattern and so on. Gold instrument scanner uses highly sophisticated pattern detection algorithm. However, we have designed it in the easy to use and intuitive manner. Advanced Price Pattern Scanner will show all the patterns in your chart in the most efficient format for your trading. You do not have to do tedious manual pattern detection any more. Plus you
Gold Wire Trader MT5 trades using the RSI Indicator. It offers many customizable RSI trading scenarios and flexible position management settings, plus many useful features like customizable trading sessions, a martingale and inverse martingale mode. The EA implements the following entry strategies, that can be enabled or disabled at will: Trade when the RSI Indicator is oversold or overbought Trade when the RSI comes back from an oversold or overbought condition Four different trading behav
Gold trend indicator MT5 This is a multi-timeframe indicator that detects and plots supports and resistance lines in the chart with the same precision as a human eye would. As price levels are tested over time and its importance increases, the lines become thicker and darker, making price leves easy to glance and evaluate. Boost your technical analysis Customizable timeframe selection Read price levels from the timeframe of your choosing Detect important price levels without browsing through
Gold trend scanner MT5 a multi symbol multi timeframe dashboard that monitors and analyzes Average True Range indicator value in up to 28 symbols and 9 timeframes  in 3 modes :  It shows the ATR indicator value in all pairs and timeframes and signals when the ATR value reaches a maximum or minimum in a given duration. Short term ATR/Long term ATR ratio: It shows ratio of 2 ATRs with different periods. It's useful in detecting short term volatility and explosive moves. ATR Value/Spread ratio:
A triangular arbitrage strategy exploits inefficiencies between three related currency pairs, placing offsetting transactions which cancel each other for a net profit when the inefficiency is resolved. A deal involves three trades, exchanging the initial currency for a second, the second currency for a third, and the third currency for the initial. With the third trade, the arbitrageur locks in a zero-risk profit from the discrepancy that exists when the market cross exchange rate is not aligned
Gold index expert MT5 Wizard uses Multi-timeframe analysis. In simpler terms, the indicator monitors 2 timeframes. A higher timeframe and a lower timeframe. The indicator determines the trend by analyzing order flow and structure on the higher timeframe(4 hour for instance). Once the trend and order flow have been determined the indicator then uses previous market structure and price action to accurately determine high probability reversal zones. Once the high probability reversal zone has be
Golden Route home MT5 calculates the average prices of BUY (LONG) and SELL (SHORT) open positions, taking into account the size of open positions, commissions and swaps. The indicator builds the average line of LONG open positions, after crossing which, from the bottom up, the total profit for all LONG positions for the current instrument becomes greater than 0. The indicator builds the average line of SHORT open positions, after crossing which, from top to bottom, the total profit for all
Do you want an EA with small stoploss? Do you want an EA that is just in and out of market? Gold looks at several MT5 It is ONLY buying when the market opens and with a window of 10 minutes or less. It uses pre-market price so be sure your broker has that.   This strategies (yes, it is 2 different strategies that can be used with 3 different charts) have tight stoplosses and a takeprofit that often will be reached within seconds! The strategies are well proven. I have used them manually
一款实时显示点差的工具.非常好用. 是日常看价格的好帮手. 一款实时显示点差的工具.非常好用. 是日常看价格的好帮手. 一款实时显示点差的工具.非常好用. 是日常看价格的好帮手.   一款实时显示点差的工具.非常好用. 是日常看价格的好帮手. 一款实时显示点差的工具.非常好用. 是日常看价格的好帮手. 一款实时显示点差的工具.非常好用. 是日常看价格的好帮手. 一款实时显示点差的工具.非常好用. 是日常看价格的好帮手. 一款实时显示点差的工具.非常好用. 是日常看价格的好帮手. 一款实时显示点差的工具.非常好用. 是日常看价格的好帮手. 一款实时显示点差的工具.非常好用. 是日常看价格的好帮手. 一款实时显示点差的工具.非常好用. 是日常看价格的好帮手.
Key levels are psychological price levels on the forex chart where many traders base their technical analyses on. These traders are likely to place their bullish or bearish entries, and exit points around these levels. And as a result, key levels tend to be crowded with a high trading volume. Key levels also attract so much trading volume because that is where institutional traders make their trades as well. And thanks to their big-money moves, key levels are often resilient and lasting. How
# 如果您有任何其他需求或對合作感興趣,請聯繫 zion.quantech.london@gmail.com。 Flash Trade (FT) 最友善的手動交易工具。 使用最直觀的操作來確保您的資金。 FT的特點 點擊任意位置快速交易 FT支持市場訂單和掛單 兩次點擊完成訂單並設置SL和TP 三次點擊完成掛單並設置SL和TP 自動將每個訂單的止損金額設置為您設置的餘額百分比或固定金額 下訂單時實時預估利潤 超簡單的界面和操作 支持拆分訂單 使用方式 市場訂單: 點擊圖表決定止損價位 點擊Buy或是Sell鈕 掛單: 點擊圖表決定入場價位 選擇掛單類型 點擊圖表決定止損價位 暫停FT: 點擊右上方的"On/Off"按鈕來切換開關 當按鈕從綠(On)變為紅(Off),代表FT已被停止 點擊"Off"按鈕再次開啟FT 如果有任何疑問、改善建議或是bug回報都可以聯繫e50310@gmail.com或留下評論 功能將持續於未來的版本推出
Отличный помощник для тех кто грамотно распоряжается своими рисками. Данный помощник просто не заменим если у вас всегда должен быть фиксированный риск на сделку. Помогает автоматически высчитывать лот в зависимости от вашего риска. Теперь можно не беспокоиться о том каким будет ваш Stoploss, риск всегда будет одинаковый. Считает объем сделок как для рыночных ордеров так и для отложенных. Удобный и интуитивно понятный интерфейс, так же есть некоторые дополнительные функции для упрощения вашей то
FTMO Sniper 7
Vyacheslav Izvarin
Dedicated for FTMO and other Prop Firms Challenges 2020-2024 Trade only GOOD and checked PROP FIRMS  Default parameters for Challenge $100,000 Best results on GOLD and US100  Use any Time Frame Close all deals and Auto-trading  before  US HIGH NEWS, reopen 2 minutes after Close all deals and Auto-trading  before Weekend at 12:00 GMT+3  Friday Recommended time to trade 09:00-21:00 GMT+3 For Prop Firms MUST use special  Protector  https://www.mql5.com/en/market/product/94362 ------------------
Introducing TEAB Builder - The Ultimate MT5 Expert Advisor for Profoundly Profitable and Customizable Trading!     Are you ready to take your trading to the next level? Meet TEAB Builder, an advanced MT5 Expert Advisor designed to provide unparalleled flexibility, high-profit potential, and an array of powerful features to enhance your trading experience. With TEAB Builder, you can effortlessly trade with any indicator signal, allowing you to capitalize on a wide range of trading strategies.  
The Wall Street Player (Master version). This EA tailored as a Discipline, Money and Risk Management tool is a powerful Trade Station utility designed for Forex, Cryptos, Commodities, Shares, Deriv synthetic pairs and any CFDs Market. It is designed to fit your strategy as a winner, and take your Edge of the market to the NEXT-LEVEL. The only thing to do is to get It on your chart and appreciate the possibilities and chart management abilities it has to offer for realizing that discipline and a
Cheers, traders! In today's video, dive into the world of advanced trading with our exclusive Trade Panel. This Cyber Monday, we're offering a special deal – get access for only $27 instead of the usual $60! In this tutorial, we explore a semi-automated trading system that empowers manual traders to seize opportunities effectively. Watch as we demonstrate using real market scenarios, showing you how to set up trades, manage risk, and maximize profits. Key Features of the Trade P
The Wall Street Player (Ultimatum version). This EA tailored as a Discipline, Money and Risk Management tool is a powerful Trade Station utility designed for Forex, Cryptos, Commodities, Shares, Deriv synthetic pairs and any CFDs Market. It is designed to fit your strategy as a winner, and take your Edge of the market to the NEXT-LEVEL. The only thing to do is to get It on your chart and appreciate the possibilities and chart management abilities it has to offer for realizing that discipline and
发现新的波段交易策略 - 适用于AUDUSD.s等货币对 策略亮点 : 专门设计的趋势指示图像 :我们的策略提供了一个独特的图形界面,帮助交易者识别和利用市场波动。 回测验证 :鼓励交易者对AUDUSD.s等货币对进行回测,验证我们策略的有效性。 灵活的时间框架 :默认推荐在15分钟(M15)时间框架下交易,但我们也提供定制服务,以满足特殊需求。 风险控制 :对于大额交易者,我们提供个性化的风险管理咨询,确保您的资金安全。 为什么选择我们的波段交易策略? 超过200次的成功回测案例。 易于理解和应用,适合不同水平的交易者。 提供实时支持和策略调整建议。 立即体验我们的波段交易策略 ,并探索其潜力!如有特殊需求或疑问,欢迎随时联系我们进行讨论和数据定制。
Sabira Reactive
Gounteni Dambe Tchimbiandja
IMPORTANT NOTE THIS EA IS NOT FULLY AUTOMATED, IT ONLY TAKES POSITIONS IN ZONES YOU DEFINE IT ASSISTS YOU. SO YOU NEED TO WATCH THE CHART CLOSELY THE MAIN POINT OF THIS EA IS TO FORCE THE TRADER TO RESPECT ENTRY RULES <<CONFIRMATION IS THE KEY>>. SO THE TRADER WILL ONLY LOOK FOR ZONES THE EA WILL LOOK FOR CONFIRMATION CANDLES AND ENTER IF A CONFIRMATION IS FOUND FOR EXAMPLE: If price is in a Bullish zone. Rule, look for buys. If Bullish Candlestick Pattern  or any other bullish candle pattern s
作者的更多信息
Export Intraday Data
Diego Andres Unigarro Andrade
S ystem that allows traders to bulk download closing prices for many listed instruments. Generally, access to this type of information is only possible through financial APIs, which are often very expensive to license. The trader can download his own databases directly from his MT5 terminal, which can then be used as input for quantitative trading models. Input parameters 1. Comma-separated symbols:   the trader must enter the ticker symbol of the instruments, each of them separated by a comm
FREE
筛选:
无评论
回复评论