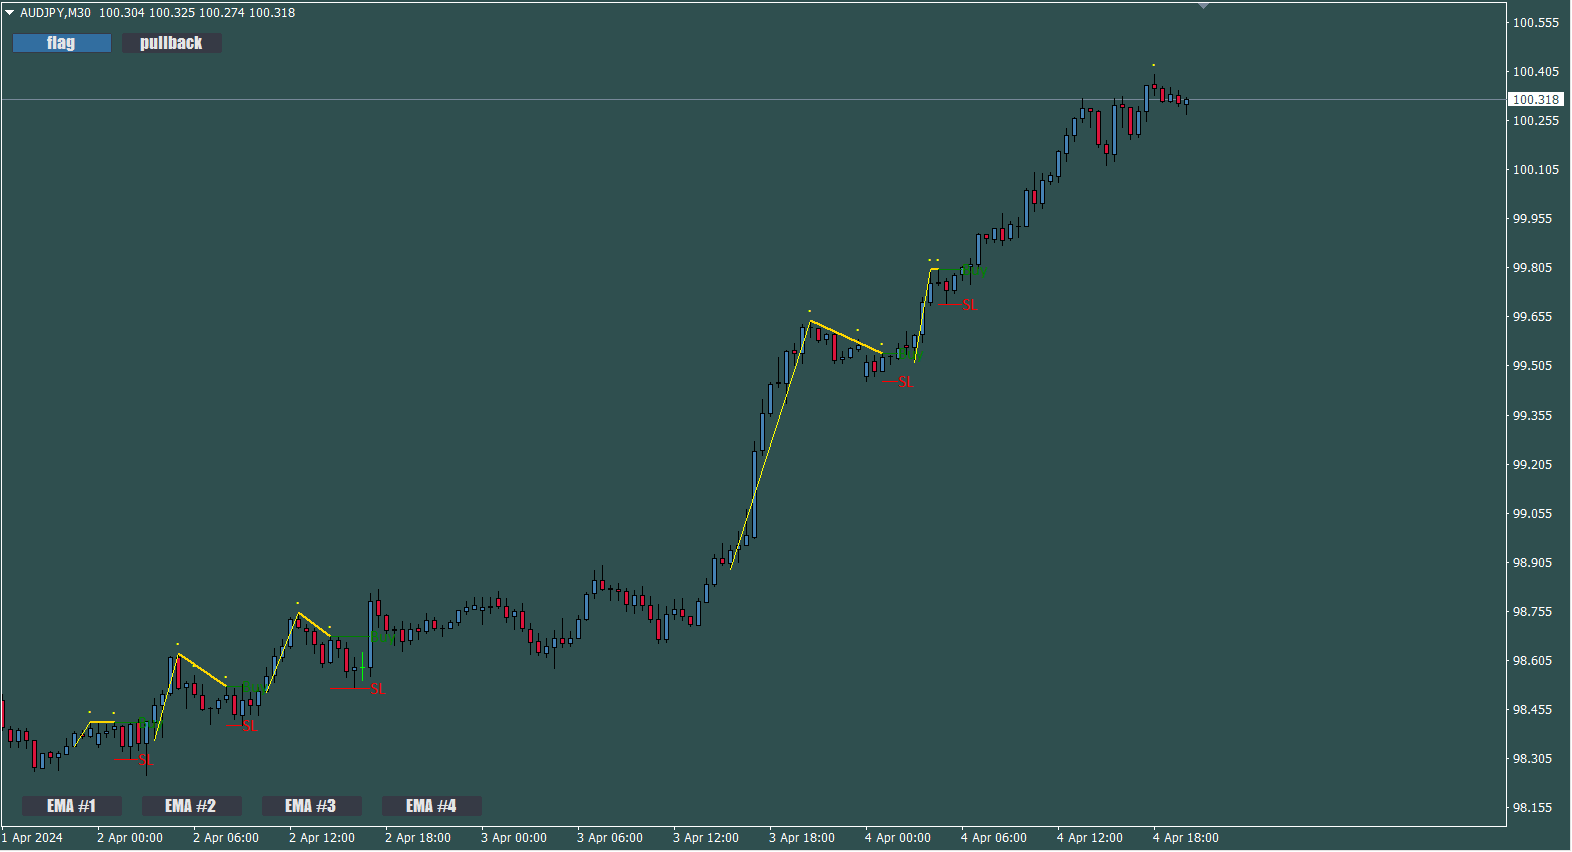
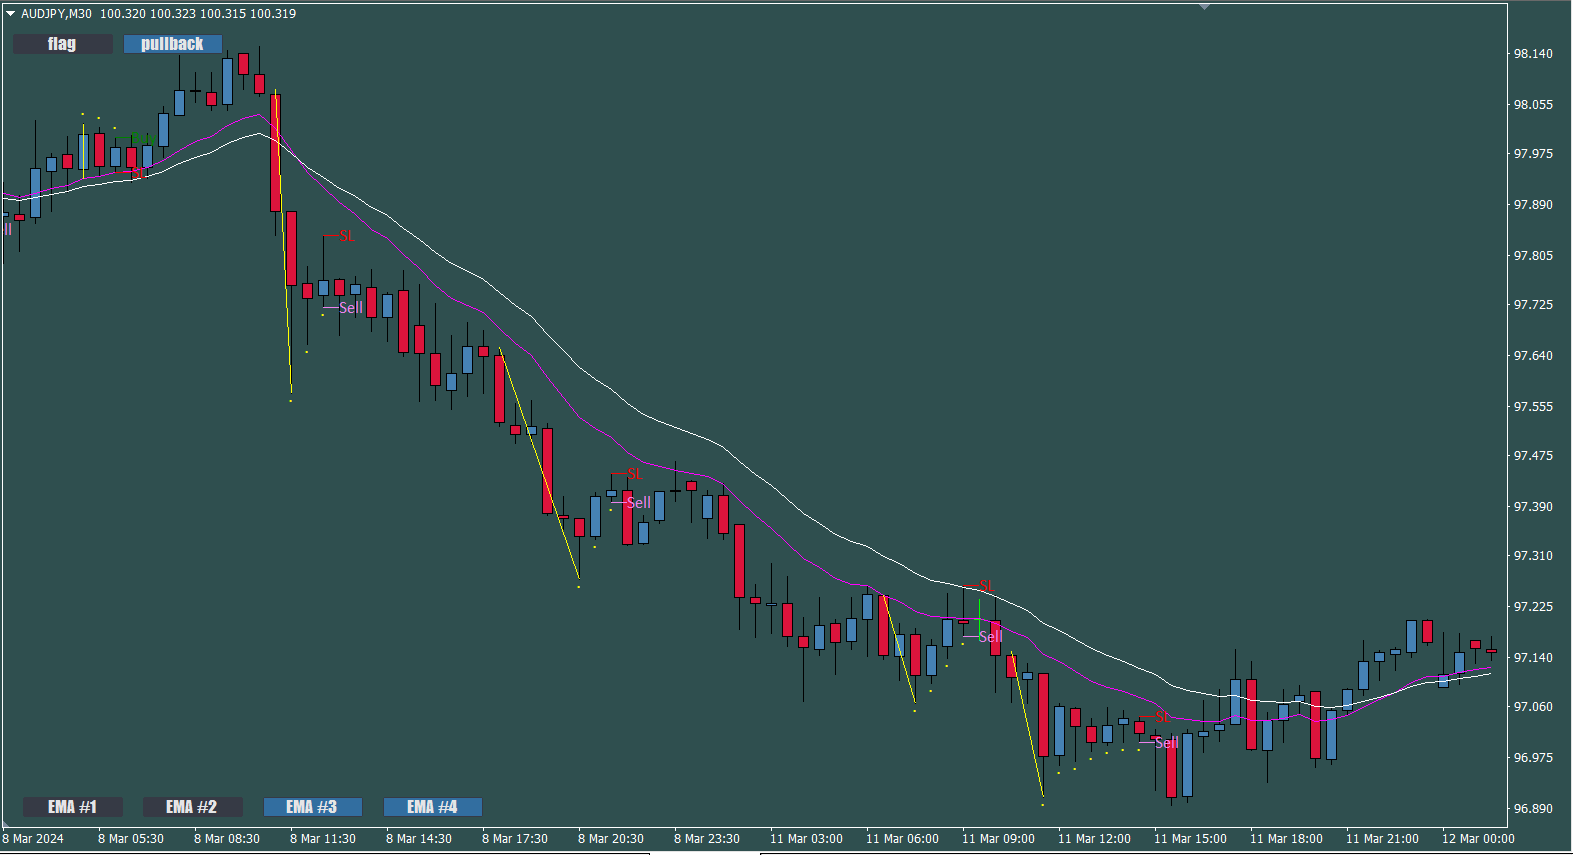
Key level flag pattern
- 指标
- Presley Annais Tatenda Meck
- 版本: 1.0
- 激活: 10
The Key level flag pattern is one of it's kind when it comes to flag patterns on the Metatrader platform.
It is perfect for entering pullbacks in a trend, retests on certain structure or price action, or when you are just looking for a confirmation entry on a zone or odrerblock. It's works on all markets, whether it's forex, crypto currency, stocks or futures.
In it's algorithm it incorporates an:
1. Impulsive move (leg/pole) = this is the high momentum move which creates the leg/pole of the pattern.
2. Correction (flag) = this is the phase were momentum is lost and price consolidates, building up orders.
3. Break out = this is the move we try and cash out on and profit from as it continues with the trend.
Advantages
- 2 in 1 indicator: the Key level flag pattern encorparates 2 different indicators in itself, the first indicator is the Flag pattern, which draws the Flag pattern accurately according to the theoretical rules. The second indicator encoded is the Pullback which is practically like owning a 3-line-strike candle pattern indicator, but with options to customize.
- Clear Entry and Stoploss lines: Unlike other indicators where you get an alert when the move has started, the Key level flag pattern gives an alert before the breakout move, and shows you the optimum place to put a Buy/Sell line and the Stoploss, giving you time to prepare to catch the move early and maximize.
- Trend filter: the Key level flag pattern has an EMA filter, when turned on it will only show Flag/pull back patterns which form above the selected EMA. Perfect for Scalpers who have a strategy to scalp price pullbacks on a strong trend.
- Buys only/Sells only: the Key level flag pattern has the option to make the indicator show and alert you"Buys" only or "Sells" only. This feature is helpful when you are only looking for setups in a specific direction and don't want to be disturbed by other alerts in the opposite direction. You can also choose the option to get alerts on both directions.
- On/Off buttons: the Key level flag pattern has buttons to press if you want to see pull back patterns only, or flag patterns only, or both on the same chart. And if you want to remove all the patterns for a clean chart you just press the buttons twice. It also has EMA filter buttons, if you want to see patterns which only form above the selected EMA trend.
- Non-Repaint: Once the Key level flag pattern draws a pattern on the chart, and price crosses the buy/sell line, that pattern will remain on the chart and WILL NOT repaint. Giving you the option to look back on past patterns to see which ones played well under what conditions.
Recommendation: to filter out the bad signals, it's best to take flag/pullback signals as a confirmation entry of an existing strategy. Please watch the video below to see other ways it was used.
- For best results take the first flag pattern soon after a liquidity grab, this ensures you catch the beginning of a trend early and prevents you from entering at the end of trend. The Key level liquidity grab can be found here.
- Another way to prevent entering at the end of a trend is to take the first flag/pullback pattern soon after price has hit a higher time frame order block/support and resistance/supply and demand. The order blocks to help with that can be found here and here . Watch the videos and screenshots below for more ways to use the Key level flag pattern.