AlphaWave
- 指标
- Simon Draxler
- 版本: 1.46
- 更新: 20 八月 2024
- 激活: 10
解锁您交易的潜力,使用AlphaWave指标! 为您的交易带来平静: AlphaWave指标旨在通过平滑图表并提供精确的趋势方向可读性来使您的交易更加平静。以前从未如此轻松地做出明确的交易决策。
具有10种模式的革命性平滑技术:
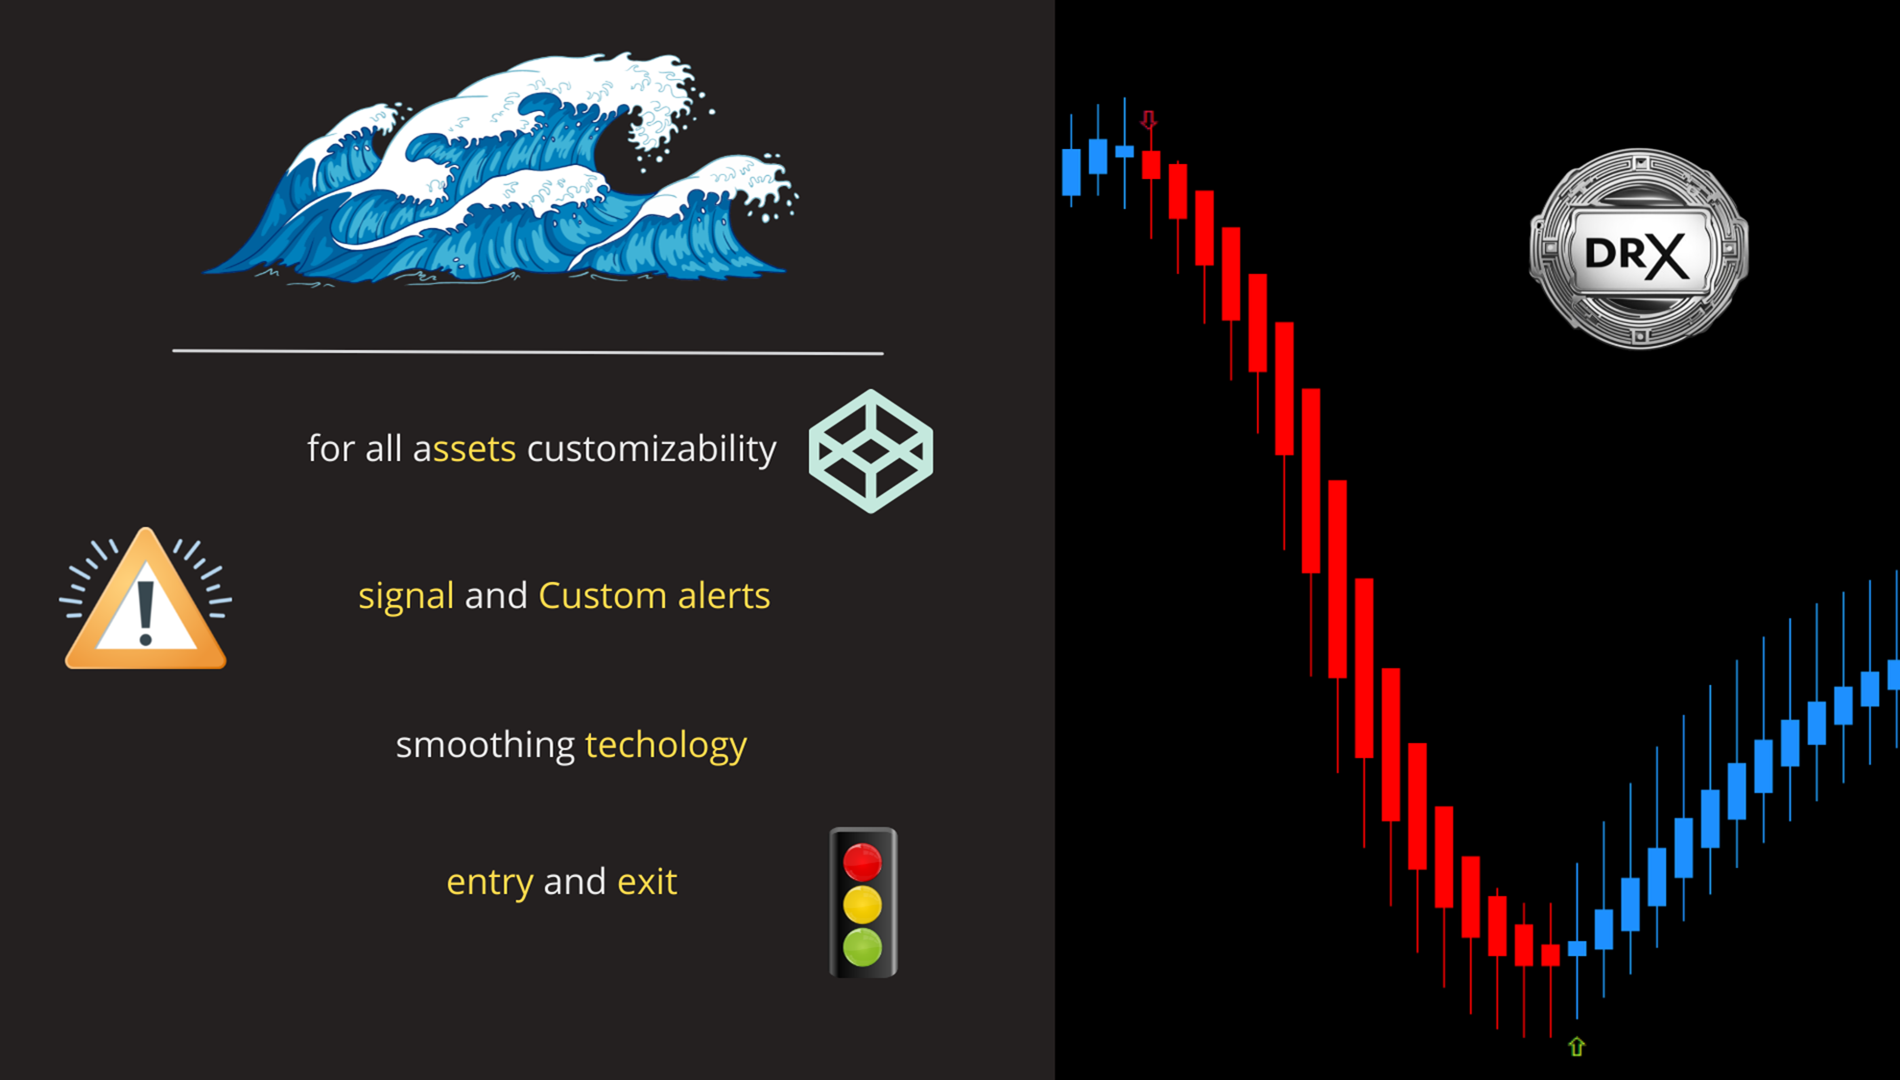
通过AlphaWave指标体验平滑而清晰的图表表示。这种革命性的平滑技术不仅提供了一种模式,而且一共有10种模式,将您的交易体验提升到一个新水平。选择最适合您交易风格的模式。 适用于任何资产的可定制性:
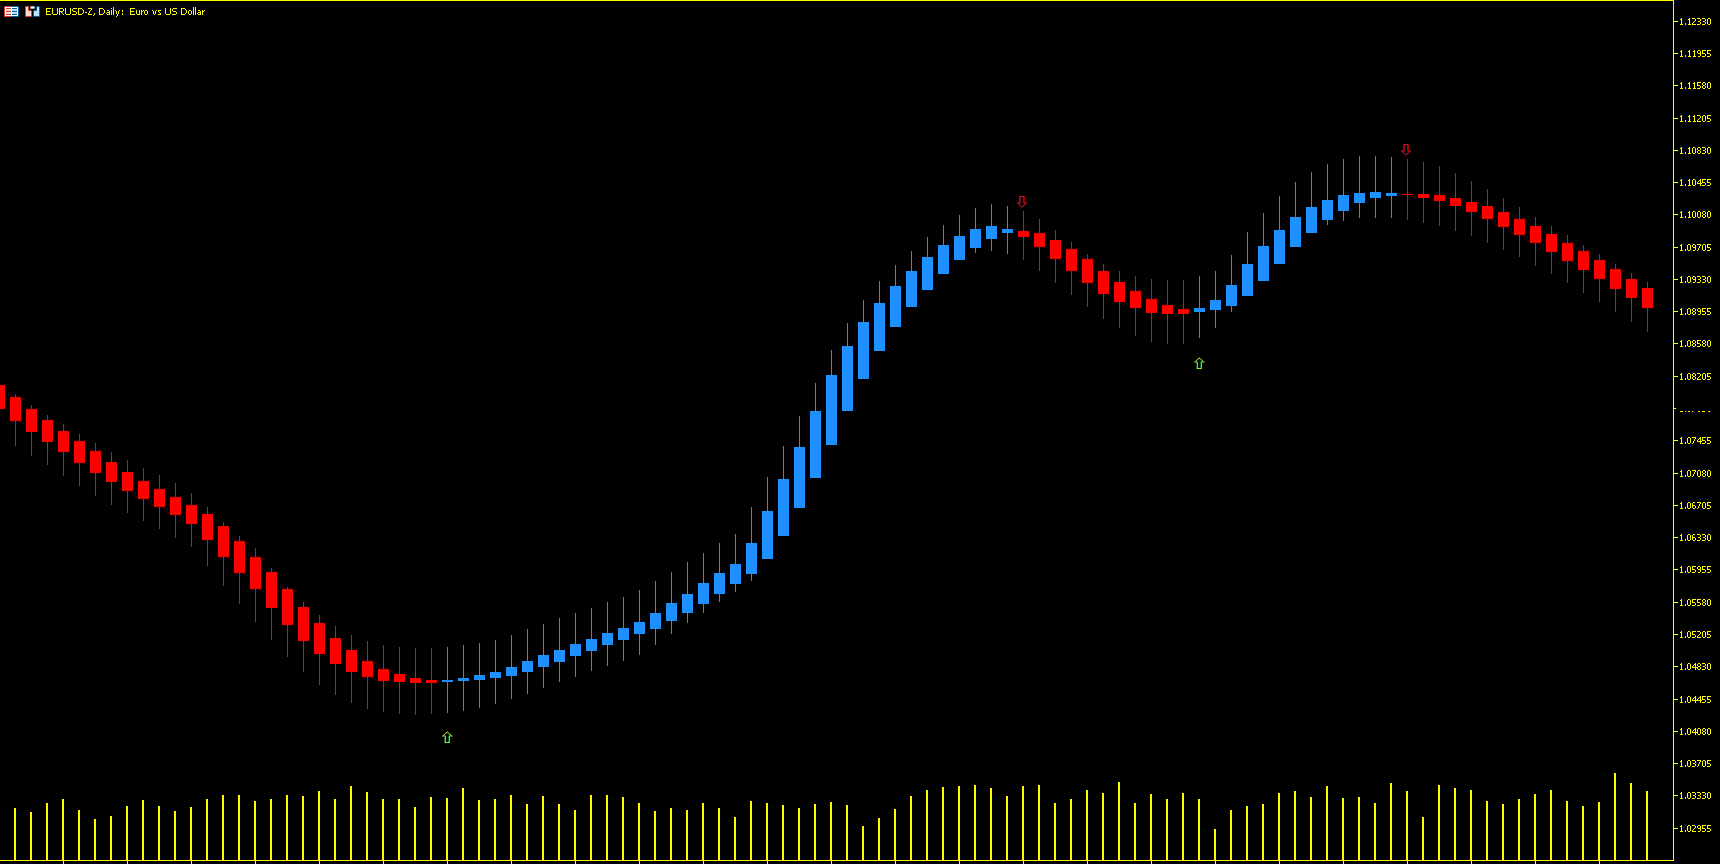
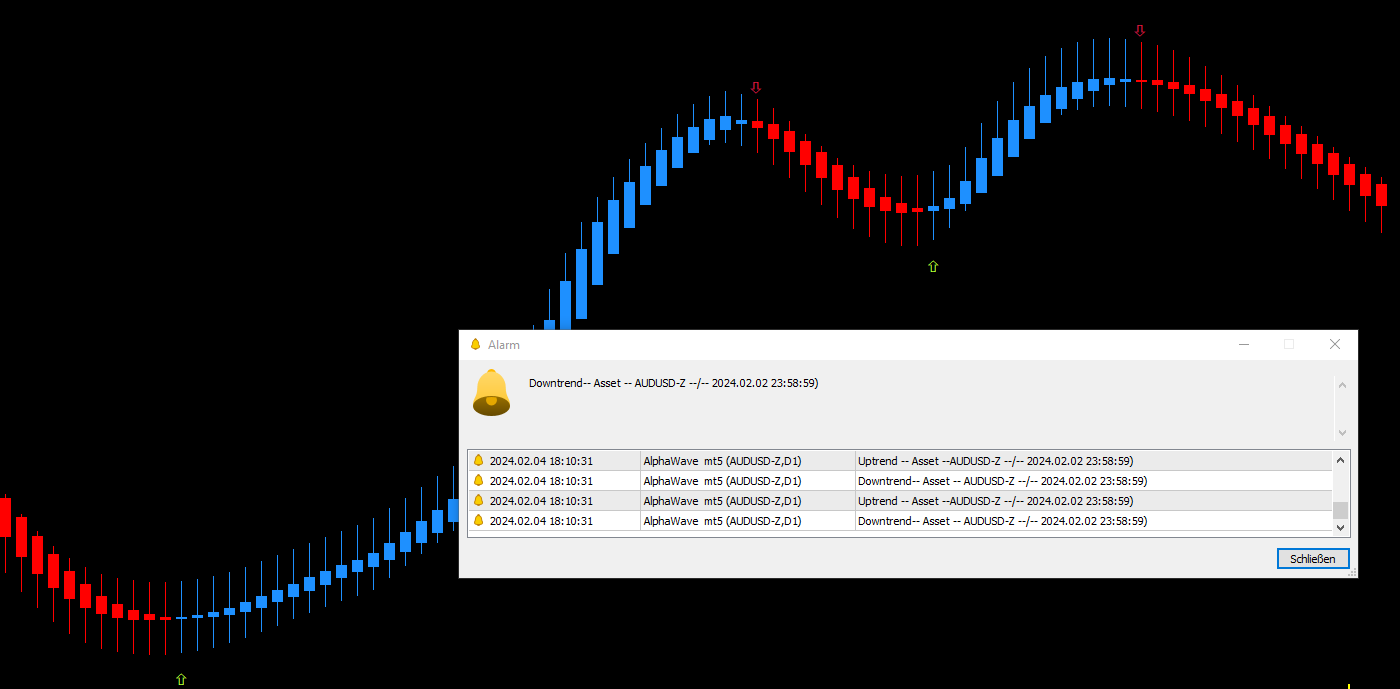
AlphaWave指标最佳地适应每种资产,允许多方面应用,并支持您在不同市场中。在每个交易工具上释放潜力。 上涨和下跌趋势的定制警报:
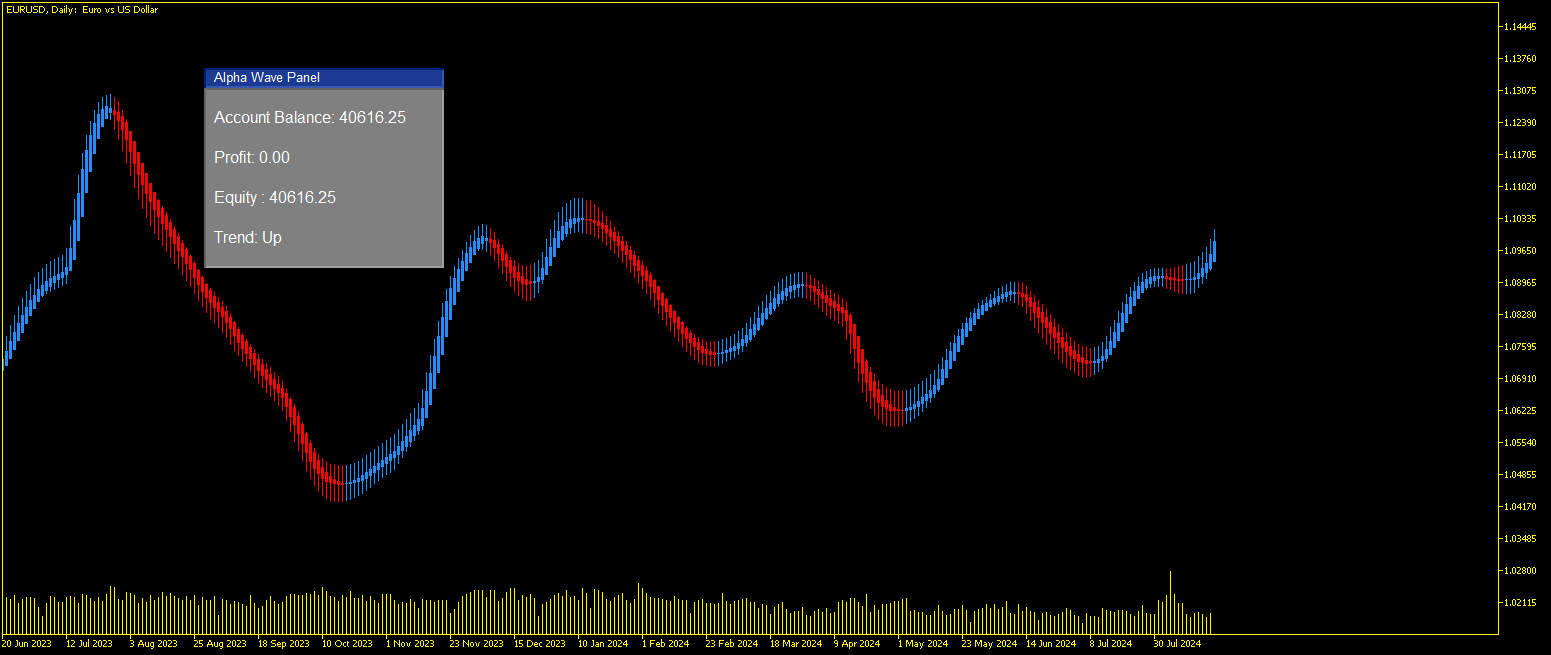
享受额外的重要功能!AlphaWave指标为上涨和下跌趋势提供定制警报。再也不要错过关键的交易时刻,放心交易。 创新的Heiken-Ashi启发:
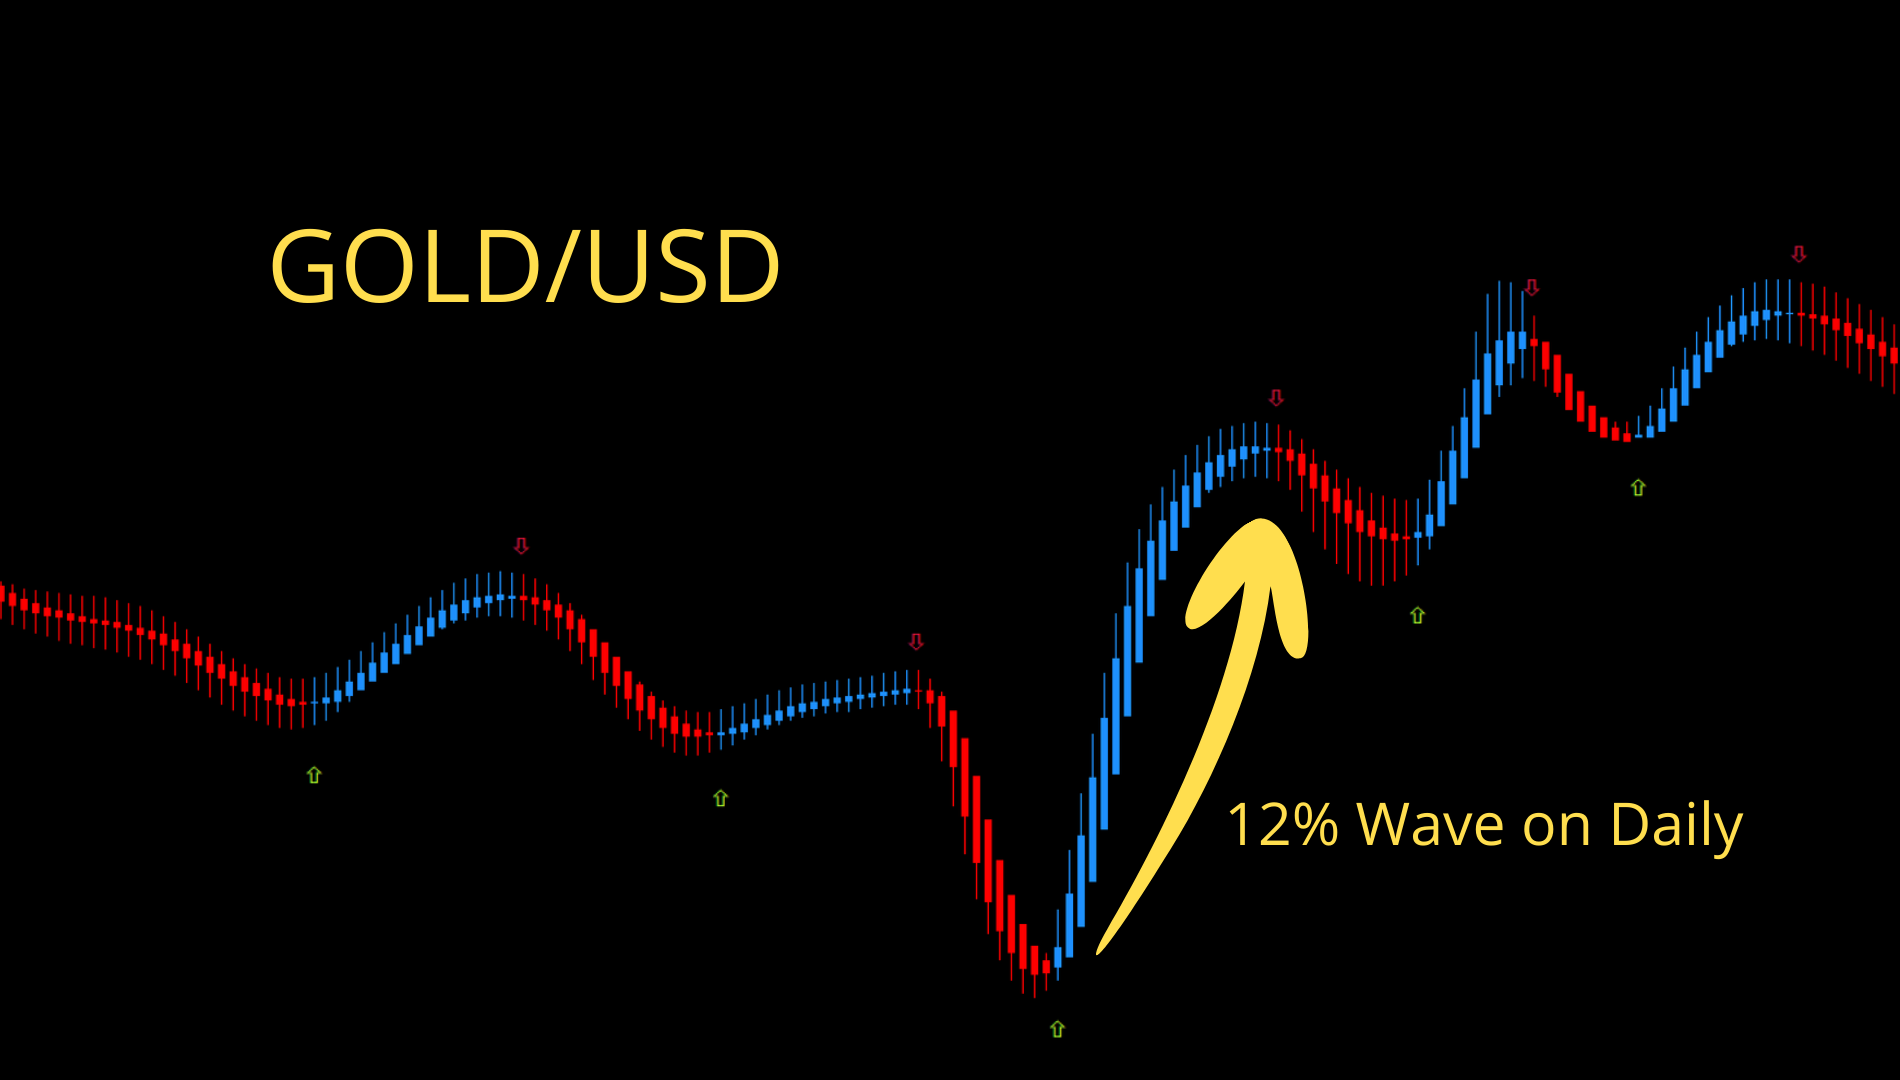
受到Heiken-Ashi蜡烛的启发,AlphaWave指标采用创新的公式。传统的蜡烛数据被转换成清晰显示趋势方向的彩色条。这是您交易中的技术突破! 精准的进出点:
由于可靠的信号和精准的趋势指标,AlphaWave指标允许识别最佳的进出点。 持续的支持和更新:
我们不仅提供出色的软件,还提供持续的支持。如果您有任何问题,我们随时为您提供帮助。 立即选择AlphaWave指标,体验交易的新境界。
建议在较高时间框架中使用。
为了最佳使用,您可以下载模板文件或通过电子邮件接收。
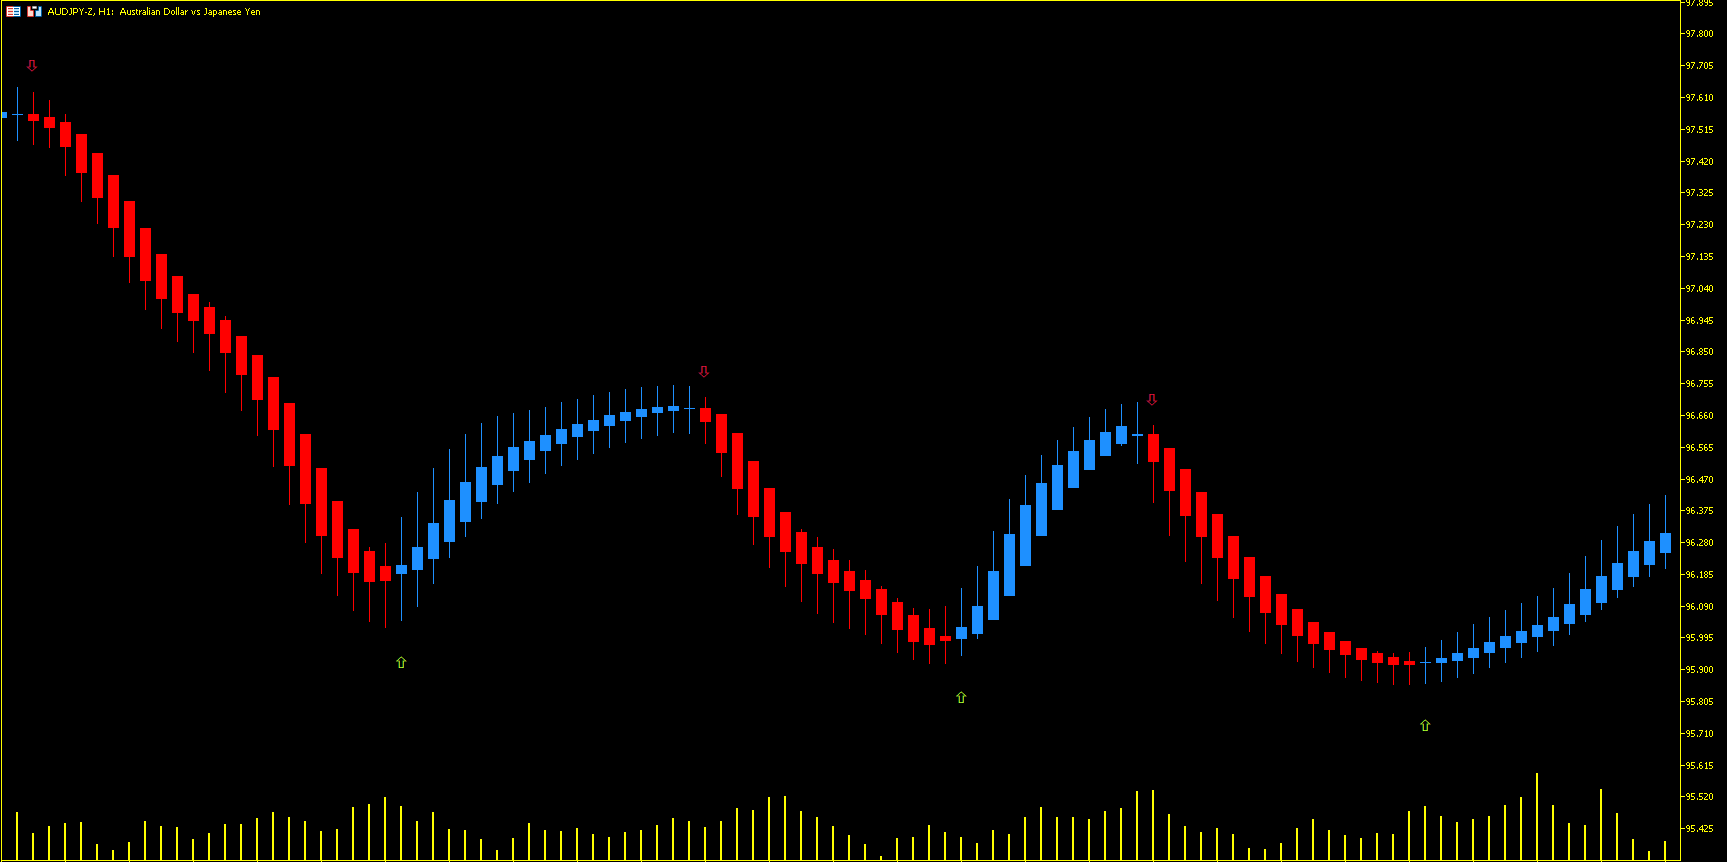

Dieser Indikator hat mich sehr beeindruckt. Sehr gute Arbeit, Signale im D1 kommen punktgenau.