Follow the trends
- 指标
- Shengzu Zhong
- 版本: 1.1
- 激活: 10
价格将在每售出5份副本后上涨30美元。
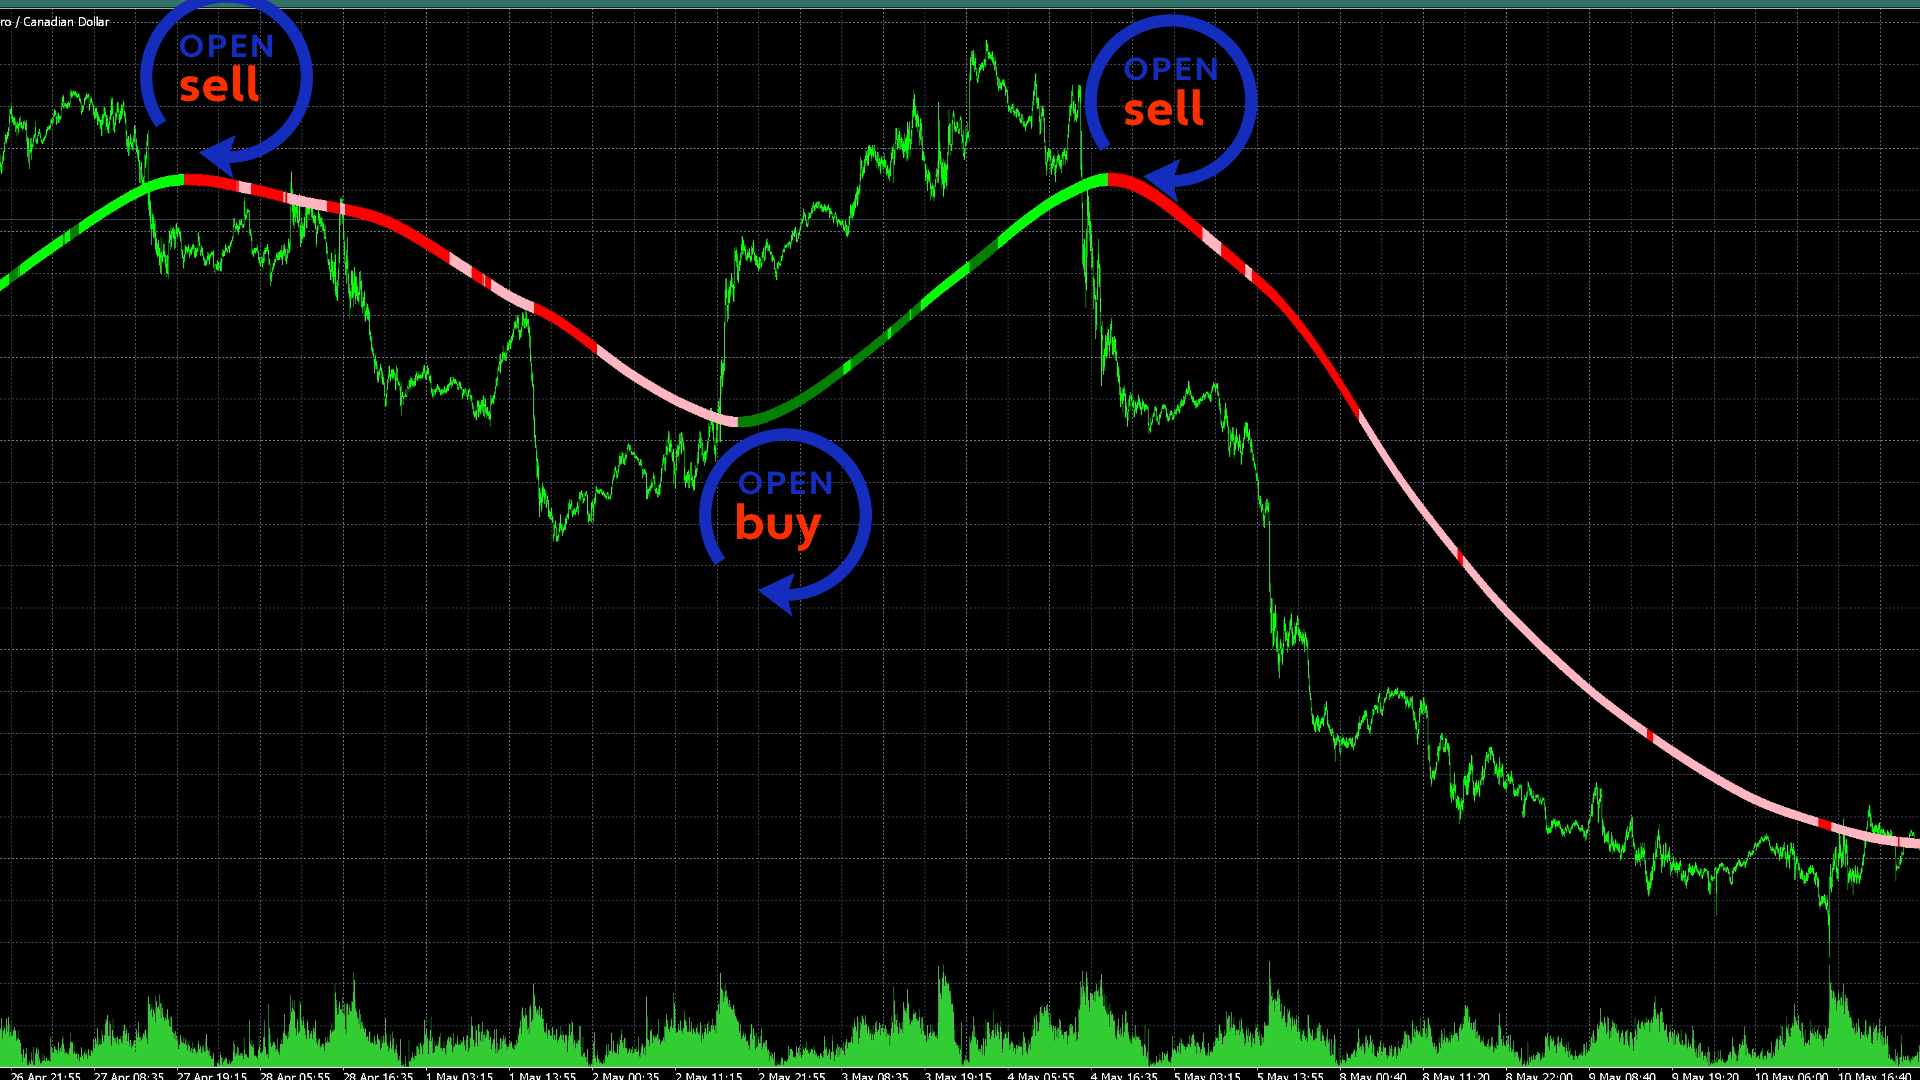
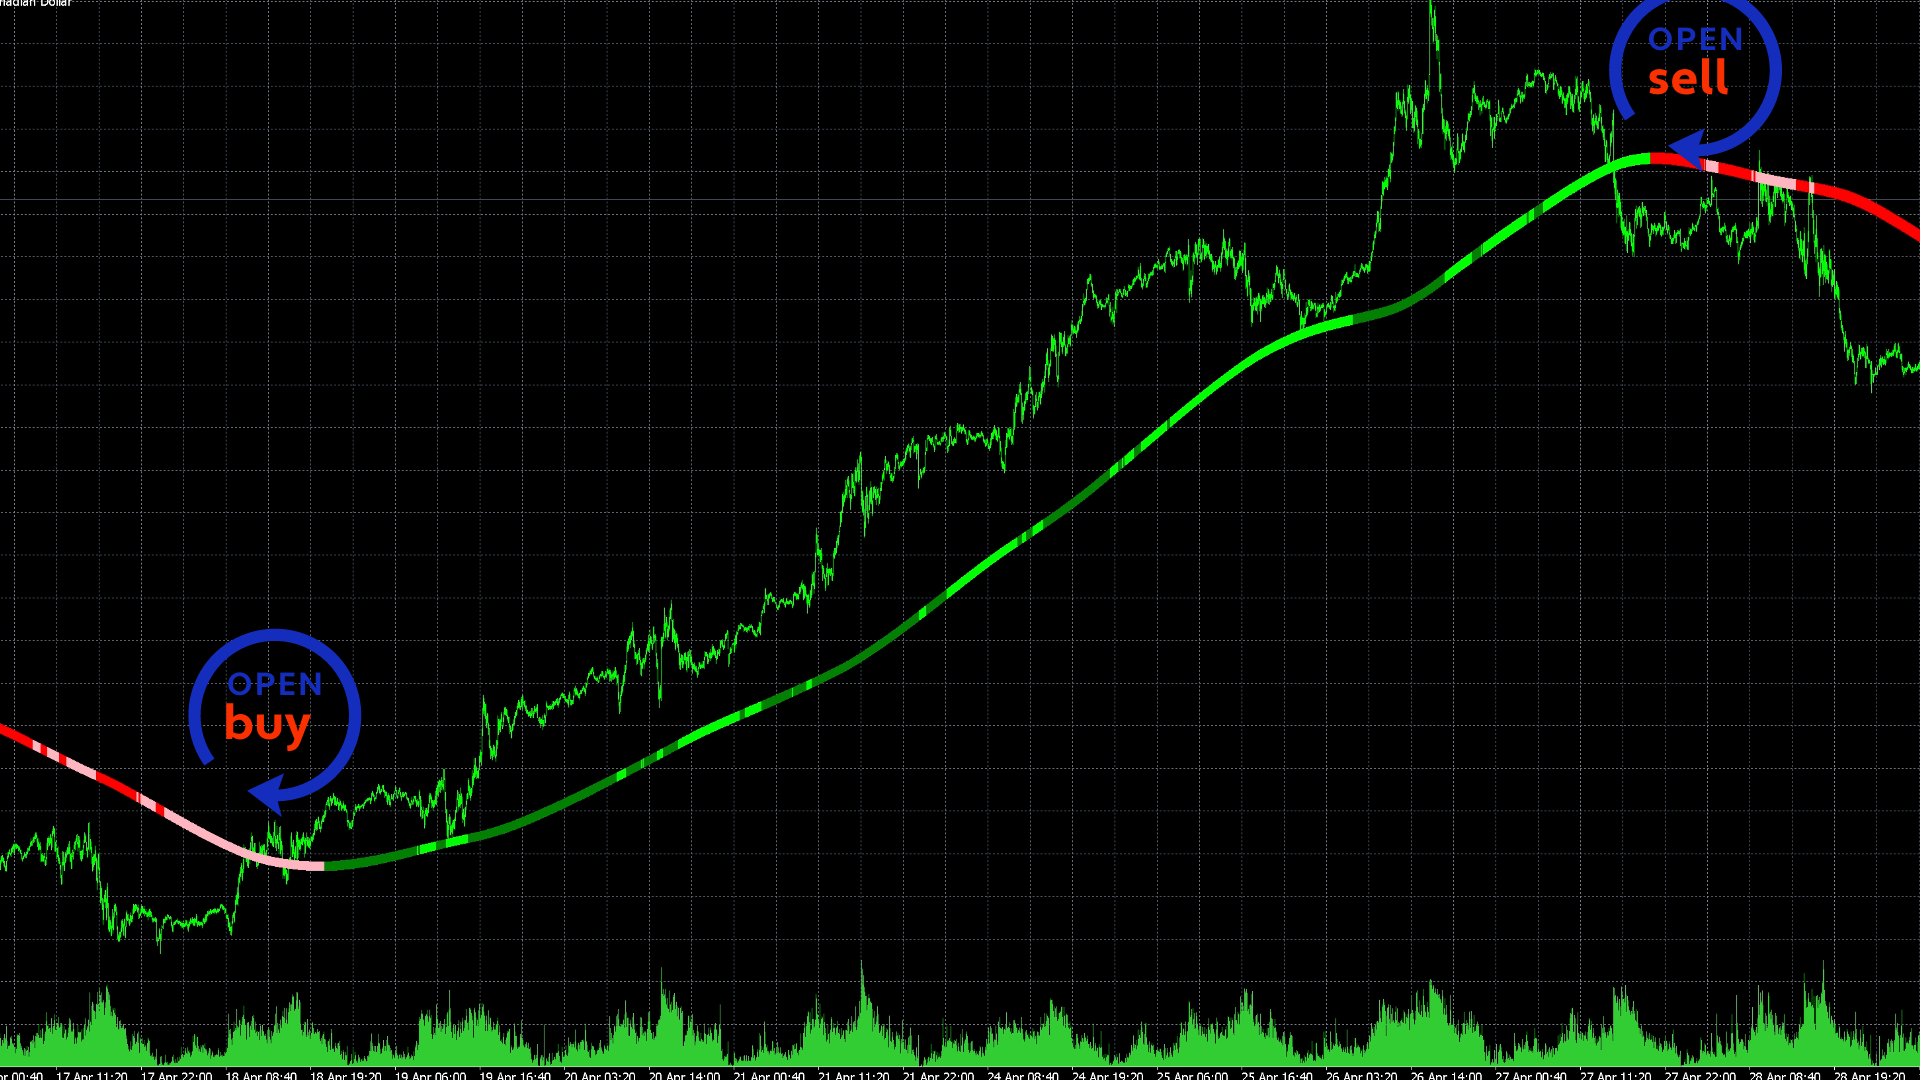
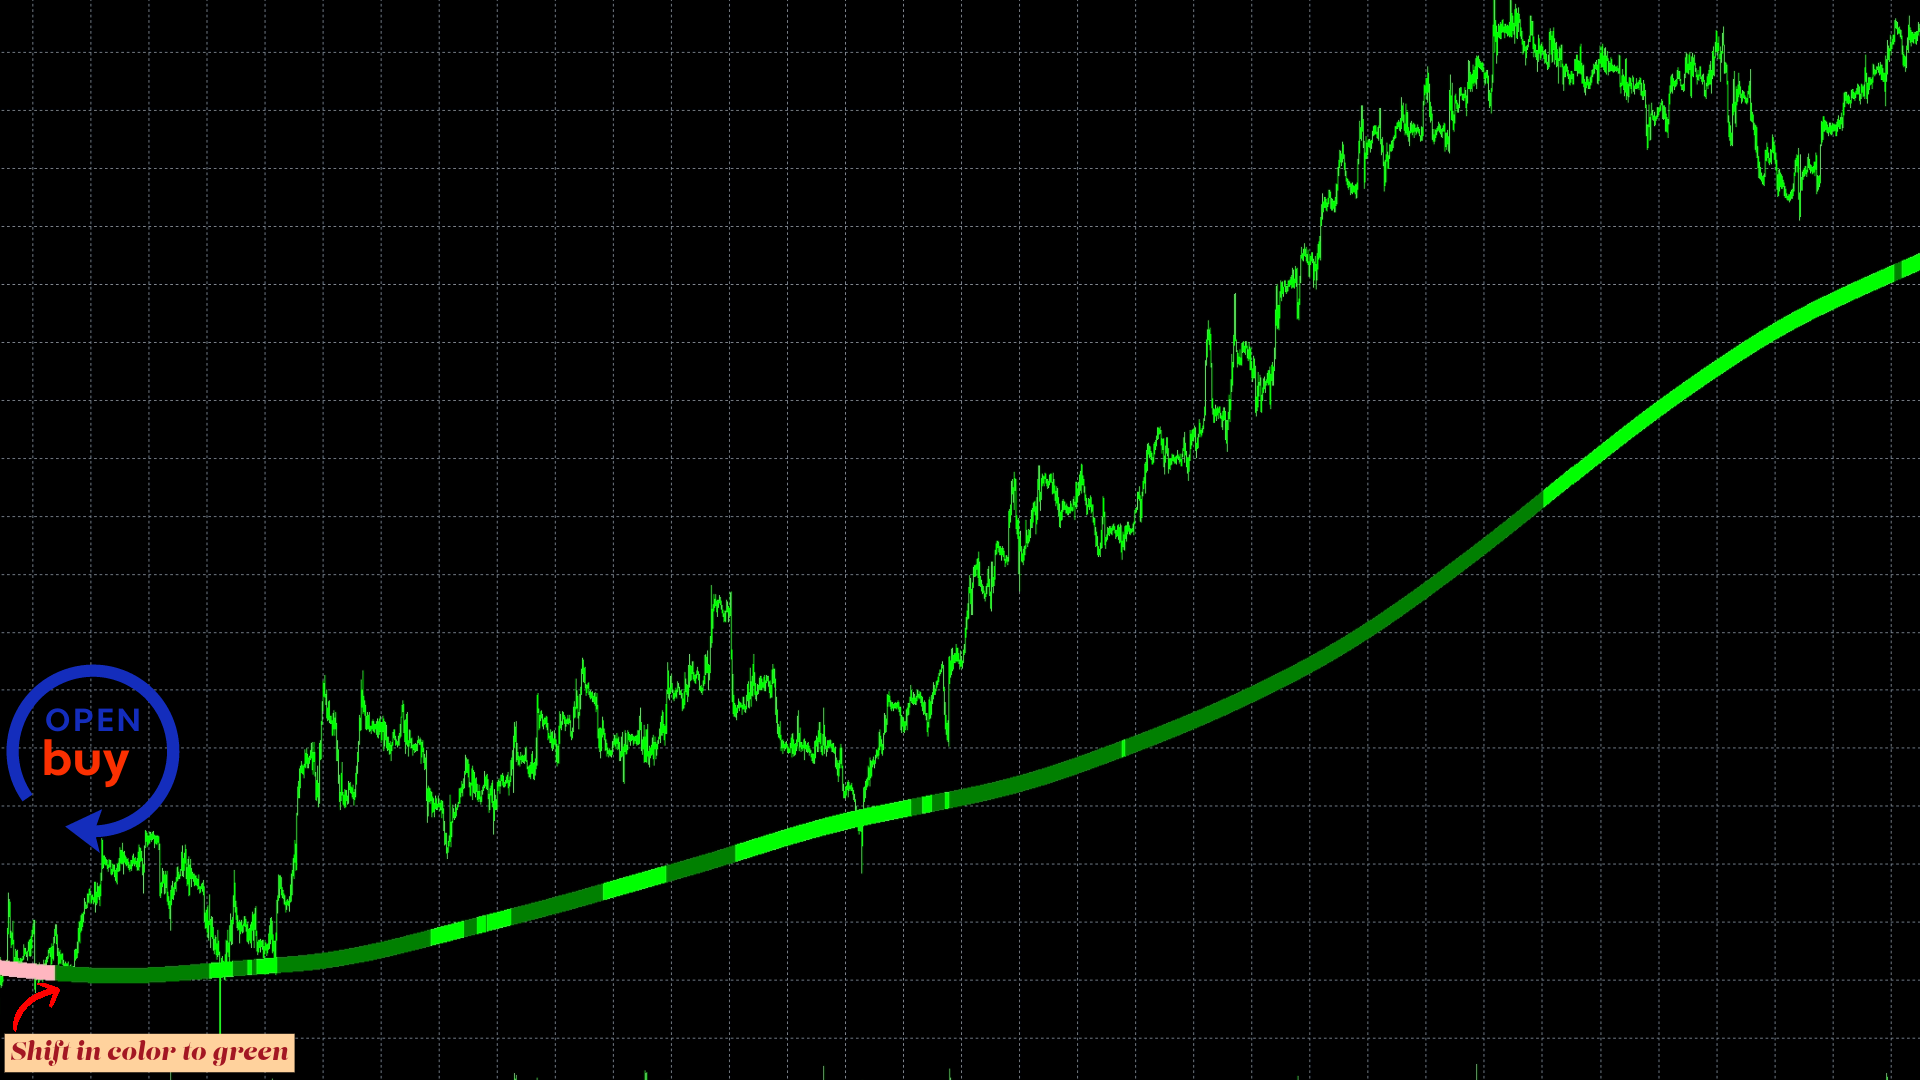
首要指标的设计意图是为了确定整体市场趋势。这一指标引入了一套明亮和深色的色彩系统,旨在辨识市场的强势和弱势条件。通过在图表上显示不同颜色,投资者可以更清晰地了解市场的变化和趋势。
从我的观点来看,这个指标是独一无二的;在市场开始活跃时,其表现格外出色。这种独特性可能归因于其设计和算法,使其在市场波动较大时表现出色。
如果您更喜欢在较长时间范围内使用指标,例如1小时、4小时或日间时间框架,以期望获得更准确的结果,请毫不犹豫地采用这一策略。这样的时间框架可以帮助您更好地捕捉市场趋势,从而做出更明智的交易决策。
当颜色变为绿色时,它表示了一个购买机会;而当颜色变为红色时,它则表示建议开启空头头寸。这种简单而清晰的信号系统有助于投资者迅速做出决策,特别是对于那些希望在市场波动中迅速把握机会的交易者而言。
为了实现最佳效果,请考虑使用趋势货币对进行交易。这种方法基于市场趋势的理念,可以提高交易的成功概率。趋势货币对通常表现出较强的方向性,因此选择这些货币对有助于更好地利用市场趋势。
如果您在使用过程中遇到任何问题,我将随时帮助您解决。理解和熟练掌握这个指标可能需要一些时间,但一旦掌握,它将成为您交易工具箱中的有力武器。
最后,祝愿您未来的交易一切顺利。希望您觉得这个信息对您有用。如果您找到了使用的方法,请与您的朋友分享,感谢您的支持。