PTS Divergence Sell Finder MT5
- 指标
- PrecisionTradingSystems
- 版本: 2.0
- 激活: 10
PTS - Divergence Buy Finder 由Precision Trading Systems制作
Precision Divergence Finder旨在精确找到市场底部,并经常成功。在技术分析中,挑选底部通常比挑选顶部容易得多,这个工具正是为了完成这个任务而设计的。在识别出牛市背离后,等待趋势上升再购买是明智的。您可以使用10或20个周期的最高点进场,或者使用15-30周期的移动平均线上升来识别趋势变化。
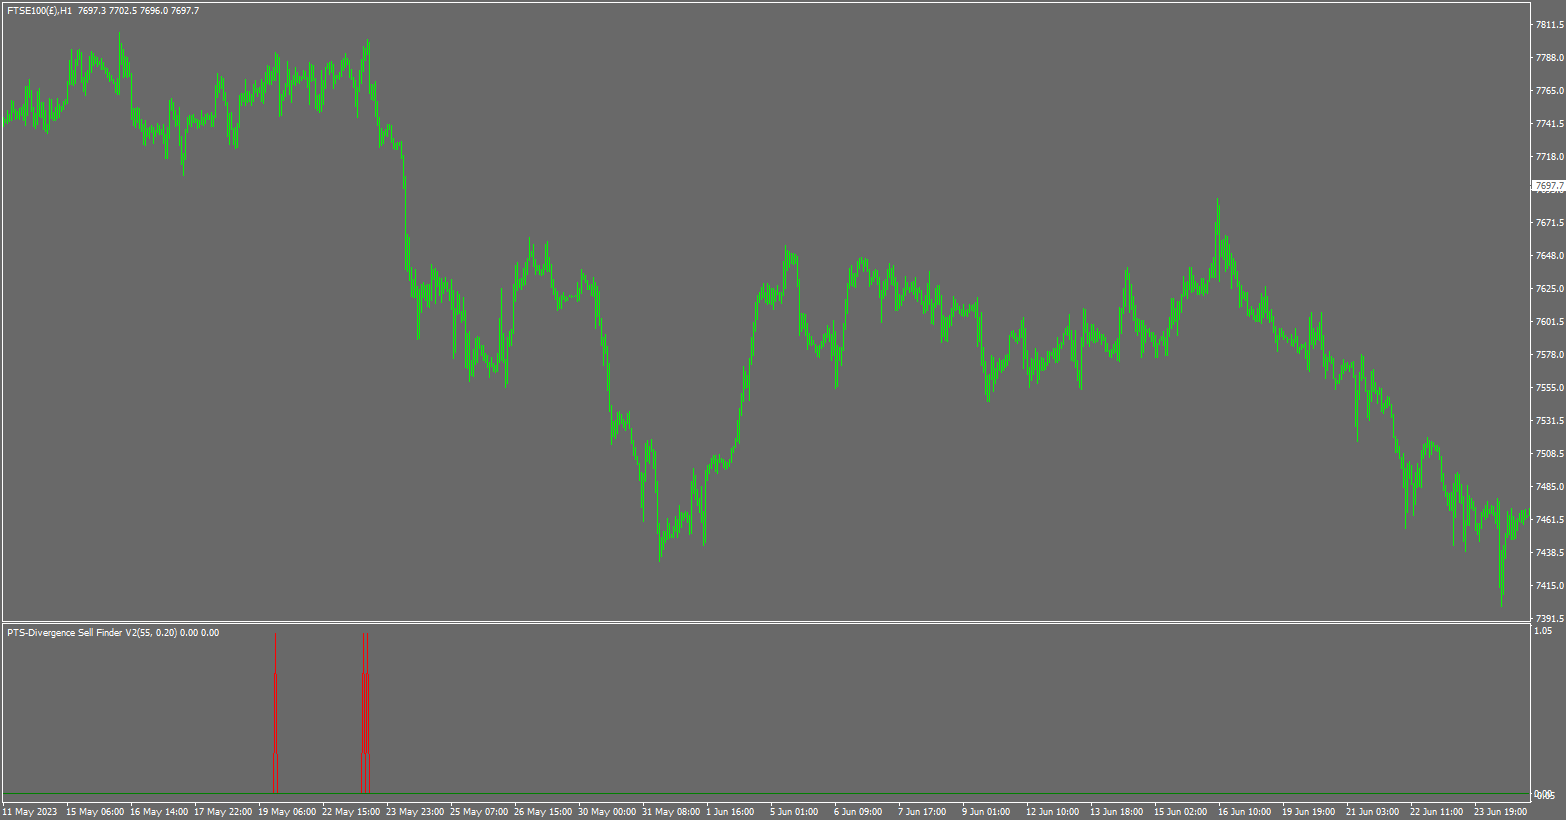
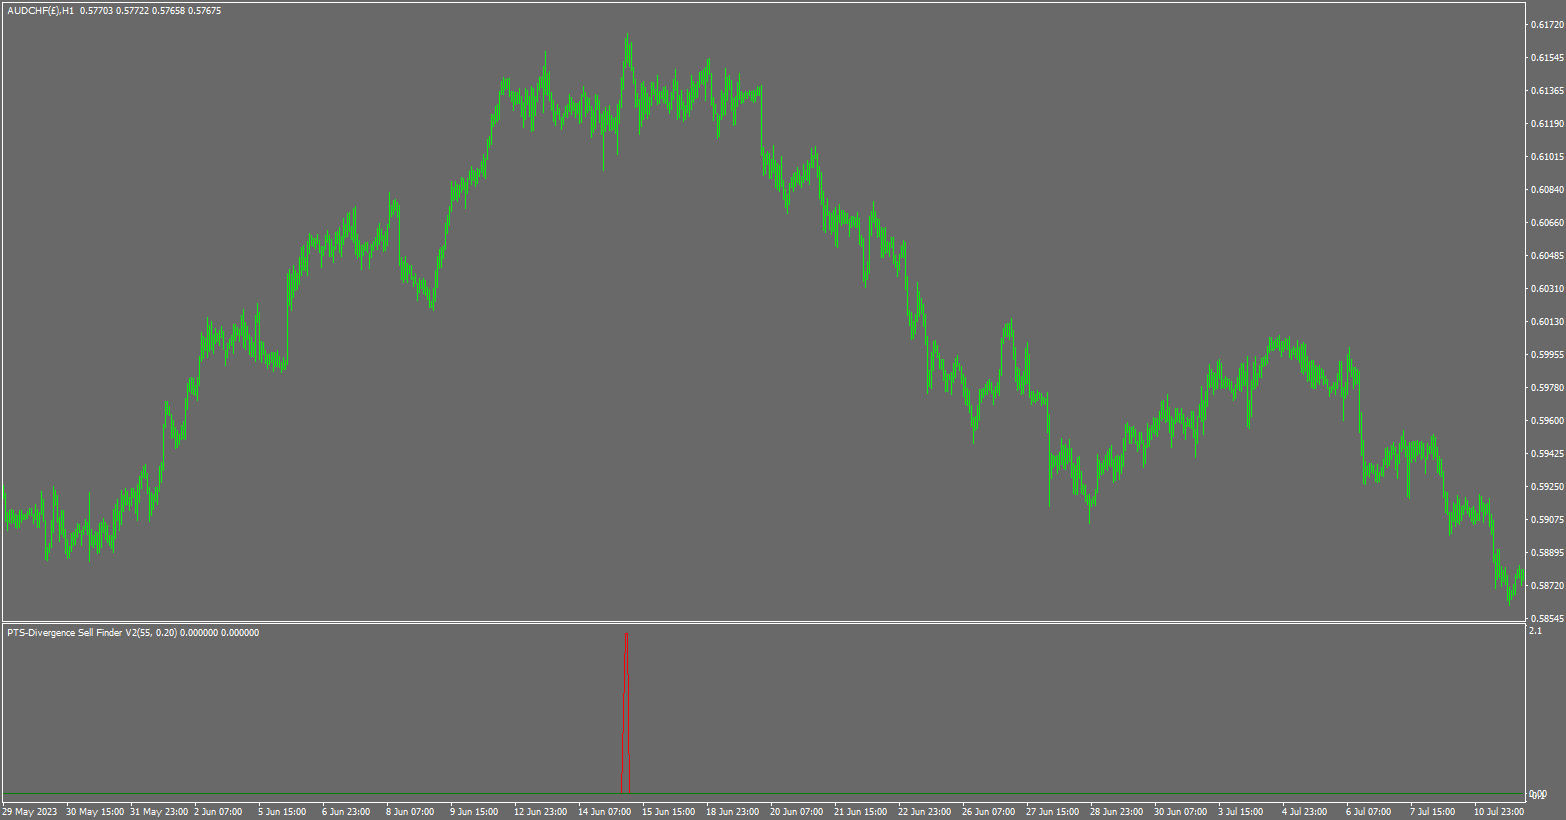
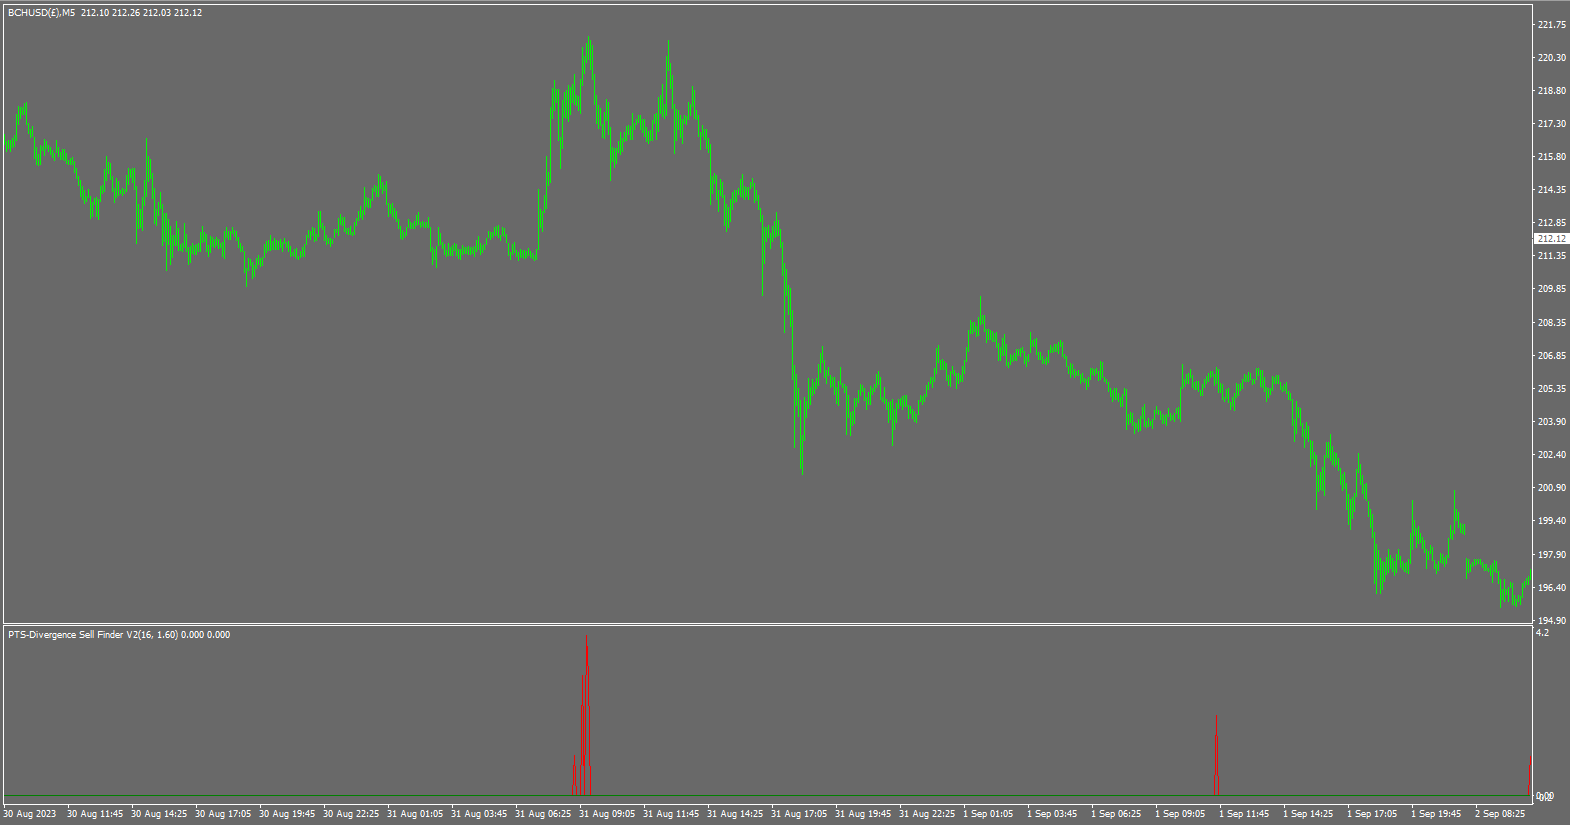
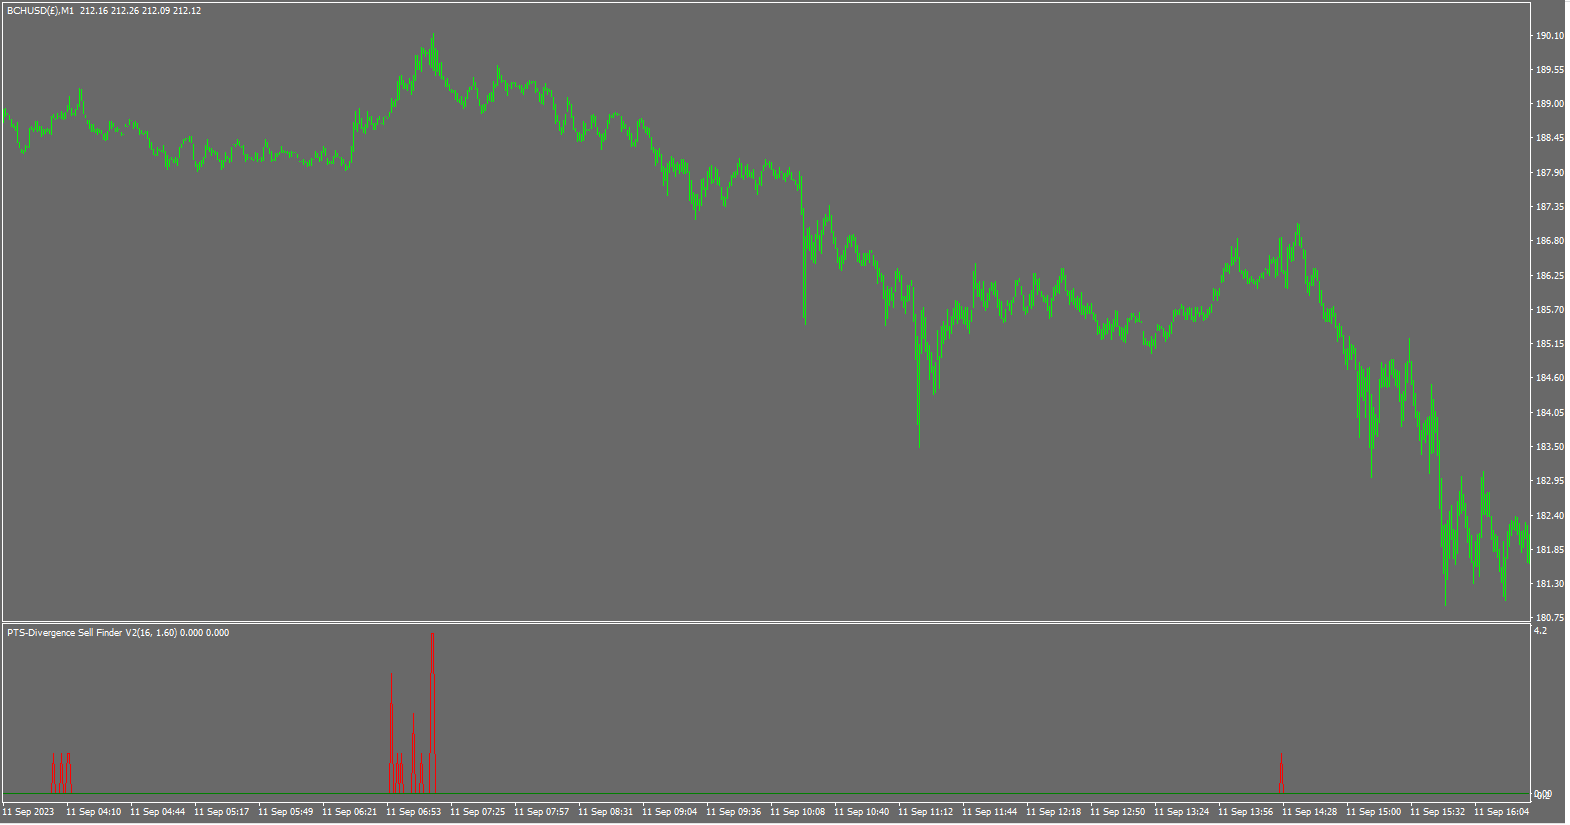
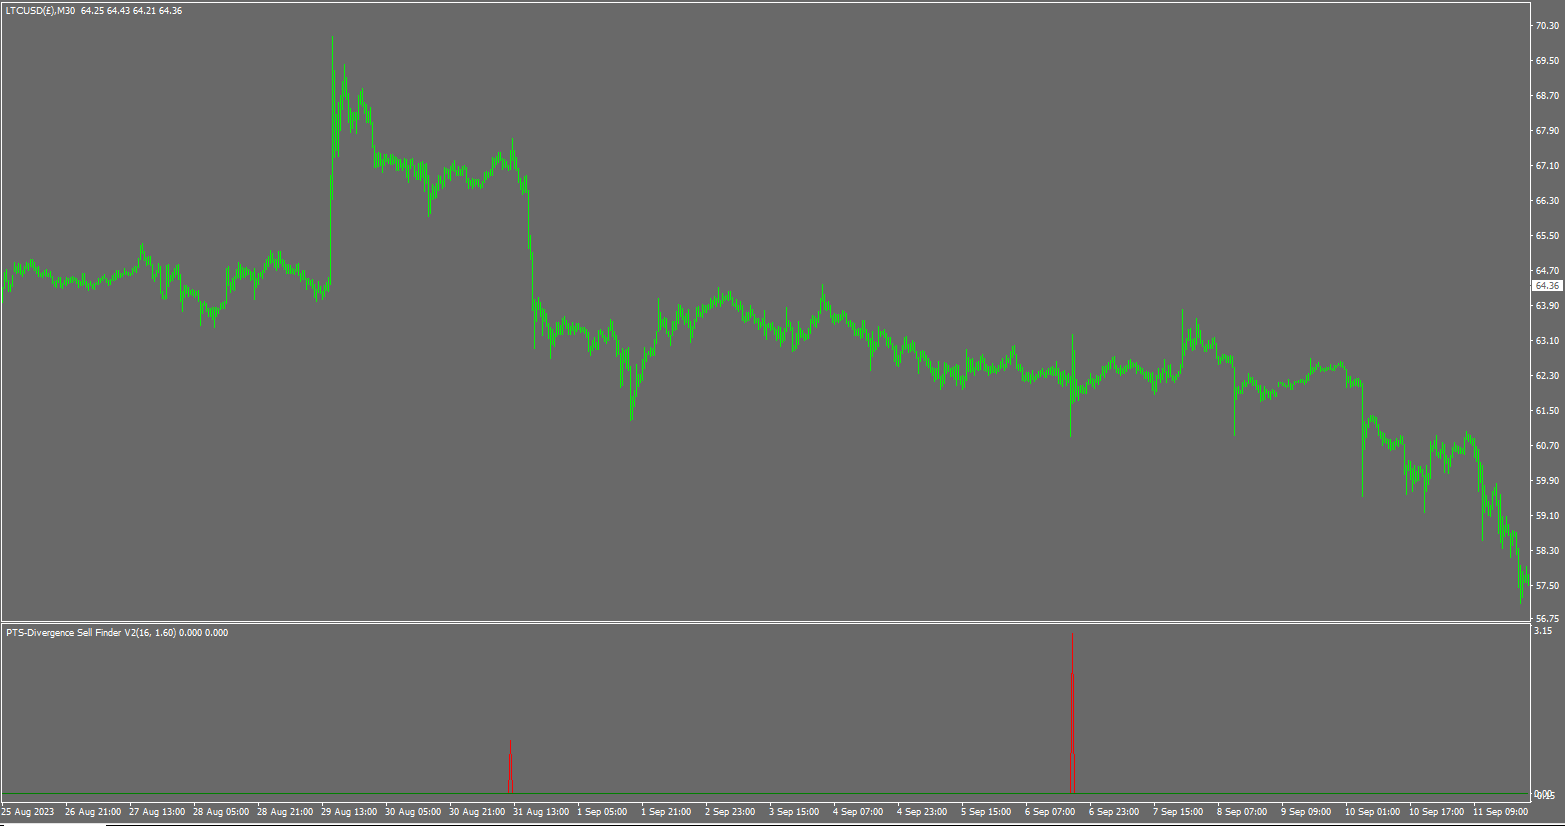
这个复杂的算法会实时逐根柱状图寻找并计算活跃的需求指数背离的数量。
该模型观察市场价格何时创出新低,而需求指数未创新低,从而产生背离。
该指标使用两个设置。
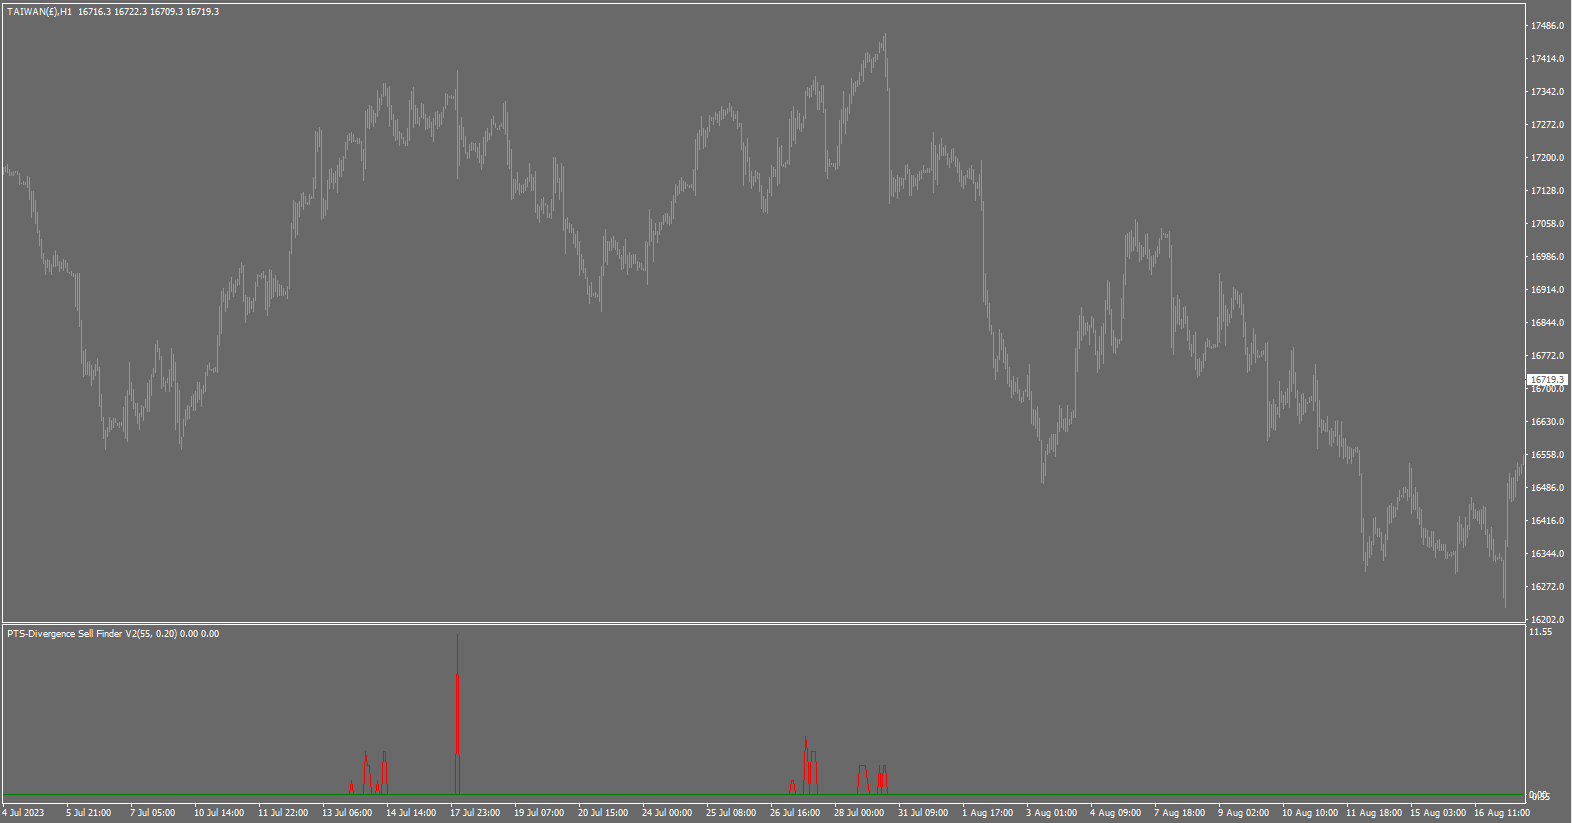
• 需求指数(DI)长度,它将为指标提供寻找的对象,并将为您选择的长度上的任何DI背离进行查找。
• 差异,这是[DI值现在]与[DI值长达200个周期以前]之间的背离量,对于它从各种回望期间找到的每个背离,它将在指标窗口中生成[1]输出。
最多检查20个周期,最大输出值将显示为20。
建议的设置
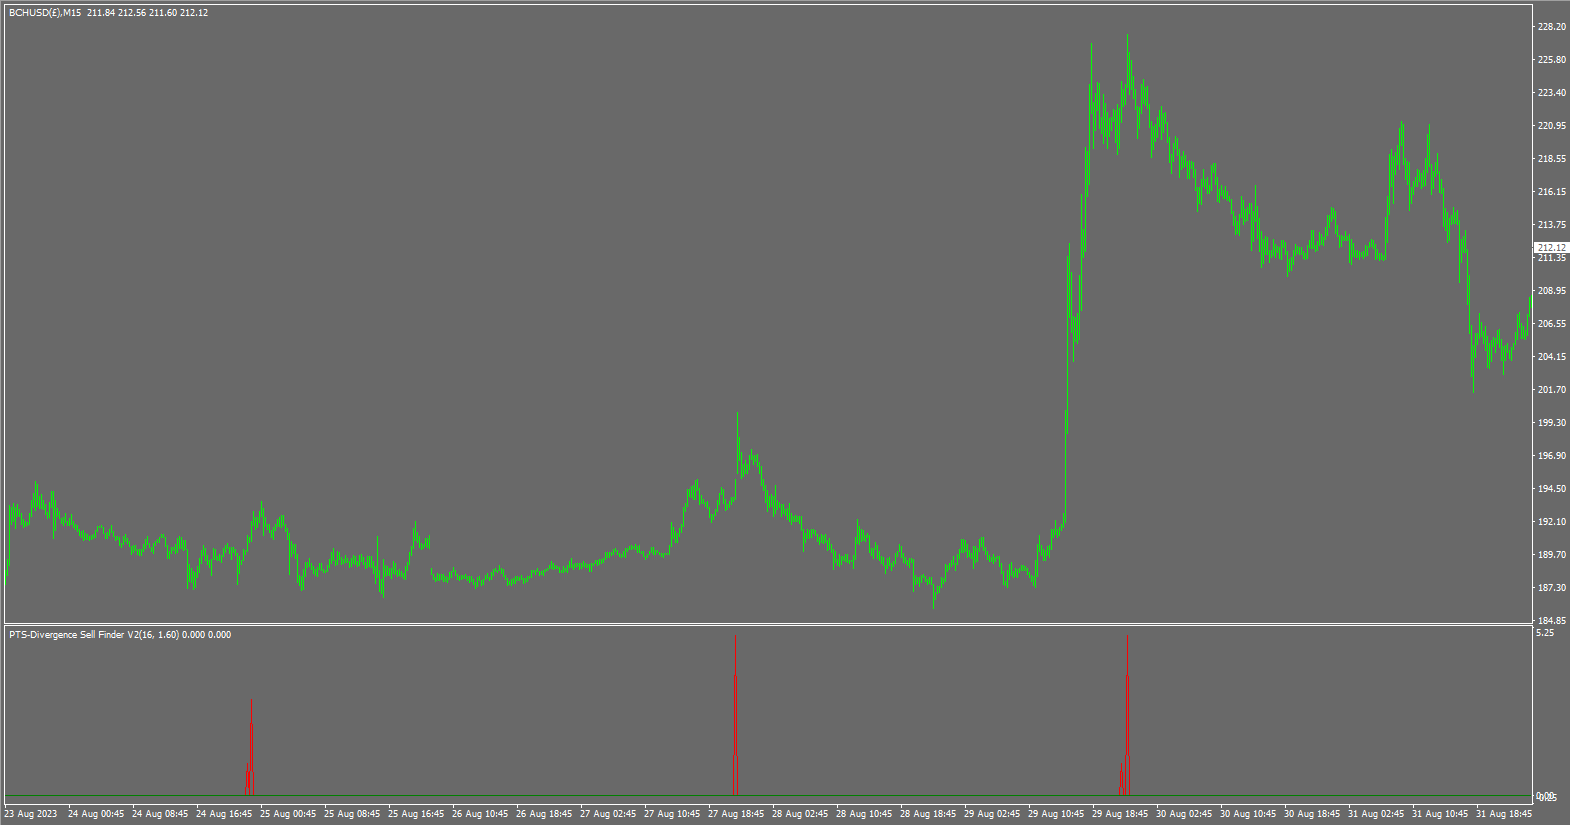
需求指数长度从15到100都可以使用,但最佳范围在20到60之间。
背离的差异为0.1至20(通常最佳为0.75至5,但根据您的数据流量,最佳值可能要大得多)
如果您使用的是滴定量,请使用以下设置。但是,如果您有交易量,可以使用更大的差异值 x 10。
DI长度20 = 差异0.95 - 5
DI长度30 = 差异0.85 - 4
DI长度40 = 差异0.75 - 4
DI长度50 = 差异0.25 - 3.5
DI长度60 = 差异0.2 - 3
DI长度70 = 差异0.15 - 2.5
DI长度80 = 差异0.1 - 2
DI长度90 = 差异0.1 - 1.8
DI长度100 = 差异0.1 - 1.7
大多数MT4用户将获得滴定量,因此建议值表是一个良好的起点。
请注意,我不使用推送通知,因此如果您想与我联系,请通过我的网站发送电子邮件,而不是在MT4上发送,因为我将在几周后才能看到您的消息。