BTrade
★xTrend★ 趋势一目了然!
■优势■
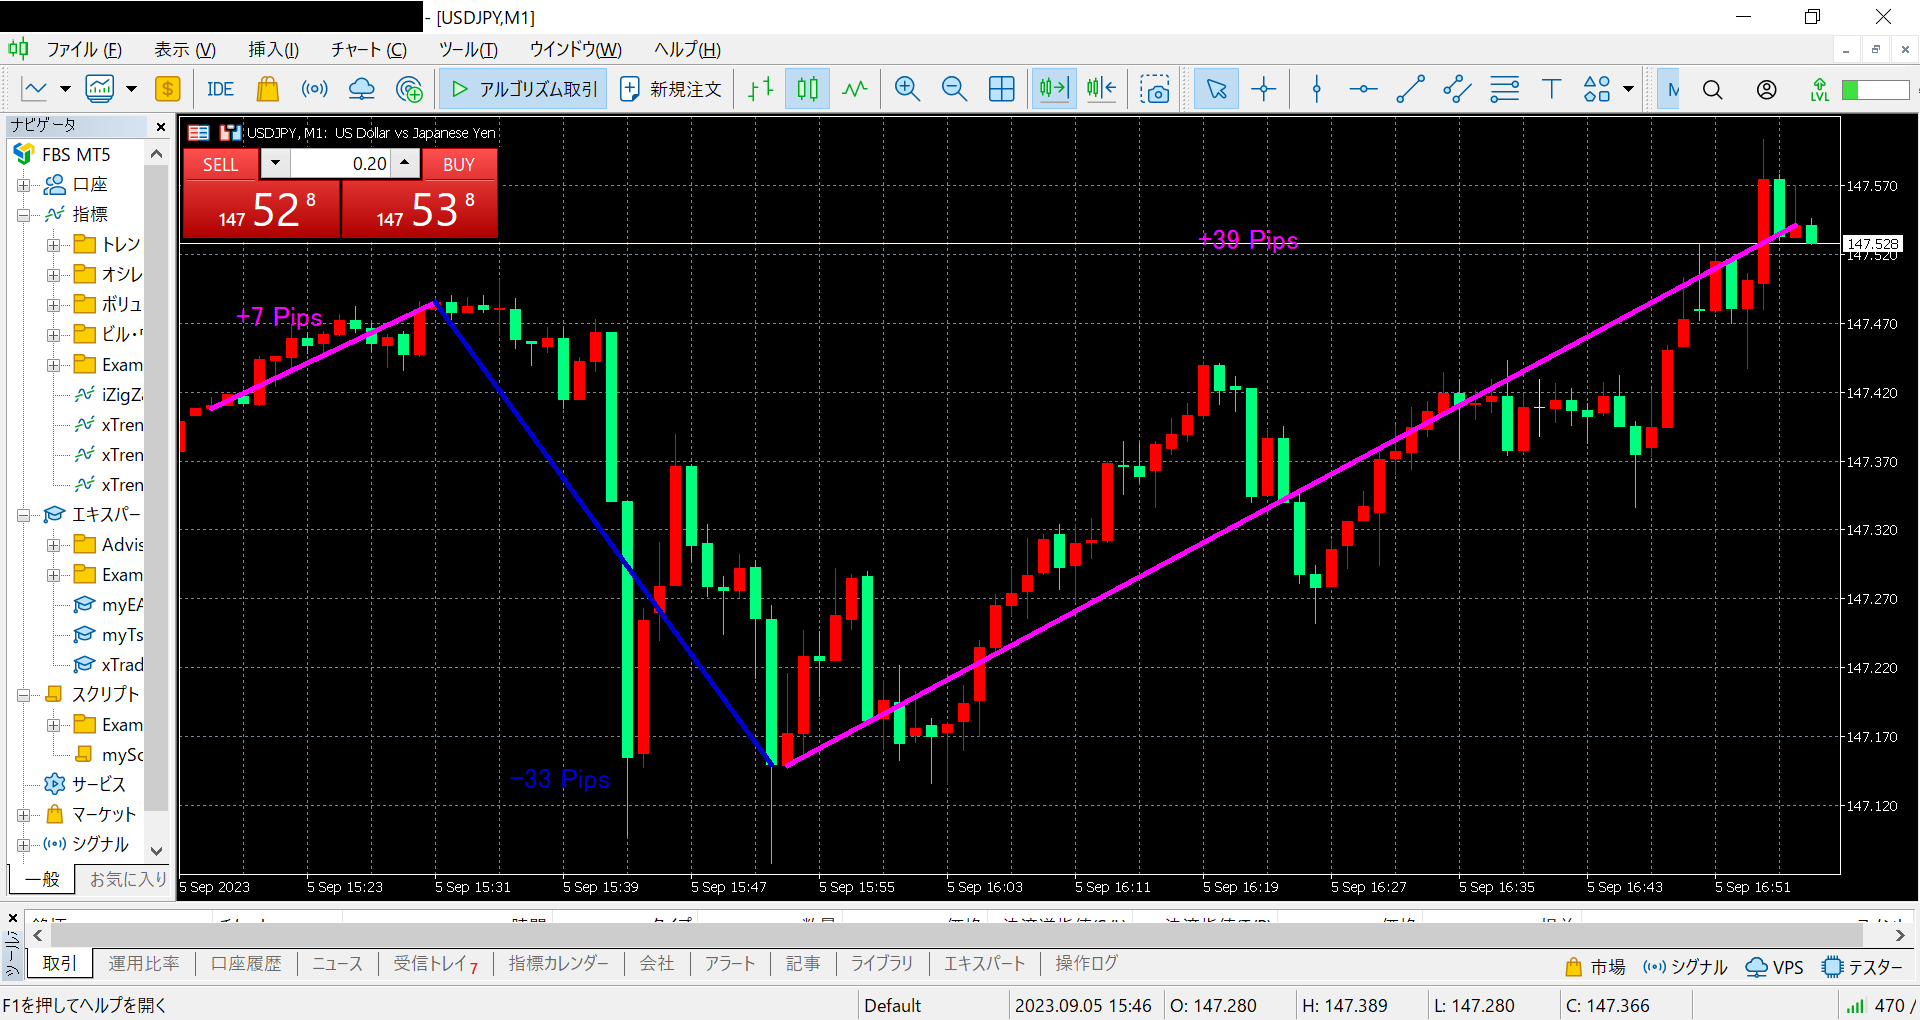
・趋势一目了然:通过将不同颜色的上升线,下降线和振荡线相连,能够将指定的过去一段时间到现在的总体趋势呈现在眼前,助力抓住裁量交易的转瞬即逝的机遇!
・可显示Pips:量化的升降趋势,将盈亏一眼看穿!
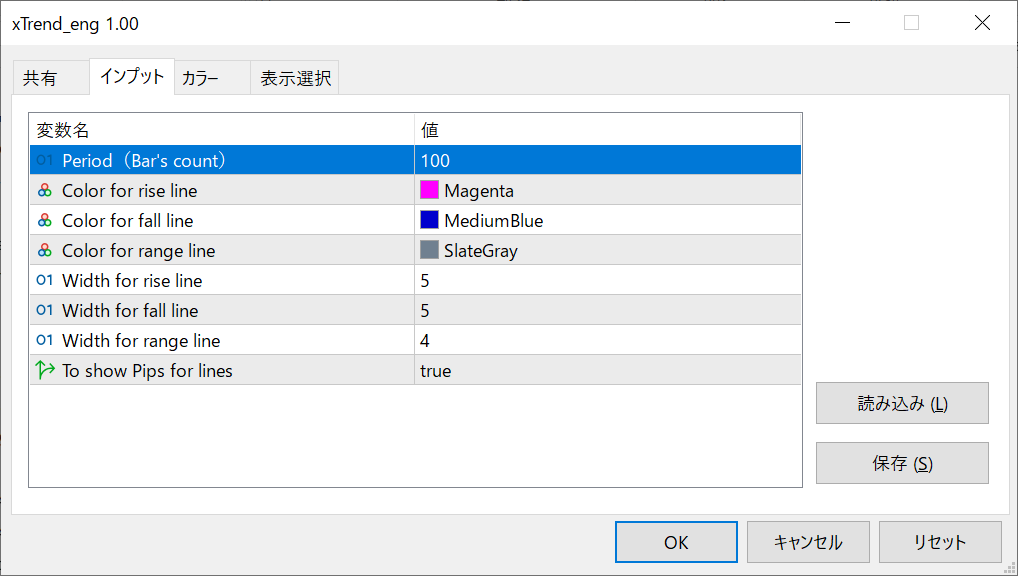
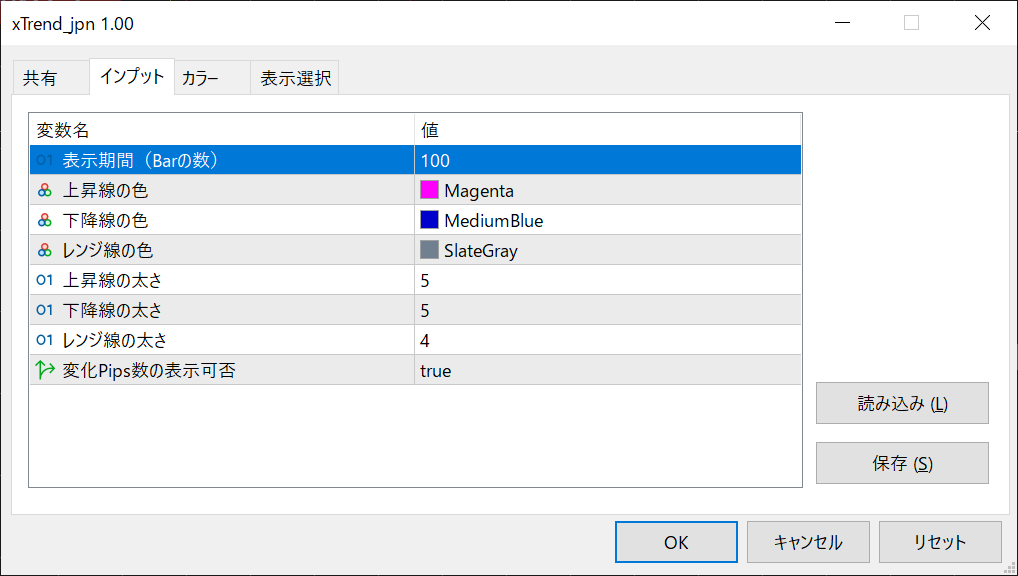
・设定简单:只需设定显示区间,上升线,下降线和振荡线的颜色以及线的粗细,还有是否显示Pips。省却了关于算法方面的各种繁琐设置,是非专业人士的福音。完全交给算法自身来决定最优化的参数!
・独立算法:基于多年的交易经验而形成的世界独一无二的算法,在判断趋势方面有着得天独厚的优势和无与伦比的精确度!
・适用于任意时间足
・适用于任意货币对
・适用于任意FX券商
・支持MT4和MT5两个平台