• 概述
  • 评论
  • 评论
  • 新特性

GeoInfo5

GeoInfo5是信息量最大的指标之一,它以简洁的形式显示交易工具的基本信息。
Meta Trader4终端的版本在交易者中广受欢迎。
该指标是免费的,将永远是免费的。
推出版本现在也可用于MetaTrader5。

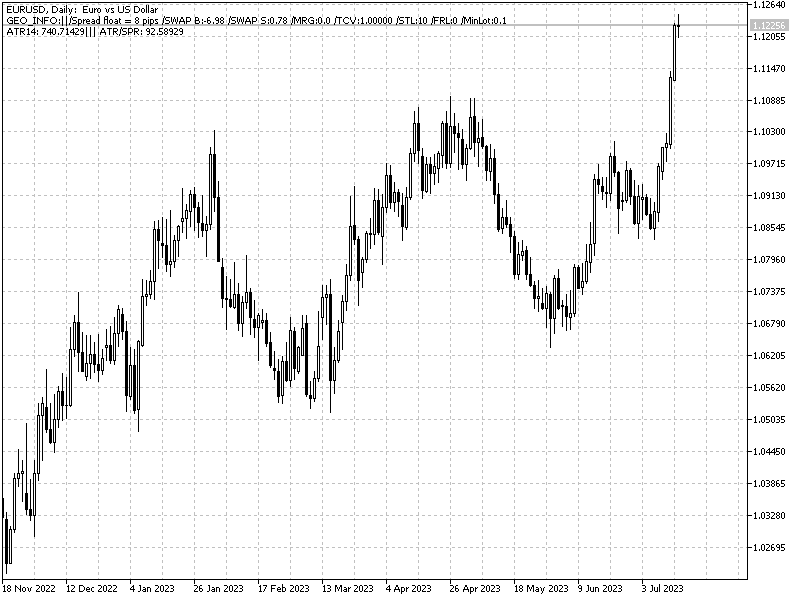
在图表左上角的行中以简短的形式显示有关工具主要参数的信息:
价差,交换买入订单,交换卖出订单,当前价差,抵押品(保证金),蜱虫大小,停止水平,订单冻结水平。 信息显示基于一个手和点。

信息以如下形式输出:Spread ... = 23 pips /SWAP B:4.200 /S:-8.470 /MRG:256.0/TCV:0.10/STL:0/FRL /MinLot:0.1

已经介绍了关于周期的平均范围和周期/点差的比率范围的信息的显示,这允许您选择在这些市场条件下最有效操作的最佳时间框架。 数据以格式呈现:
ATR14:906.786///ATR/SPR:3.956
如果ATR/SPR比率较小,则选择更高的时间框架以实现更高效的操作可能是有意义的。
对于紧急工具(期货),到期日以以下格式显示:Exp Date:2022.02.18
参数:
  • ShowSymbolInfo=true-true或false-是否显示有关工具的信息
  • ShowATRInfo=真;
  • ATR=14;


目前,推出版本呈现。

该指标继续发展。

新功能将在不久的将来出现。


...待续

推荐产品
This indicator uses a different approach from the previous version to get it's trendlines. This method is derived from Orchard Forex, and the process of making the indicator is demonstrated in there video   https://www.youtube.com/watch?v=mEaiurw56wY&t=1425s . The basic idea behind this indicator is it draws a   tangent line   on the highest levels and lowest levels of the bars used for calculation, while ensuring that the lines don't intersect with the bars in review (alittle confusing? I kno
FREE
Survivor
Pavel Nikiforov
Название советника : Survivor  (есть расширенная версия: https://www.mql5.com/ru/market/product/36530 ) Валютные пары : USDJPY, EURUSD, GBPUSD, AUDUSD, GBPJPY, XAUUSD, EURCHF Рекомендованная валютная пара : USDJPY Таймфрейм : М5 Время торговли : круглосуточно Описание : Трендовый  советник с возможностью мартингейла и построением сетки ордеров. В советнике используются три группы аналогичных сигналов для открытия, закрытия и дополнительных сделок. При наличии тренда(определяется МА) ловится отс
FREE
CAP Channel Trading MT5
MEETALGO LLC
3.96 (53)
The   CAP Channel Trading   is a volatility-based indicator that makes use of the “advanced envelope theory”. These envelopes consist of two outer lines. Envelope theory states that the market price will generally fall between the boundaries of the envelope (or channel). If prices move outside the envelope, it is a trading signal or trading opportunity. Benefits of the Channel Trading Indicator CAP Channel Trading works with any asset It can be applied to any financial assets: forex, cryptoc
FREE
Super Trend eu
Emin Ulucanli
4.75 (4)
SUPERTREND; It is a trend following indicator based on the SuperTrend ATR created by Olivier Seban. It can be used to detect changes in trend direction and locate stops. When the price falls below the indicator curve, it turns red and indicates a downtrend. Conversely, when the price moves above the curve, the indicator turns green, indicating an uptrend. Like other indicators, it works well on SuperTrend when used in conjunction with other indicators such as MACD, parabolik SAR, Bollinger Band
FREE
ForExp1
Mikhail Sergeev
5 (1)
Удобный трендовый индикатор. Не меняет своих значений. Имеет огромные возможности для настройки. Не требователен к ресурсам компьютера. Создавался для работы в системе BearsHunter. Эксперт МТ5 с использованием данного индикатора: https://www.mql5.com/ru/market/product/30381 Эксперт МТ4 с использованием данного индикатора: https://www.mql5.com/ru/market/product/30383 Параметры: m1_MA_Mode_1 - метод усреднения(0-9). m1_MA_Mode_2 - метод усреднения(0-9). m1_MA_Mode_3 - метод усреднения(0-9). m1
FREE
Amazing RSI + ATR Dashboard Indicators are useful for traders, but when you put them into a dashboard and can scan 28 symbols at once they become even better, and when you can also combine different indicators and timeframes to give you synchronized alerts they become awesome. When this product gets 20 reviews I will add another indcator free to this dashboard as a thank you.   This easy to use dashboard provides you with the RSI and ATR indicators, use them individually or together to create p
FREE
Thermo MAP MT5
Fabio Cavalloni
3.75 (4)
Thermo MAP is a multicurrency and multitimeframe indicator that display a smart heat map based on proprietary calculations. Watch how Forex market moved and is currently moving with a single dashboard and have a consistent and good idea of what is happening! It can be suitable for both scalping or medium/long term, just select options that better fit your trading style Symbols list are automatically sorted based on the preferred column. There is the possibility to click on: First row, timefram
FREE
General Clock
Fernando Lahude Ritter
A Simple clock that on the left side "Time" shows r espectively the TimeCurrent, followed beneath by the TimeLocal. On the right hand side we have the remaining minutes and seconds of the current candle. TimeLocal is synced every 500 miliseconds however, the TimeCurrent and the time left on the candle are synced every tick, so this can lead to inconsistencies on the readings so keep that in mind. This indicator have no plots or buffers so it cannot be used in any time based EA.
FREE
QuantumAlert Stoch Navigator is a free indicator available for MT4/MT5 platforms, its work is to provide "alerts" when the market is inside "overbought and oversold" regions in the form of "buy or sell" signals. This indicator comes with many customization options mentioned in the parameter section below, user can customise these parameters as needful. Join our   MQL5 group , where we share important news and updates. You are also welcome to join our private channel as well, contact me for the p
FREE
Hyper Trader
Rodrigo Matheus da Silva
4.02 (58)
This EA is complete,   multi-strategy ,   free ,   Brazilian and translated into English . If you prefer, download the EA in English: https://www.mql5.com/en/market/product/59417 Light box robot , that is, you define the settings, which strategy you will use to operate. More than 5,150 different input / output signals ; More than 362.273148.218.750.000 possibilities   combining up to 5 options of purchase (entry or exit) or sale (entry or exit), that's right, I checked this account! Over
FREE
QuantumAlert RSI Navigator is a free indicator available for MT4/MT5 platforms, its work is to provide "alerts" when the market is inside "overbought and oversold" regions in the form of "buy or sell" signals. This indicator comes with many customization options mentioned in the parameter section below, user can customise these parameters as needful. Join our MQL5 group , where we share important news and updates. You are also welcome to join our private channel as well, contact me for the priva
FREE
Value Chart Candlesticks
Flavio Javier Jarabeck
4.75 (8)
The idea of a Value Chart indicator was presented in the very good book I read back in 2020 , " Dynamic Trading Indicators: Winning with Value Charts and Price Action Profile ", from the authors Mark Helweg and David Stendahl. The idea is simple and the result is pure genius: Present candlestick Price analysis in a detrended way! HOW TO READ THIS INDICATOR Look for Overbought and Oversold levels. Of course, you will need to test the settings a lot to find the "correct" one for your approach.
FREE
TilsonT3
Jonathan Pereira
Tillson's T3 moving average was introduced to the world of technical analysis in the article ''A Better Moving Average'', published in the American magazine Technical Analysis of Stock Commodities. Developed by Tim Tillson, analysts and traders of futures markets soon became fascinated with this technique that smoothes the price series while decreasing the lag (lag) typical of trend-following systems.
FREE
Cybertrade Keltner Channels
Emanuel Andriato
4.75 (4)
Cybertrade Keltner Channels - MT5 Created by Chester Keltner, this is a volatility indicator used by technical analysis. It is possible to follow the trend of financial asset prices and generate support and resistance patterns. In addition, envelopes are a way of tracking volatility in order to identify opportunities to buy and sell these assets. It works on periods longer than the period visible on the chart. All values ​​are available in the form of buffers to simplify possible automations.
FREE
Breakout MV
Emmanouil Bampalos
Breakout MV :  This Expert Advisor offers you one of the most fundamental trading strategy,  combining Moving Average and Volums indicators!  Key Features : Consistent Performance : Breakout strategy has demonstrated a robust performance across various market conditions, by capitalizing on significant price movements. Strategic Trade Execution : We select the desired range, and once the price approaches these levels and the indicators confirm our entry, we open a trade. The trade will close ei
FREE
Steady Bands3
Roberto Tavares
Equidistant bands indicator with calculated moving average, allows you to configure the band size and can be used freely as an entry / exit indicator. Buffer 0 = price, buffer 1 = upper band, buffer 2 = lower band. you can also configure the periods of moving averages used in the calculations and also the shift to previous bars in addition to the price that can CLOSE (default) or OPEN. Excellent for fast daily moving pairs and frequent returns.
FREE
Strong movement levels
Nikolay Mitrofanov
5 (2)
Looks for strong price movements and draws levels upon their completion. You determine the strength of the movement yourself by specifying in the settings the number of points and the number of candles of the same color in a row in one direction. There are 2 types of building in the settings: extrenum - high / low close - close price You can also adjust the number of displayed levels and the number of candles for calculations. By default, the settings indicate 5 levels for 360 candles.
FREE
Rejection Zones
Paulo Henrique Faquineli Garcia
Este poderoso indicador analisa o gráfico e mostra zonas de Rejeição de Preços! Isto é, locais onde o preço foi, mas não foi aceito pelo mercado! A visualização desta zona de Rejeição, facilita o entendimento do trader na tomada de decisões de onde operar e como operar! O indicador é composto por 4 linhas, sendo classificadas em 2 grupos: Linhas Vermelha e Amarela: Denotam os extremos onde o preço conseguiu chegar, mas não foi aceito! Linhas Laranja e Azul: A partir delas, denotam o Início da
FREE
Didi Index
Flavio Javier Jarabeck
4.8 (20)
The famous brazilian trader and analyst Didi Aguiar created years ago a study with the crossing of 3 Simple Moving Averages called "Agulhada do Didi", then later was also named Didi Index, as a separate indicator. The period of those SMAs are 3, 8 and 20. As simple as that, this approach and vision bring an easy analysis of market momentum and trend reversal to those traders looking for objective (and visual) information on their charts. Of course, as always, no indicator alone could be used wit
FREE
Quarter EMA
Jithin Sajan Sajan
5 (2)
Kindly rate and comment about the product for upgradation & Support The 5 EMA is plotted in green color ( Lime ). The 14 EMA is plotted in red color ( Red ). The 20 EMA is plotted in blue color ( Blue ). The 200 EMA is plotted in yellow color ( Yellow ). The Quarter EMA that provided calculates and plots four Exponential Moving Averages (EMAs) on the chart using different periods: 5, 14, 20, and 200. Each EMA is represented by a different color on the chart. Here's a description of each
FREE
Quintet EMA
Jithin Sajan Sajan
Kindly rate and comment about the product for upgradation & Support The   5 EMA   is plotted in   green   color ( Lime ). The  14 EMA  is plotted in  red  color ( Red ). The   20 EMA   is plotted in   blue   color ( Blue ). The  200 EMA  is plotted in  black  color ( Black ). The   200 EMA   is plotted in   yellow   color ( Yellow ). The Quarter EMA that provided calculates and plots four Exponential Moving Averages (EMAs) on the chart using different periods: 5, 14, 20, and 200. Each EMA
FREE
MADayLevel
Azamat Mullayanov
Простейший индикатор для ручной торговли. Для комфортной торговли так же имеется эксперт https://www.mql5.com/ru/market/product/41133 Суть идикатора: уровни строяться на основе Moving Average с выбранным периодом по ценам High и Low. На разнице между High и Low строятся следующие уровни выше и ниже. В случае если бар не выходит за уровни, помечается зеленой меткой. Данную метку и уровни можно использовать для выставления отложенных ордеров когда цена на долго застревает между уровнями. Входны
FREE
欢迎使用Provlepsis指标 "Provlepsis"是一种高级指标,专为MQL市场设计。 通过分析以相同时间的前几个柱来计算市场潜在的价格波动范围,提供对未来价格波动宝贵的见解。 与传统的ATR指标不同,"Provlepsis"考虑了时间因素,从而得到一个更强大的工具,适应不同的市场条件。 在夜间,该指标预测较窄的波动范围,而在活跃的交易时间,它预期会有更宽的范围。 通过"Provlepsis"提供的全面范围分析,为您的交易策略获取竞争优势。 您可以在这里查看完整版本,可以更改 Provlepsis 指标的长度和偏移! https://www.mql5.com/zh/market/product/98802 为什么使用Provlepsis 基于区间的交易:该指标能够确定市场运动的潜在区间,对于基于区间的交易策略非常有价值。交易者可以利用该指标确定预期区间内的关键支撑和阻力水平,并相应地执行交易。 波动性分析:通过考虑时间因素,"Provlepsis"可以提供关于市场波动性的洞察。交易者可以利用该指标判断低波动或高波动期间,并相应调整风险管理和仓位规模。 时间敏感策略
FREE
Reversal Composite Candles
MetaQuotes Ltd.
3.57 (14)
该系统的思路是通过计算复合蜡烛来识别反转形态。 反转形态类似日本蜡烛条分析的 "锤头" 和 "吊颈" 形态。但它使用符合蜡烛替代单一的蜡烛,并且不需要复合蜡烛的小实体来确认反转。 输入参数: Range - 最大柱线数量, 计算复合蜡烛时用。 Minimum - 最小复合蜡烛大小 (传统的点数)。 ShadowBig and ShadowSmall - 影线 (复合蜡烛单元)。 Limit, StopLoss and TakeProfit - 开盘价, 止损位和止盈位, 它们是相对于复合蜡烛的收盘价 (复合蜡烛单元)。 Expiration - 订单过期时间 (单位柱线), 用于挂单 (Limit!=0.0)。 反向蜡烛条形态的判别如下。 它计算复合蜡烛参数,其自最后的完整柱线 (索引为 1) 至由 Range 输入参数定义的柱线数量。如果复合蜡烛大小大于由 Minimum 输入参数指定的数值, 它分析复合蜡烛的影线检测反转条件。 空头能量的特征是复合蜡烛的上影线为零, 多头能量的特征是复合蜡烛的下影线为零。 为确认空头趋势反转 (且多头开始),需要以下检查: 下影线的大小 (多头能量
FREE
Fundamental Signals Indicator MT5
Kyra Nickaline Watson-gordon
Fundamental Signals Indicator is a Non-Repaint Indicator with a powerful calculation engine that can predict market movement over 3000 pips (30000 points). The indicator does not analyze the market fundamentally, it is named fundamental because it can predict trends with large movements, no complicated inputs and low risk. Also Indicator can alert on market trend changes. Using Indicator : The Indicator is very simple and without complicated input parameters. (No need to optimize anythin
MADayLevelAssistant
Azamat Mullayanov
Данный эксперт является помощник для торговли по индикатору MADayLevel  ( https://www.mql5.com/ru/market/product/41130) Использовать можно как сеточник и для торговли внутри дня. Так как эксперт больше рассчитан на торговлю вручную, в автоматической торговле задействованы только 4 уровня: когда предыдущий бар полностью закрывается между 6 и 5, -6 и -5, выше 6 и ниже -6. Еще раз повторюсь, основной упор идет на работу в ручном режиме вместе с индикатором. Рекомендуемый период H1, символ EURUSD, т
FREE
TickChart Indicator plots tick line on the main window of MetaTrader. In the Lite version, the number of ticks is limited to 20 and the alert function described below is omitted.  The tick-line shows the most detailed, fastest and real-time activities of the market, which are usually hidden in bars or candles longer than 1 minute. Usually, several new tick-line segments appear while a bar of M1 time frame is completed. After the release of an important economic indicator, the number of ticks pe
FREE
Donchian Pro
Paulo Henrique Faquineli Garcia
5 (2)
The Donchian Channel Channels are among the most popular tools of technical analysis, as they visually convey to the analyst the limits within which most price movement tends to occur. Channel users know that valuable information can be obtained at any time, whether prices are in the central region of a band or close to one of the border lines. One of the best known techniques to explore these concepts is Bollinger Bands. However, John Bollinger was not the only one to research the applicatio
FREE
Follow The Line MT5
Oliver Gideon Amofa Appiah
4.5 (28)
This indicator obeys the popular maxim that: "THE TREND IS YOUR FRIEND" It paints a GREEN line for BUY and also paints a RED line for SELL. (you can change the colors). It gives alarms and alerts of all kinds. IT DOES NOT REPAINT and can be used for all currency pairs and timeframes. Yes, as easy and simple as that. Even a newbie can use it to make great and reliable trades. NB: For best results, get my other premium indicators for more powerful and reliable signals. Get them here: https://www.m
FREE
Long Waiting
Aleksandr Davydov
Expert description Algorithm optimized for Nasdaq trading The Expert Advisor is based on the constant maintenance of long positions with daily profit taking, if there is any, and temporary interruption of work during the implementation of prolonged corrections The Expert Advisor's trading principle is based on the historical volatility of the traded asset. The values of the Correction Size (InpMaxMinusForMarginCallShort) and Maximum Fall (InpMaxMinusForMarginCallLong) are set manually. Reco
FREE
该产品的买家也购买
TPSpro RFI Levels MT5
Roman Podpora
4.73 (11)
指示       俄罗斯 -        英语   建议 与指示器一起使用     -       TPSpro 趋势专业版 -   MT4版本       交易中的一个关键要素是做出买卖交易工具决定的区域或水平。尽管主要参与者试图隐藏他们在市场中的存在,但他们不可避免地会留下痕迹。我们的任务是学习如何识别这些痕迹并正确解释它们。 主要功能: 向卖家和买家显示活跃区域! 该指标显示所有正确的初始买入和卖出脉冲水平/区域。激活这些水平/区域后,开始寻找切入点,水平会改变颜色并填充特定阴影。此外,还会显示箭头,以便更直观地了解情况。 显示更高时间范围内的级别/区域(MTF 模式) 添加了使用更高时间间隔显示级别/区域的功能。此外,该指标还具有自动趋势检测功能(   TPSproTREND PRO   )。 用于交易的单独专业的逐步算法。 该算法专为日内交易而设计,既可顺势交易,也可逆势交易。每个活动模板均提供详细说明。 适用于多种时间范围 。 TPSpro RFI 水平指标可用于图表上的任何时间范围,从一分钟(M1)开始一直到每月(MN)。 图形和声音警报。 该指标提供图形和声音指示
Atbot
Zaha Feiz
4.97 (34)
AtBot: 它是如何工作的以及如何使用它 ### 它是如何工作的 “AtBot”指标用于MT5平台,通过结合技术分析工具生成买入和卖出信号。它集成了简单移动平均线(SMA)、指数移动平均线(EMA)和平均真实波幅(ATR)指标,以识别交易机会。此外,它还可以利用Heikin Ashi蜡烛来增强信号的准确性。 购买后留下评论,您将获得特别的奖励礼物。 ### 主要特点: - 不重绘: 信号在绘制后不会改变。 - 不变动: 信号保持一致,不会被更改。 - 无延迟: 提供及时的信号,没有延迟。 - 多种时间框架: 可在任何时间框架上使用,以适应您的交易策略。 ### 操作步骤: #### 输入和设置: - firstkey (TrendValue): 调整趋势检测的灵敏度。 - Secondkey (SignalValue): 定义买入/卖出信号生成的灵敏度。 - masterkey (ExitValue): 控制信号的退出策略。 - h: 切换是否根据Heikin Ashi蜡烛生成信号(真/假)。 - notifications: 启用或禁用信号提醒。 #### ATR计算: ATR测
Gold Stuff mt5
Vasiliy Strukov
4.92 (165)
Gold Stuff mt5 是专为黄金设计的趋势指标,也可用于任何金融工具。 该指标不会重绘,也不会滞后。 推荐时间框架 H1。 购买后立即联系我以获得设置和个人奖励!   你可以在我的个人资料中找到它。   重要! 购买后立即与我联系,以获得说明和奖金!   您可以免费收到我们的强力支持和趋势扫描指标的副本,请私信。大部头书!   设置 绘制箭头 - 打开关闭。 在图表上绘制箭头。 警报 - 打开关闭声音警报。 电子邮件通知 - 打开关闭。 电子邮件通知。 Puch-notification - 打开关闭。 推送通知。 接下来,调整色域。 Gold Stuff mt5 是专为黄金设计的趋势指标,也可用于任何金融工具。 该指标不会重绘,也不会滞后。 推荐时间框架 H1。 购买后立即联系我以获得设置和个人奖励!   设置 绘制箭头 - 打开关闭。 在图表上绘制箭头。 警报 - 打开关闭声音警报。 电子邮件通知 - 打开关闭。 电子邮件通知。 Puch-notification - 打开关闭。 推送通知。 接下来,调整色域。
首先,值得强调的是,这个交易系统是一个非重绘、非重画和非滞后的指标,这使得它非常适合手动和机器人交易。 在线课程,手册和下载预设。 “智能趋势交易系统 MT5”是专为新手和经验丰富的交易者量身定制的综合交易解决方案。它结合了超过 10 个优质指标,具有 7 多个强大的交易策略,使其成为适用于各种市场条件的多功能选择。 趋势跟随策略:提供精确的入场和止损管理,以有效地跟随趋势。 反转策略:识别潜在的趋势反转,使交易者能够利用区域市场的机会。 剃头策略:专为快速准确的日内交易和短期交易而设计。 稳定性:所有指标都不会重绘、不会重画和不会滞后,确保可靠的信号。 定制:支持自定义策略,以满足个人交易偏好。超过 7 种策略和组合可帮助您找到最佳策略。 信号清晰度:提供箭头信号,以指示清晰的入场和退出点。 实时警报:通过交易进出警报使交易者保持了解。 深入分析:提供更高时间框架的趋势分析和实时交易监控。 自适应颜色编码:利用蜡烛颜色编码来显示成交量、趋势和反转蜡烛信号。通过蜡烛颜色分析市场方向。 “智能趋势交易系统 MT5”赋予交易者必要的工具,以便在各种市场条件下做出明智和战略性的交易决策。无论
Atomic Analyst MT5
Issam Kassas
4.42 (19)
首先值得强调的是,该交易指标是非重绘、非延迟的指标,这使其成为手动和机器人交易的理想选择。 用户手册:设置、输入和策略。 Atomic Analyst是一种PA价格行动指标,利用价格的力量和动量来寻找市场上更好的机会。配备了高级过滤器,可帮助去除噪音和假信号,并提高交易潜力。使用多层复杂的指标,Atomic Analyst扫描图表,并将复杂的数学计算转化为任何初学者都能理解并用来做出一致交易决策的简单信号和颜色。 “Atomic Analyst”是专为新手和经验丰富的交易者量身定制的综合交易解决方案。它将高级指标和一流功能融合为一体的交易策略,使其成为所有类型交易者的多功能选择。 日内交易和剥头皮策略:专为快速准确的日内交易和短期交易而设计。 日内和摆动交易策略:可用作追求价格大幅波动的日内和摆动交易者的可靠工具。 多货币和市场:凭借其可靠的精度,在不同的工具和市场上运作。 多个时间框架:可在多个时间框架上使用,性能良好。 稳定性:所有指标均不重绘、不重绘和不滞后,确保可靠的信号。 信号清晰度:提供箭头信号,用于清晰的入场和出场点。 实时警报:通过交易入场、SL和TP警报通知交
Trend Screener Pro MT5
STE S.S.COMPANY
4.87 (63)
使用趋势筛选指标释放趋势交易的力量:由模糊逻辑和多货币系统提供支持的终极趋势交易解决方案! 使用趋势筛选器(由模糊逻辑提供支持的革命性趋势指标)提升您的趋势交易。 它是一个强大的趋势跟踪指标,结合了超过 13 种高级工具和功能以及 3 种交易策略,使其成为使您的 Metatrader 成为趋势分析器的多功能选择。 限时优惠:趋势筛选指标终身仅需 50 美元。 ( 原价 250$ ) (优惠延长) 体验趋势筛选器 100% 无需重新绘制的准确性,确保您的交易决策不受过去价格变化的影响。 释放多时间框架和多货币功能的多功能性,使您能够以无与伦比的信心在外汇、商品、加密货币和指数领域进行交易。 利用 Trend Screener 的综合策略套件增强您的交易: - 趋势跟踪策略和趋势延续策略 :趋势筛选器的趋势跟踪策略提供清晰的趋势延续信号,让您有效捕捉趋势走势并管理风险。 - 反转策略和早期入场点策略 :趋势筛选器的反转策略可检测市场方向的潜在变化,使您能够预测趋势反转并利用疲弱的市场趋势。通过早期入场点,您可以在潜在的趋势变化之前定位自己 获取可观的利润。 - 倒卖策略: 趋势筛选器的倒卖
首先,值得强调的是,这个交易工具是非重绘、非重画和非滞后的指标,非常适合专业交易。 在线课程,用户手册和演示。 智能价格行动概念指标是一个非常强大的工具,既适用于新手,也适用于经验丰富的交易者。它将超过20个有用的指标合并到一个指标中,结合了高级交易思想,如内圈交易员分析和智能资金概念交易策略。该指标侧重于智能资金概念,提供有关大型机构交易方式的见解,帮助预测它们的动向。 它在流动性分析方面尤其擅长,有助于理解机构的交易方式。它擅长预测市场趋势,并仔细分析价格波动。通过将您的交易与机构策略对齐,您可以更准确地预测市场走向。该指标多才多艺,擅长分析市场结构,识别重要的订单区块,并识别各种模式。 它擅长识别BOS和CHoCH等模式,理解动量的转变,并突出显示供需强劲的关键区域。它还擅长发现强大的不平衡,并分析价格创造更高高点或更低低点的模式。如果您使用斐波那契回撤工具,该指标可以满足您的需求。它还可以识别相等的高点和低点,分析不同的时间框架,并通过仪表板显示数据。 对于使用更高级策略的交易者,该指标提供了工具,如公平价值差指标和优惠和折扣区域的识别。它特别关注高时间框架订单
Quantum Trend Sniper
Bogdan Ion Puscasu
4.8 (49)
介绍   量子趋势狙击指标 ,突破性的 MQL5 指标,正在改变您识别和交易趋势反转的方式!由拥有超过13年交易经验的资深交易员团队开发,     量子趋势狙击指标   旨在通过其创新的方式以极高的准确度识别趋势反转,将您的交易之旅推向新的高度。 ***购买量子趋势狙击指标,即可免费获得量子突破指标!*** 当量子突破指标识别出趋势反转时,它会向您发出警报和信号箭头,并建议您三个止盈水平。 它既适合新手交易者,也适合专业交易者。 量子 EA 通道:       点击这里 MT4版本:       点击这里 建议: 时间范围: 所有时间范围。为了获得最佳结果,我们建议在 M15、M30 和 H1 时间范围内使用它。 货币对:欧元兑美元、英镑兑美元、澳元兑美元、欧元兑英镑、, EURAUD,  XAUUSD 账户类型:ECN、Raw 或 Razor,点差极低 经纪时间:任意 经纪商:IC Markets、Pepperstone with Raw 和 Razor 的点差最低 建议止损:50 点 建议止盈水平:20 点、50 点和
ATrend
Zaha Feiz
4.75 (4)
ATREND: 工作原理及使用方法 工作原理 “ATREND”指标针对MT5平台设计,旨在通过结合多种技术分析方法为交易者提供强有力的买卖信号。该指标主要利用平均真实波幅(ATR)来测量波动性,并结合趋势检测算法来识别潜在的市场动向。 购买后请留言,您将获得特别的赠品。 剩余8份,售价30美元。 主要特点: - 动态趋势检测:该指标评估市场趋势并相应调整信号,帮助交易者与当前市场条件对齐策略。 - 波动性测量:通过使用ATR,该指标衡量市场波动性,这对于确定最佳止损(SL)和止盈(TP)水平至关重要。 - 信号可视化:该指标在图表上直观地表示买卖信号,增强交易者的决策能力。 操作步骤 输入和设置: - 时间框架:此输入允许您设置指标计算的主要时间框架,默认值为15分钟。 - 时间框架2:此输入可用于定义额外分析的辅助时间框架,默认值为1分钟。 - 移动:此参数允许您将指标的计算向回移动,默认值为0。 - SLATR:此输入定义用于根据ATR计算止损水平的乘数,默认值为2.56。 - TPATR:此输入定义用于根据ATR计算止盈水平的乘数,默认值也为2.56。 - Alerts
TrendMaestro5
Stefano Frisetti
note: this indicator is for METATRADER4, if you want the version for METATRADER5 this is the link:  https://www.mql5.com/it/market/product/108106 TRENDMAESTRO ver 2.4 TRENDMAESTRO recognizes a new TREND in the bud, he never makes mistakes. The certainty of identifying a new TREND is priceless. DESCRIPTION TRENDMAESTRO identifies a new TREND in the bud, this indicator examines the volatility, volumes and momentum to identify the moment in which there is an explosion of one or more of these data a
该仪表盘显示所选符号的最新可用谐波形态,因此您可以节省时间并提高效率 /  MT4 版本 。 免费指标:  Basic Harmonic Pattern 指标列 Symbol:   显示所选符号 Trend:     看涨或看跌 Pattern:    形态类型(Gartley、蝴蝶、蝙蝠、螃蟹、鲨鱼、Cypher 或 ABCD) Entry:     入口价格 SL: 止损价 TP1: 第一止盈价 TP2: 第二次获利价格 TP3: 第三次获利价格 Current price:    当前价格 Age (in bars):   最后绘制的模式的年龄 主要输入 Symbols :   从 "28 种主要货币对 "或 "选定符号 "中选择。 Selected Symbols :   希望监控的符号,用逗号分隔("EURUSD,GBPUSD,XAUUSD")。如果您的经纪商为货币对设置了后缀或前缀,您必须在以下两个参数中添加(货币对前缀或货币对后缀)。 Max Iteration:   调整模式的最大迭代次数(如果该值越小,则模式越少,性能越快;如果该值越大,则模式越多,性能
FX Power MT5 NG
Daniel Stein
5 (5)
通过 mql5 和 Telegram 上 的晨间简报获取每日市场更新,包括详细信息和屏幕截图 ! FX Power MT5 NG 是我们长期以来非常受欢迎的货币强度计算器 FX Power 的下一代产品。 这款下一代强度计算器能提供什么?您所喜爱的原版 FX Power 的所有功能 附加功能 黄金/XAU 强度分析 更精确的计算结果 可单独配置的分析周期 可自定义计算限制,以获得更好的性能 为希望查看更多信息的用户提供特殊的多实例设置 无尽的图形设置,可在每个图表中设置您最喜欢的颜色 无数的通知选项,让您再也不会错过任何重要信息 采用 Windows 11 和 macOS 风格的全新圆角设计 神奇的移动指标面板 FX Power 主要功能 所有主要货币的完整强势历史 所有时间框架内的货币强弱历史 所有经纪商和图表的计算结果完全相同 100% 可靠的实时计算 -> 无重绘 可通过下拉列表选择分析时段 通过自定义模式单独配置分析时段 可在一个图表中使用多个实例 可移动 FX Power 显示屏(通过拖放) 适用于高分辨率 QHD、UHD 和 4K 显示器 自动终端配置 针对平板电脑
The 1 2 3 Pattern Scanner MT5
Reza Aghajanpour
5 (18)
** All Symbols x All Timeframes scan just by pressing scanner button ** *** Contact me  to send you instruction and add you in "123 scanner group" for sharing or seeing experiences with other users. After 17 years of experience in the markets and programming, Winner indicator is ready. I would like to share with you! Introduction The 123 Pattern Scanner indicator with a special enhanced algorithm is a very repetitive common pattern finder with a high success rate . Interestingly, this Winner in
IX Power MT5
Daniel Stein
4.17 (6)
IX Power 终于将 FX Power 的无与伦比的精确性带到了非外汇交易符号中。 它能准确判断您喜爱的指数、股票、商品、ETF 甚至加密货币的短期、中期和长期趋势强度。 您可以 分析 终端提供的 一切 。试试吧,体验一下您在交易时如何把握 时机 。 IX Power 主要功能 100% 精确的非重绘计算结果 - 适用于您终端中的所有交易符号 下拉式选择预配置以及可单独配置的强度分析周期 通过电子邮件、消息和手机通知的无数种通知选项 可访问的 EA 请求缓冲区 可自定义计算限制,以获得更好的性能 为希望查看更多信息的用户提供特殊的多实例设置 无尽的图形设置,让您在每个图表中都能找到最喜欢的颜色 采用 Windows 11 和 macOS 风格的圆角新面板设计 神奇的移动指标面板,可在子窗口和主图表之间无缝移动 适用于高分辨率 QHD、UHD 和 4K 显示器,并针对平板电脑和触摸屏进行了优化 IX Power 参数 最重要的参数不言自明,但我们很快会在另一篇文章中为您提供所有 IX Power 参数的完整说明。 使用别名 "参数可为技术交易符号
Blahtech Supply Demand MT5
Blahtech Limited
4.54 (13)
Was: $299  Now: $99   Supply Demand uses previous price action to identify potential imbalances between buyers and sellers. The key is to identify the better odds zones, not just the untouched ones. Blahtech Supply Demand indicator delivers functionality previously unavailable on any trading platform. This 4-in-1 indicator not only highlights the higher probability zones using a multi-criteria strength engine, but also combines it with multi-timeframe trend analysis, previously confirmed swings
Auto Order Block with break of structure based on ICT and Smart Money Concepts (SMC) Futures Break of Structure ( BoS )             Order block ( OB )            Higher time frame Order block / Point of Interest ( POI )    shown on current chart           Fair value Gap ( FVG ) / Imbalance   -  MTF      ( Multi Time Frame )    HH/LL/HL/LH  -  MTF      ( Multi Time Frame )  Choch  MTF      ( Multi Time Frame )  Volume Imbalance     ,  MTF          vIMB Gap’s Power of 3 Equal High
Matrix Arrow Indicator MT5
Juvenille Emperor Limited
5 (12)
矩阵箭头指标 MT5   是一种独特的 10 合 1 趋势,遵循   100% 非重绘多时间框架指标 ,可用于所有符号/工具: 外汇 、 商品 、 加密货币 、 指数 、 股票 。 Matrix Arrow Indicator MT5 将在其早期阶段确定当前趋势,从多达 10 个标准指标中收集信息和数据,它们是: 平均定向运动指数 (ADX) 商品渠道指数 (CCI) 经典 Heiken Ashi 蜡烛 移动平均线 移动平均收敛散度 (MACD) 相对活力指数 (RVI) 相对强弱指数 (RSI) 抛物线SAR 随机振荡器 威廉姆斯的百分比范围 当所有指标给出有效的买入或卖出信号时,相应的箭头将打印在图表上,在下一根蜡烛/柱线开盘时,指示强劲的上升趋势/下降趋势。用户可以选择使用哪些指标,并可以单独调整每个指标的参数。 Matrix Arrow Indicator MT5 仅从选定的指标中收集信息,并仅根据其数据打印箭头。   Matrix Arrow Indicator MT5   还可以为所有新信号发送终端、推送通知或电子邮件警报。无论您是黄牛、日内交易者还是波段交易者, Mat
Entry Points Pro for MT5
Yury Orlov
4.46 (124)
这款指标用于 MT5,可提供准确的入场交易信号,且无重绘。 它可应用在任何金融资产:外汇、加密货币、贵金属、股票、指数。 它将提供极其精准的评估,并告诉您何时开仓和平仓的最佳时机。 观看 视频 (6:22),其中包含一个仅处理单一信号的示例,该信号即可值回指标购价! 大多数交易者在 Entry Points Pro 指标的帮助下,在第一个交易周内即改善了他们的交易结果。 订阅我们的 Telegram 群 ! Entry Points Pro 指标的益处。 入场信号无重绘 如果信号出现,并得到确认,则它不会再消失;不像是重绘指标,它会导致重大的财产损失,因为它们可以在显示信号后再将其删除。 无差错开仓 指标算法可令您找到入场交易(买入或卖出资产)的理想时机,从而提高每位交易者的成功率。 Entry Points Pro 可操作任何资产 它允许您在 MT5 平台上交易任何经纪商的加密货币、股票、贵金属、指数、大宗商品和货币。 提供任何方向的信号 Entry Points Pro 指标提供针对任意价格走势的入场交易信号 - 上涨、下跌或横盘(横向)。
FxaccurateLS
Shiv Raj Kumawat
WHY IS OUR FXACCCURATE LS MT5 THE PROFITABLE ? PROTECT YOUR CAPITAL WITH RISK MANAGEMENT Gives entry, stop and target levels from time to time. It finds Trading opportunities by analyzing what the price is doing during established trends. POWERFUL INDICATOR FOR A RELIABLE STRATEGIES We have made these indicators with a lot of years of hard work. It is made at a very advanced level. Established trends provide dozens of trading opportunities, but most trend indicators completely ignore them!
AT Forex Indicator MT5
Marzena Maria Szmit
5 (4)
The AT Forex Indicator MT5 is a sophisticated trading tool designed to provide traders with a comprehensive analysis of multiple currency pairs. This powerful indicator simplifies the complex nature of the forex market, making it accessible for both novice and experienced traders. AT Forex Indicator uses advanced algorithms to detect trends, patterns and is an essential tool for traders aiming to enhance their forex trading performance. With its robust features, ease of use, and reliable signal
Black Dragon indicator mt5
Ramil Minniakhmetov
4.81 (53)
趋势检测指标将补充任何策略,也可用作独立工具。   好处 易于使用,不会因不必要的信息而使图表过载; 可用作任何策略的过滤器; 具有内置的动态支撑和阻力水平,可用于获利和设置止损; 指标在烛台关闭后不会改变颜色;  适用于股票市场、指数、石油、黄金和所有时间范围; 具有吐司通知、邮件通知、推送通知和声音提醒功能。 我的其他开发可以在这里找到: https://www.mql5.com/zh/users/mechanic/seller 输入参数 Alert - 开/关。警报; Push Notification - 开/关。推送通知; Mail - 开/关电子邮件通知; Fibo 1,2,3,4,5,6,7,11,21,31,41,51,61,71 - 动态支撑和阻力位的设置。
ICT, SMC, SMART MONEY CONCEPTS, SMART MONEY, Smart Money Concept, Support and Resistance, Trend Analysis, Price Action, Market Structure, Order Blocks, BOS/CHoCH,   Breaker Blocks ,  Momentum Shift,   Supply&Demand Zone/Order Blocks , Strong Imbalance,   HH/LL/HL/LH,    Fair Value Gap, FVG,  Premium  &   Discount   Zones, Fibonacci Retracement, OTE, Buy Side Liquidity, Sell Side Liquidity, BSL/SSL Taken, Equal Highs & Lows, MTF Dashboard, Multiple Time Frame, BigBar, HTF OB, HTF Market Structure
Advanced Supply Demand MT5
Bernhard Schweigert
4.5 (14)
任何新手或专业交易者的最佳解决方案! 该指标是一款独特、高质量、且价格合理的交易工具,因为我们已经整合了许多专有功能和新公式。 依据此更新,您将能够显示双重时间帧区域。 您不仅可以显示一个较高的时间帧,还可以同时显示图表时间帧,加上更高的时间帧:显示嵌套时区。 供需双方所有交易者都会喜欢它。 :) 重要信息披露 高级供需的最大潜力,请访问 https://www.mql5.com/zh/blogs/post/720245   想象您的交易如何得以改善,是因为您能够精准定位入场或目标位吗? 构建于新的底层算法,它可以更轻松地识别出买卖双方之间的潜在失衡。 这是因为它以图形方式展示供需最强劲区域,及其过去的表现(显示旧区域)。 这些功能旨在帮助您更轻松地发现最佳入场区域和价位。 现在您可以针对您的交易品种和时间帧来优化和编辑区域强度! 高级供需指标适用于所有产品和时间帧。 它是一个新的公式,非常新的功能是两个区域强度函数可由用户输入进行调整! 这在交易中是一大优势。 当您学习如何使用专有功能,例如带有价格游离最小 X 因子的区域强度时,您能够判断该区域强劲与否。 供需区域用作警报触发器
TPA True Price Action indicator reveals the true price action of the market makers through 100% non-repainting signals strictly at the close of a candle! TPA shows entries and re-entries, every time the bulls are definitely stronger than the bears and vice versa. Not to confuse with red/green candles. The shift of power gets confirmed at the earliest stage and is ONE exit strategy of several. There are available now two free parts of the TPA User Guide for our customers. The first "The Basics"
XQ Indicator MetaTrader 5
Marzena Maria Szmit
3 (2)
Step into the realm of Forex trading with confidence and precision using XQ, a cutting-edge Forex indicator designed to elevate your trading game to unprecedented heights. Whether you're a seasoned trader or just stepping into the world of currency exchange, XQ Forex Indicator empowers you with the insights and signals needed to make informed trading decisions. The signal conditions are a combination of three indicators, and XQ Forex Indicator only display  medium and long-term trends . The ind
PZ Swing Trading MT5
PZ TRADING SLU
5 (4)
Swing Trading 是第一个旨在检测趋势方向的波动和可能的反转波动的指标。它使用在交易文献中广泛描述的基准摆动交易方法。该指标研究多个价格和时间向量,以追踪总体趋势方向,并检测市场超卖或超买并准备好进行修正的情况。 [ 安装指南 | 更新指南 | 故障排除 | 常见问题 | 所有产品 ] 市场波动的利润不会被窃取 指示器始终显示趋势方向 彩色价格带代表机会基准 彩色虚线表示可能的反转波动 该指标分析其自身的质量和性能 它实现了一个多时间仪表板 可定制的趋势和波动周期 它实现了电子邮件/声音/推送警报 指示器为非重涂或重涂 什么是摇摆交易 摇摆交易是一种尝试在一天到一周内从证券中获得收益的交易方式,尽管某些交易最终可以保持更长的寿命。摇摆交易者使用技术分析来买入弱点和卖出力量,并有耐心等待这些机会的发生,因为在发生一波抛售浪潮之后购买证券而不是陷入抛售更有意义。 机会基准 关于历史数据的大量研究证明,适合于波动交易的市场倾向于在基线价格带上下交易,基线价格带由图表显示,使用平均真实区间计算得出。波动交易者使用基线,该策略是购买常态和卖出躁狂,或做空常态并掩盖沮丧。
可以说,这是您可以为MetaTrader平台找到的最完整的谐波价格形成自动识别指标。它检测19种不同的模式,像您一样认真对待斐波那契投影,显示潜在的反转区域(PRZ),并找到合适的止损和获利水平。 [ 安装指南 | 更新指南 | 故障排除 | 常见问题 | 所有产品 ] 它检测19种不同的谐波价格形态 它绘制了主要,衍生和互补的斐波那契投影(PRZ) 它评估过去的价格走势并显示每个过去的形态 该指标分析其自身的质量和性能 它显示合适的止损和获利水平 它使用突破来表明合适的交易 它在图表上绘制所有样式比率 它实现了电子邮件/声音/视觉警报 受斯科特·M·卡尼(Scott M. Carney)的书的启发,该指标旨在满足最纯粹和最熟练的交易者的需求。但是,它采取了一种使交易更容易的方式:在向交易发出信号之前,它会等待Donchian朝正确方向突破,从而使交易信号非常可靠。 斐波那契投影与向量无关 它实现了电子邮件/声音/推送警报 它绘制了ABCD投影 重要提示: 为了符合 Scott M. Carney先生 的商标申诉,某些图案名称已重命名为不言自明的替代方式, Scot
FX Volume MT5
Daniel Stein
4.93 (14)
通过 mql5 和 Telegram 上 的 " 晨间简报 "获取每日市场更新,包括详细信息和屏幕截图 ! 外汇交易量(FX Volume)是第一个也是唯一一个从经纪商角度真正洞察市场情绪的交易量指标。 直接在您的图表上看到这些信息是真正改变游戏规则和突破性的交易解决方案。 受益于独特的市场数据洞察,如 比率(Ratios )显示货币多头和空头头寸的比率(百分比 比率变化 显示所选时间段内的多头比率及其百分比变化 总交易量 显示货币的总交易量(多头和空头),以手为单位 多头 交易量显示货币所有多头头寸的交易量 空头 交易量显示所有货币空头头寸的交易量 净多头 显示净多头交易量,即所有多头头寸减去所有空头头寸(以手为单位)。 净多头百分比 显示货币净多头交易量的变化 请阅读我们的基本教程 -> "如何使用外汇交易量进行交易 " 获取更多信息,如常见问题、交易技巧和教程视频,请访问我们的 外汇交易量公共信息频道 请 安装并运行 SI Connect 以建立与我们数据中心的持续连接 背景信息 我们都知道,外汇是一个分散的市场。这就是为什么我们必须打破常规思维,开发一个独
Noize Absorption Index
Ekaterina Saltykova
Noize Absorption Index - is the manual trading system that measures the difference of pressure between bears forces and bulls forces. Green line - is a noize free index that showing curent situation. Zero value of index shows totally choppy/flat market.Values above zero level shows how powerfull bullish wave is and values below zero measures bearish forces.Up arrow appears on bearish market when it's ready to reverse, dn arrow appears on weak bullish market, as a result of reverse expectation.
作者的更多信息
Geo Info
Georgij Komarov
5 (3)
Geo_Info is one of the most informative indicators displaying net levels as well as basic data on a symbol and trading positions in a space-saving manner. displays brief data on the basic symbol parameters in the upper left corner of the chart: Swap for Buy order, swap for Sell order, current spread, margin, tick size, stop level, order freeze level . The data is shown for one lot in points. The data is displayed as follows: SWAP B:4.200 /S:-8.470 /SPR:342 /MRG:256.0/TCV:0.10/STL:0/FRL The data
FREE
GeoStochPro
Georgij Komarov
5 (1)
Geo_StochPro is a profile, or professional Stochastic. Geo_StochPro is one of the well-known currency profile indicators. It displays two Stochastic indicators on all timeframes and multiple currency pairs forming the currency profile in the matrix form simultaneously . Thus, you can see the current state of the selected instrument as well as other pairs containing that instrument (overbought/oversold) without switching timeframes. The indicator is perfect for scalpers, intraday and medium-term
Geo Fractals
Georgij Komarov
5 (1)
分形的专业指标。在一个打开的图表上提供“多屏幕”操作模式。 专为黄牛和“精确”作品的爱好者而设计。 显示六个时间范​​围内的分形,并在较低的时间范围内显示从价格到新出现的分形的距离,这提供了价格行为的透明性以及在支点处监视价格行为的独特准确性。 指示器同时显示分形和时间范围 W1.D1,H4,H1,M15,M5,M1。 要选择显示所需的时间范围,请使用相应的指标参数: ShowW1=true; ShowD1 = true; ShowH4 = true; ShowH1 = true; ShowM15 = true; ShowM5 = true; ShowM1 = true; 对于M1和M5时间范围,与价格的距离(买入价和卖价)以点为单位显示。 如果分形没有被价格打折,则会以虚线显示。工具提示指示线条是否属于时间范围。 破碎的分形显示为实线,并用文本标签标记,表明该线属于相应的时间范围。 您将能够通过分形线的价格或无法突破该水平的价格来固定即时联系,并在此基础上决定进一步的价格行为。 仅一个参数用作输入参数:是否添加1点(五位数字仪器为10点)来显示分形
GeoWprPro
Georgij Komarov
WPR by Profile, or WPR for Professionals Geo_WprPro is one of the well-known currency profile indicators. It simultaneously displays two WPR indicators with different parameters in the matrix form on all timeframes of multiple currency pairs forming the currency profile . As follows from the description, " WPR is a leading indicator that often goes ahead of the price chart. The oscillator frequently reaches extreme values before the price reversal as if anticipating that event: it almost always
筛选:
无评论
回复评论
版本 1.1 2023.07.27
Bags fixed