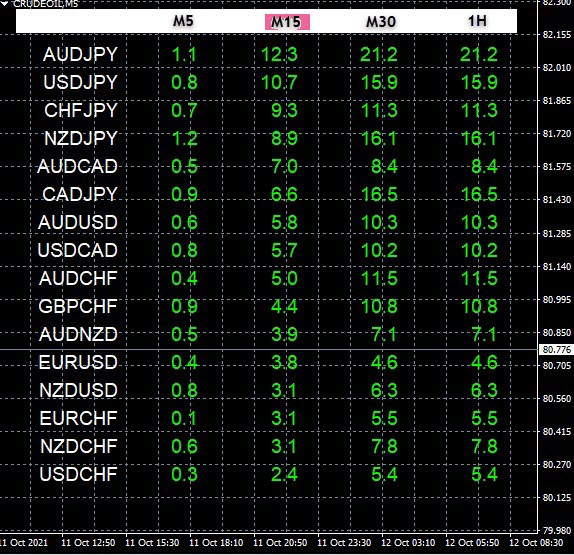
I have now finalized the specification. I use MT4 platform. My language is English. I need an indicator which measures the absolute volatility of a currency pair in various time periods. Absolute volatility is defined by (highest price -lowest price) in a specific time period. The indicator is a matrix where each row is a currency pair (for example AUDJPY), each column is a time period (for example M5) and each element of the matrix is volatility measured in fractional pips. I have attached a screenshot. If we click on a column header (for example M15), the column header will be highlighted in red color and sort rows according to the volatility values in descending order.
Parameters’ specification:
* Currency pairs should be specified in a comma separated list.
* Time periods should be specified in a comma separated list.
* Volatility should always be shown in descending order.
* Volatility should be shown in fractional pips. ie "10.1"
* Gap between two columns should be a variable.
* Row height should be a variable.
* X & Y are measured from the top left corner.
* Font sizes of currency pairs, column header and volatility numerals should be the same. This font size should be a variable.
* Color scheme - (A) Background black, (B) currency pair & column headers white, (C) selected time period is highlighted in red and (D) volatility numerals lime. Clicking on a currency pair should color it magenta so that I can track the volatility of a specific currency pair. Clicking anywhere else should remove the color and the currency pair will become white.
* For easier reading there should be grid lines in Light Slate Gray.
* Currency pair names should be left adjusted.
* Volatility figures should be right adjusted.
* Scan frequency should be a variable.
* There should be a "Scan Now" button in the GUI. Location of this button should be decided by the developer, subject to my approval.
* Accuracy measurement - I intend to start the indicator when I start my trading day. It remains open till I finish my trading for the day. I will take a screen video. Except at the start, volatility values of a currency pair should not be the same across all the time periods.
***********************************************
I have been asked two questions which merit answers.
First question: There is something that is not clear which is the volatility calculation. If as example we wanted to display the volatility of 1H time frame, would it be calculated as the high - low of the last candle? or different calculation?
My answer: For example for 1H, each scan should pick up the highest and lowest price within the period of last 1 hour and the difference in price measured in fractional pips will give us the volatility. Thus, volatility values will change after each scan
2nd question: Shouldn't you be normalizing the equation, i.e. (high-low)/high? Especially if you are interested in comparing different symbols
My answer: No I do not need normalization. That is why I am calling it "Absolute Volatility"
相似订单
Required to develop expert advisory which will work on any pair including crypto , forex, gold, silver, oil, simple stragy which will work on RSI,GRID, take profit, grid distance, start and stop button, only buy and only sell, filter for time frame Like 5m to 4 hr. stop loss and take profit .Detail will be shared once you except order
Hello, I am looking for a professional programmer to create a trading expert on the MT4 platform, integrating it with ChatGPT to analyze currencies using various methods to make the right trading decisions. Further details will be provided to the applicants later
dreams good and have a great Cash out from your smart phone , tuyoywuiy glamorous flood see full idk idk slow so dolls stupid sis workouts who's spark koalas oral waits also doggo idk
NRTR - indicator for MetaTrader 5 NRTR (Nick Rypock Trailing Reverse) - indicator for MetaTrader 4 NRTR WATR - indicator for MetaTrader 4 NRTR GATOR - indicator for MetaTrader 5 X2MA NRTR - indicator for MetaTrader 5 NRTR - indicator for MetaTrader 5 NRTR GATOR - indicator for MetaTrader 4 NRTR - indicator for MetaTrader 4 Stalin_NRTR - indicator for MetaTrader 5 NRTR Color Line - indicator for MetaTrader 5 NRTR Rosh
I need an EA edited to make TWO main changes to conditions for how it enters trades. The EA code is written with clean code and is well commented. Will provide more info on changes in a doc in the chat
Create an Expert Advisor that collaborates between these indicators ETR, MEv2 and STLv3 with these features 1. SL and TP 2. TIME FILTER 3. ETR, MEv2 and STLv3 PARAMETERS BUY ENTRY STEP 1. FIRST candle OPEN above Symphonie Trend Line STEP 2. Check Symphonie Extreme must indicate color BLUE STEP 3. Check Symphonie Emotion must indicate color BLUE STEP 4. Open trade with money management STEP 5. Trade open MUST BE 1
It is using EMA/SMA for triggers of long or short (green long/red short) and the line above or below is the stop loss, profit triggers would need to figure out or allow it until next trigger. Already in thinkscript And add parameters
Dear , I hope this message finds you well. I would like to request the development of a trading robot (Expert Advisor) that incorporates the following strategies and features: Strategy Requirements: 1. Martingale Strategy: The robot should include a Martingale system to increase trade sizes after losses in order to recover losses and generate profit. 2. Trend-Following: It should also be able to detect and follow
I have 2 (indicators) I coded and I use on Tradingview I just need converted to use on Ninjatrader i will be looking for great developer to bid for it and for more details
in this document i have explained the EA requirements in details and given some pictures of needed options . please Grid EA expert apply to my job . and do not come with no experience. https://docs.google.com/document/d/1Y_Vbv87Ep5BQavRxgDlsWT7GH5VjSgVDnm6C1wtVtj0/edit?usp=sharing i can pay 30 USD now but later on if EA get successful . i'll gift with tip of 50 USD after successful month