指定
Scenario 1
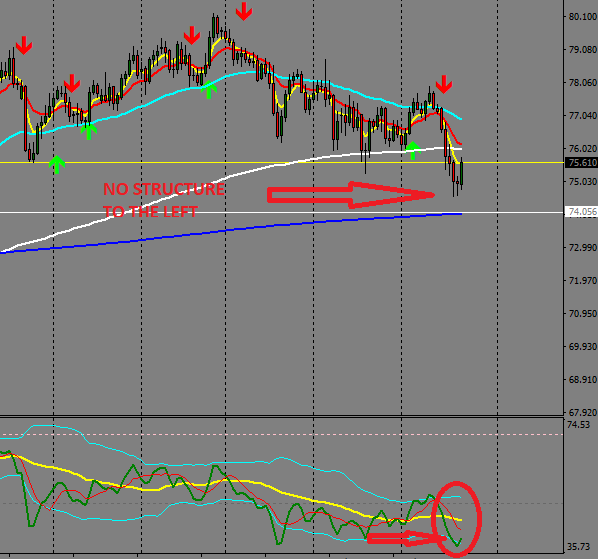
1. Daily Chart: TDI Must be at OB(Out of Bound) with no near structure to the left
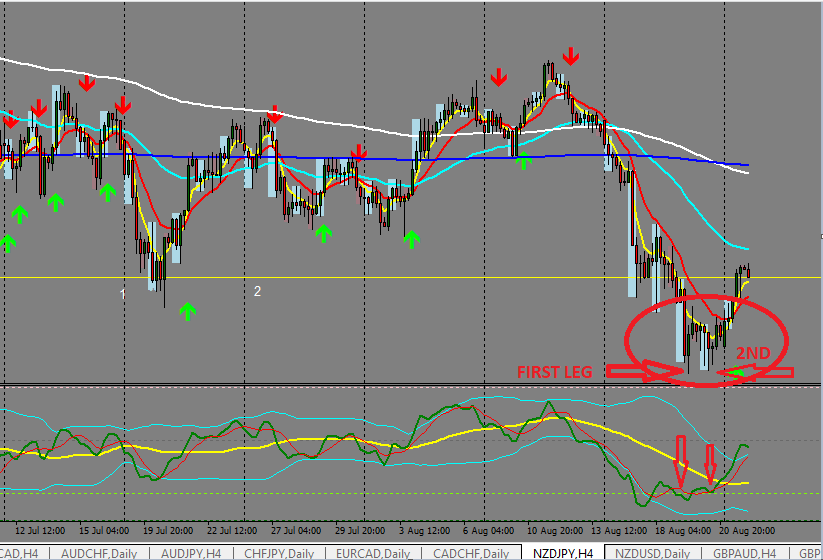
2. 4Hour Chart: First level OB in 4hr is seen already as price has put in the first leg. The second push of price to the same level is seen with a potential divergence forming. After the first leg is formed, the second leg MUST BE ON SAME LINE AS FIRST ON THE 4HR
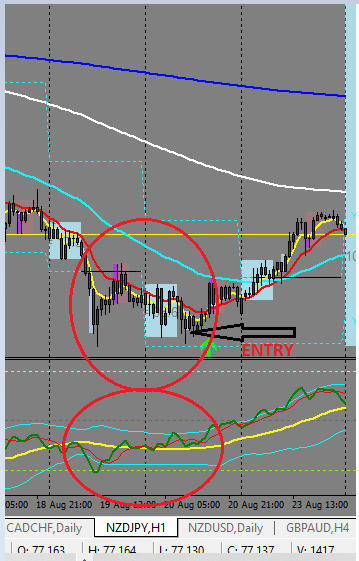
3. 1hr chart - Similar situation will be seen as seen from the 4hr
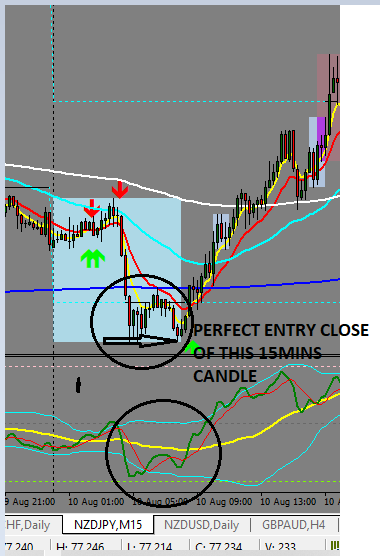
4. 15mins - Divergence in price MUST OCCUR for an entry. That is TDI is heading down as Price is heading up. For divergence to occur, first leg on 15mins is heading up with TDI up but second leg of price is heading up but TDI is heading down as price close lower.
Scenario 2
1. Daily Chart: TDI Must be at OB(Out of Bound) with no near structure to the left. Second leg of price at the same level with first leg with TDI Divergence as TDI is lower compared to price behavior.
2. 4Hour Chart: First level OB in 4hr is seen already as price has put in the first leg. The second push of price to the same level is seen with a potential divergence forming. After the first leg is formed, the second leg MUST BE ON SAME LINE AS FIRST ON THE 4HR
3. 1hr chart - Similar situation will be seen as seen from the 4hr
4. 15mins - Divergence in price MUST OCCUR for an entry. That is TDI is heading down as Price is heading up. For divergence to occur, first leg on 15mins is heading up with TDI up but second leg of price is heading up but TDI is heading down as price close lower.
Scenario 3
1. Daily Chart: Price is at a highest high with no outside structure to the left and TDI is seen at the high too. After some days of retracement, price again pushes HIGHER THAN THE FIRST LEG with a minimum of 2 daily to 3daily push but this time TDI is lower than the first legs TDI creating a wide range divergence.
2. 4Hour Chart: First level OB in 4hr is seen already as price has put in the first leg. The second push of price to the same level is seen with a potential divergence forming. After the first leg is formed, the second leg MUST BE ON SAME LINE AS FIRST ON THE 4HR
3. 1hr chart - Similar situation will be seen as seen from the 4hr
4. 15mins - Divergence in price MUST OCCUR for an entry. That is TDI is heading down as Price is heading up. For divergence to occur, first leg on 15mins is heading up with TDI up but second leg of price is heading up but TDI is heading down as price close lower.
Scenario 4
1. Daily Chart: Price is at a highest high with no outside structure to the left and TDI is seen at the high too. After some days of retracement, price again pushes HIGHER THAN THE FIRST LEG with a minimum of 2 daily to 3daily push but this time TDI is lower than the first legs TDI creating a wide range divergence. Then price again retraces lower after some days and this time price again pushes to the top HIGHER THAN ALL THE PREVIOUS HIGHS but TDI at this highest high is LOWER THAN ALL THE FIRST TWO TDI.
2. 4Hour Chart: First level OB in 4hr is seen already as price has put in the first leg. The second push of price to the same level is seen with a potential divergence forming. After the first leg is formed, the second leg MUST BE ON SAME LINE AS FIRST ON THE 4HR
3. Similar situation will be seen as seen from the 4hr
4. 15mins - Divergence in price MUST OCCUR for an entry. That is TDI is heading down as Price is heading up. For divergence to occur, first leg on 15mins is heading up with TDI up but second leg of price is heading up but TDI is heading down as price close lower.
Scenario 5 -
Daily Chart: Price is at the highest high with no outside structure. Price now decides to fall and starts to form days of lower low confirming the sell is in play. Now price fell to the 50EMA and BOUNCES OFF of the 50EMA on the daily chart. As price retraces it will get to the 13EMA (signal line)
1hr - Divergence will be seen coming in here as a first leg has been put in already with a second leg been formed.
15mins - The entry is confirmed on divergence to price on the 15mins