Gartley 222
谁能从Tradestation转换到Metatrader,这是代码。
在Aaron Behle和Mark Conway的 "Trading the Gartley 222" 中找到了Gartley 222形态的TradeStation代码,第38页。
Inputs:
Length(100),
Strength(8),
Tolerance(0.10),
BullColor(Blue),
BearColor(Red);
Variables:
F1(0.618),
F2(0.786),
F3(1.27),
F4(1.618),
P1Bar(-1),
P2Bar(-1),
T1Bar(-1),
T2Bar(-1),
P1(0.0),
P2(0.0),
T1(0.0),
T2(0.0),
PTValid(False),
HLValid(False),
InZone(False),
GD(0.0),
XA(0.0),
AB(0.0),
BC(0.0),
CD(0.0),
AD(0.0),
C1(False),
C2(False),
C3(False),
C4(False),
ABdXA(0.0),
BCdAB(0.0),
CDdBC(0.0),
ADdXA(0.0),
TL1(-1),
TL2(-1),
TL3(-1),
TL4(-1),
TL5(-1),
TL6(-1);
P1Bar = SwingHighBar(1, High, Strength, Length);
P2Bar = SwingHighBar(2, High, Strength, Length);
T1Bar = SwingLowBar(1, Low, Strength, Length);
T2Bar = SwingLowBar(2, Low, Strength, Length);
If P1Bar -1 and
P2Bar -1 and
T1Bar -1 and
T2Bar -1 Then Begin
{Test for a bullish 222}
{Trough X is T2}
T2 = Low[T2Bar];
{Peak A is P2}
P2 = High[P2Bar];
{Trough B is T1}
T1 = Low[T1Bar];
{Peak C is P1}
P1 = High[P1Bar];
{D is the buy point}
GD = Low;
PTValid = P1Bar < T1Bar and T1Bar < P2Bar and P2Bar < T2Bar;
HLValid = P1 T2 and P1 > T1;
InZone = GD T2 and P2 >= Highest(High, T2Bar);
If PTValid and HLValid and InZone Then Begin
XA = P2 - T2;
AB = P2 - T1;
BC = P1 - T1;
CD = P1 - GD;
AD = P2 - GD;
ABdXA = AB / XA; {AB should be 61.8% of XA}
C1 = ABdXA > F1 - Tolerance and ABdXA < F1 + Tolerance;
BCdAB = BC / AB; {BC should be 61.8-78.6% of AB}
C2 = BCdAB > F1 - Tolerance and BCdAB < F2 + Tolerance;
CDdBC = CD / BC; {CD should be 127-161.8% of BC}
C3 = CDdBC > F3 - Tolerance and CDdBC < F4 + Tolerance;
ADdXA = AD / XA; {AD should be 78.6% of XA}
C4 = ADdXA > F2 - Tolerance and ADdXA < F2 + Tolerance;
If C1 and C2 and C3 and C4 Then Begin
TL1 = TL_New(Date[T2Bar], Time[T2Bar], T2, Date[P2Bar], Time[P2Bar], P2);
If TL1 >= 0 Then Begin
TL_SetColor(TL1, BullColor);
TL_SetStyle(TL1, Tool_Solid);
TL_SetSize(TL1, 2);
End;
TL2 = TL_New(Date[P2Bar], Time[P2Bar], P2, Date[T1Bar], Time[T1Bar], T1);
If TL2 >= 0 Then Begin
TL_SetColor(TL2, BullColor);
TL_SetStyle(TL2, Tool_Solid);
TL_SetSize(TL2, 2);
End;
TL3 = TL_New(Date[T1Bar], Time[T1Bar], T1, Date[P1Bar], Time[P1Bar], P1);
If TL3 >= 0 Then Begin
TL_SetColor(TL3, BullColor);
TL_SetStyle(TL3, Tool_Solid);
TL_SetSize(TL3, 2);
End;
TL4 = TL_New(Date[P1Bar], Time[P1Bar], P1, Date, Time, GD);
If TL4 >= 0 Then Begin
TL_SetColor(TL4, BullColor);
TL_SetStyle(TL4, Tool_Solid);
TL_SetSize(TL4, 2);
End;
TL5 = TL_New(Date[T1Bar], Time[T1Bar], T1, Date, Time, GD);
If TL5 >= 0 Then Begin
TL_SetColor(TL5, BullColor);
TL_SetStyle(TL5, Tool_Dotted);
End;
TL6 = TL_New(Date[T2Bar], Time[T2Bar], T2, Date, Time, GD);
If TL6 >= 0 Then Begin
TL_SetColor(TL6, BullColor);
TL_SetStyle(TL6, Tool_Dotted);
End;
End;
End;
{Test for a bearish 222}
{Peak X is P2}
{Trough A is T2}
{Peak B is P1}
{Trough C is T1}
{GD is the short point}
GD = High;
PTValid = T1Bar < P1Bar and P1Bar < T2Bar and T2Bar < P2Bar;
HLValid = T1 > T2 and P1 < P2 and T1 < P1;
InZone = GD > P1 and GD < P2 and T2 <= Lowest(Low, P2Bar);
If PTValid and HLValid and InZone Then Begin
XA = P2 - T2;
AB = P1 - T2;
BC = P1 - T1;
CD = GD - T1;
AD = GD - T2;
ABdXA = AB / XA; {AB should be 61.8% of XA}
C1 = ABdXA > F1 - Tolerance and ABdXA < F1 + Tolerance;
BCdAB = BC / AB; {BC should be 61.8-78.6% of AB}
C2 = BCdAB > F1 - Tolerance and BCdAB < F2 + Tolerance;
CDdBC = CD / BC; {CD should be 127-161.8% of BC}
C3 = CDdBC > F3 - Tolerance and CDdBC < F4 + Tolerance;
ADdXA = AD / XA; {AD should be 78.6% of XA}
C4 = ADdXA > F2 - Tolerance and ADdXA < F2 + Tolerance;
If C1 and C2 and C3 and C4 Then Begin
TL1 = TL_New(Date[P2Bar], Time[P2Bar], P2, Date[T2Bar], Time[T2Bar], T2);
If TL1 >= 0 Then Begin
TL_SetColor(TL1, BearColor);
TL_SetStyle(TL1, Tool_Solid);
TL_SetSize(TL1, 2);
End;
TL2 = TL_New(Date[T2Bar], Time[T2Bar], T2, Date[P1Bar], Time[P1Bar], P1);
If TL2 >= 0 Then Begin
TL_SetColor(TL2, BearColor);
TL_SetStyle(TL2, Tool_Solid);
TL_SetSize(TL2, 2);
End;
TL3 = TL_New(Date[P1Bar], Time[P1Bar], P1, Date[T1Bar], Time[T1Bar], T1);
If TL3 >= 0 Then Begin
TL_SetColor(TL3, BearColor);
TL_SetStyle(TL3, Tool_Solid);
TL_SetSize(TL3, 2);
End;
TL4 = TL_New(Date[T1Bar], Time[T1Bar], T1, Date, Time, GD);
If TL4 >= 0 Then Begin
TL_SetColor(TL4, BearColor);
TL_SetStyle(TL4, Tool_Solid);
TL_SetSize(TL4, 2);
End;
TL5 = TL_New(Date[P1Bar], Time[P1Bar], P1, Date, Time, GD);
If TL5 >= 0 Then Begin
TL_SetColor(TL5, BearColor);
TL_SetStyle(TL5, Tool_Dotted);
End;
TL6 = TL_New(Date[P2Bar], Time[P2Bar], P2, Date, Time, GD);
If TL6 >= 0 Then Begin
TL_SetColor(TL6, BearColor);
TL_SetStyle(TL6, Tool_Dotted);
End;
End;
End;
End;[/CODE]
Or from Wealth-Lab code to metatrader4:
[CODE]procedure Gartley222
(
VPFactor: float;
Tolerance: float;
Lookback: integer;
HoldBars: integer;
VolMin: integer
);
begin
var ATRValue, VP, Reversal: float;
var F1, F2, F3, F4, P1, P2, T1, T2: float;
var Bar, P1Bar, P2Bar, T1Bar, T2Bar, p: integer;
var XA, AB, BC, CD, AD, D, XD, DT, ABdXA, BCdAB, CDdBC, ADdXA: float;
var PTValid, HLValid, InZone, C1, C2, C3, C4: boolean;
var BT, BS, ST, SS: float;
{Fibonacci Constants}
F1 := 0.618;
F2 := 0.786;
F3 := 1.27;
F4 := 1.618;
InstallTimeBasedExit(HoldBars);
for Bar := Lookback to BarCount() - 1 do
begin
ApplyAutoStops(Bar);
ATRValue := ATR(Bar, Lookback);
SetShareSize( 1000 * Int( 10 / ATRValue ) );
VP := 100 * ATRValue / PriceClose(Bar);
{Find peaks and troughs}
Reversal := Int(VPFactor * VP);
P1 := Peak(Bar, #High, F1 * Reversal);
P1Bar := PeakBar(Bar, #High, F1 * Reversal);
P2 := Peak(P1Bar, #High, Reversal);
P2Bar := PeakBar(P1Bar, #High, Reversal);
T1 := Trough(Bar, #Low, F1 * Reversal);
T1Bar := TroughBar(Bar, #Low, F1 * Reversal);
T2 := Trough(T1Bar, #Low, Reversal);
T2Bar := TroughBar(T1Bar, #Low, Reversal);
{Test for a bullish 222}
{Trough X is T2}
{Peak A is P2}
{Trough B is T1}
{Peak C is P1}
{D is the buy zone}
D := PriceLow(Bar);
PTValid := (P1Bar > T1Bar) and (T1Bar > P2Bar) and (P2Bar > T2Bar);
HLValid := (P1 T2) and (P1 > T1);
InZone := (D T2);
if (MarketPosition = 0) and
(SMA(Bar, #Volume, Lookback) >= VolMin) and
(PTValid) and (HLValid) and (InZone) then
begin
XA := P2 - T2;
AB := P2 - T1;
BC := P1 - T1;
XD := P2 - (F2 * XA);
CD := P1 - XD;
AD := P2 - XD;
ABdXA := AB / XA; {AB should be 61.8% of XA}
C1 := (ABdXA > F1 - Tolerance) and (ABdXA < F1 + Tolerance);
BCdAB := BC / AB; {BC should be 61.8-78.6% of AB}
C2 := (BCdAB > F1 - Tolerance) and (BCdAB < F2 + Tolerance);
CDdBC := CD / BC; {CD should be 127-161.8% of BC}
C3 := (CDdBC > F3 - Tolerance) and (CDdBC < F4 + Tolerance);
ADdXA := AD / XA; {AD should be 78.6% of XA}
C4 := (ADdXA > F2 - Tolerance) and (ADdXA < F2 + Tolerance);
if C1 and C2 and C3 and C4 then
begin
DrawLine(P2Bar, P2, T2Bar, T2, 0, #Blue, #Solid);
DrawLine(T1Bar, T1, P2Bar, P2, 0, #Blue, #Solid);
DrawLine(P1Bar, P1, T1Bar, T1, 0, #Blue, #Solid);
DrawLine(Bar, D, P1Bar, P1, 0, #Blue, #Solid);
DrawLine(Bar, D, T1Bar, T1, 0, #Blue, #Dotted);
DrawLine(Bar, D, T2Bar, T2, 0, #Blue, #Dotted);
AnnotateBar('B', Bar, True, #Blue, 10);
BuyAtLimit(Bar, XD, 'G222 LE');
DT := F1 * CD;
BT := XD + DT;
BS := T2;
end;
end;
{Test for a bearish 222}
{Peak X is P2}
{Trough A is T2}
{Peak B is P1}
{Trough C is T1}
{D is the short zone}
D := PriceHigh(Bar);
PTValid := (T1Bar > P1Bar) and (P1Bar > T2Bar) and (T2Bar > P2Bar);
HLValid := (T1 > T2) and (P1 < P2) and (T1 < P1);
InZone := (D > P1) and (D < P2);
if (MarketPosition = 0) and
(PriceClose( Bar ) >= 5) and
(SMA(Bar, #Volume, Lookback) >= VolMin) and
(PTValid) and (HLValid) and (InZone) then
begin
XA := P2 - T2;
AB := P1 - T2;
BC := P1 - T1;
XD := T2 + (F2 * XA);
CD := XD - T1;
AD := XD - T2;
ABdXA := AB / XA; {AB should be 61.8% of XA}
C1 := (ABdXA > F1 - Tolerance) and (ABdXA < F1 + Tolerance);
BCdAB := BC / AB; {BC should be 61.8-78.6% of AB}
C2 := (BCdAB > F1 - Tolerance) and (BCdAB < F2 + Tolerance);
CDdBC := CD / BC; {CD should be 127-161.8% of BC}
C3 := (CDdBC > F3 - Tolerance) and (CDdBC < F4 + Tolerance);
ADdXA := AD / XA; {AD should be 78.6% of XA}
C4 := (ADdXA > F2 - Tolerance) and (ADdXA < F2 + Tolerance);
if C1 and C2 and C3 and C4 then
begin
DrawLine(T2Bar, T2, P2Bar, P2, 0, #Red, #Solid);
DrawLine(P1Bar, P1, T2Bar, T2, 0, #Red, #Solid);
DrawLine(T1Bar, T1, P1Bar, P1, 0, #Red, #Solid);
DrawLine(Bar, D, T1Bar, T1, 0, #Red, #Solid);
DrawLine(Bar, D, P1Bar, P1, 0, #Red, #Dotted);
DrawLine(Bar, D, P2Bar, P2, 0, #Red, #Dotted);
AnnotateBar('S', Bar, False, #Red, 10);
ShortAtLimit(Bar, XD, 'G222 SE');
DT := F1 * CD;
ST := XD - DT;
SS := P2;
end;
end;
if LastPositionActive then
begin
if MarketPosition = 1 then begin
SellAtLimit(Bar+1, BT, #All, 'G222 LX+');
SellAtStop(Bar+1, BS, #All, 'G222 LX-');
end;
if MarketPosition = -1 then begin
CoverAtLimit(Bar+1, ST, #All, 'G222 LX+');
CoverAtStop(Bar+1, SS, #All, 'G222 LX-');
end;
end;
end;
end;
Gartley222(2.0, 0.1, 20, 7, 2000000);嗯,他们应该也提供Metatrader代码,一定有人有这个指标,所以谁有这个指标可以分享?
也许在metatrader4上不可能有这个功能。
也许在metatrader4上不可能有这样的功能。
你好leutzuro。
我知道,鉴于平台提供的开发环境,如MT4,一切皆有可能,我不是一个好的程序员,但我会尝试从这个代码中创造一些东西,谢谢你的分享。
我知道这里有一些伟大的程序员,如果有人能够转换,这将有助于学习和交易。
你好,勒兹罗。
我知道,鉴于平台提供的开发环境(如MT4),一切皆有可能,我不是一个好的程序员,但我会尝试从这些代码中创造一些东西,谢谢你的分享
我知道这里有一些伟大的程序员,如果有人能够转换,这将有助于学习和交易。你好,勒兹罗
 我第一次尝试创建这个指标
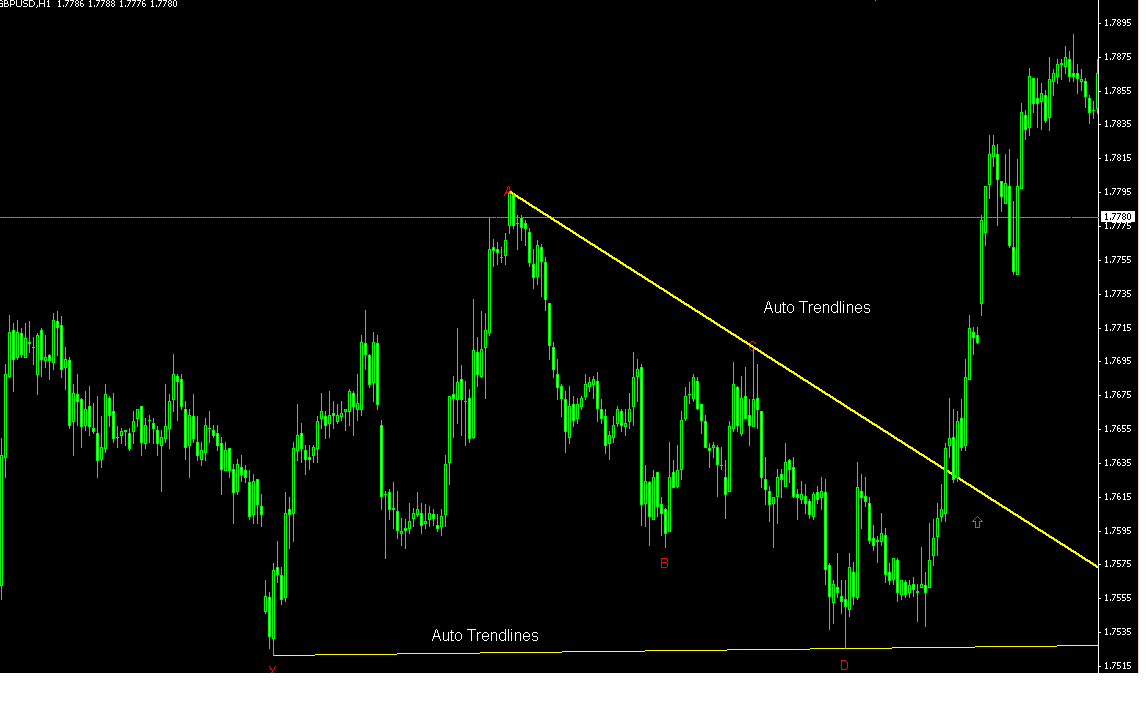
前段时间在1小时内创建了GBP-USD的模式,在1月20日进场(不是Gartley方式,因为我还不能正确编程)
趋势线是自动绘制的
这不是100%的Gartley,也许甚至不是60%,但它在那天起作用了 ,我不擅长编程,并试图用我所拥有的任何知识来解决它。
我不知道如何计算各点之间的距离,这样我就可以开始检查 回调,现在它只给出买入模式。
伟大的工作的人
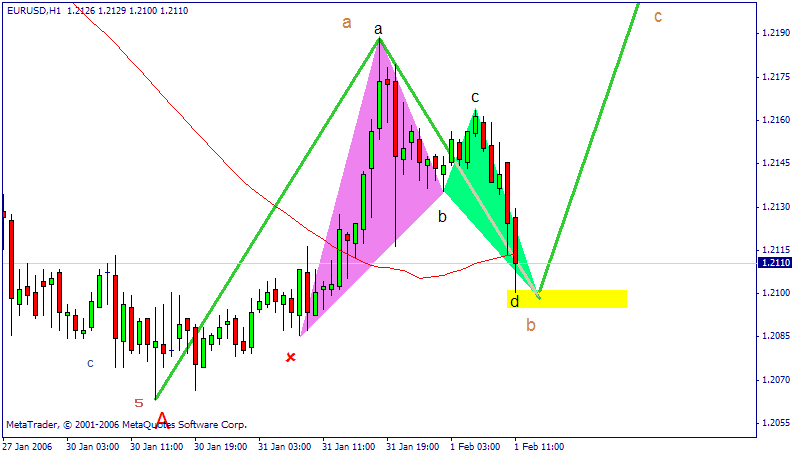
超级新手用你的指标检查欧元/美元,看看是否像这张图那样工作,因为我们现在就有这种模式。
尊敬的先生,您好
没有,没有图案,甚至没有一条线,那是因为它还没有被正确地预测,我在欧元上也有一个信号,最后是1月20日的突破,在那之后就没有了,它就像在睡觉 ,在5分钟内有很多噪音信号,当然它们不工作,肯定有很多错误,我现在正在看。
谁能从Tradestation转换到metatrader,这是代码。
TradeStation的Gartley 222模式的代码,见Aaron Behle和Mark Conway的 "Trading the Gartley 222",第38页。
Inputs:
Length(100),
Strength(8),
Tolerance(0.10),
BullColor(Blue),
BearColor(Red);
Variables:
F1(0.618),
F2(0.786),
F3(1.27),
F4(1.618),
P1Bar(-1),
P2Bar(-1),
T1Bar(-1),
T2Bar(-1),
P1(0.0),
P2(0.0),
T1(0.0),
T2(0.0),
PTValid(False),
HLValid(False),
InZone(False),
GD(0.0),
XA(0.0),
AB(0.0),
BC(0.0),
CD(0.0),
AD(0.0),
C1(False),
C2(False),
C3(False),
C4(False),
ABdXA(0.0),
BCdAB(0.0),
CDdBC(0.0),
ADdXA(0.0),
TL1(-1),
TL2(-1),
TL3(-1),
TL4(-1),
TL5(-1),
TL6(-1);
P1Bar = SwingHighBar(1, High, Strength, Length);
P2Bar = SwingHighBar(2, High, Strength, Length);
T1Bar = SwingLowBar(1, Low, Strength, Length);
T2Bar = SwingLowBar(2, Low, Strength, Length);
If P1Bar -1 and
P2Bar -1 and
T1Bar -1 and
T2Bar -1 Then Begin
{Test for a bullish 222}
{Trough X is T2}
T2 = Low[T2Bar];
{Peak A is P2}
P2 = High[P2Bar];
{Trough B is T1}
T1 = Low[T1Bar];
{Peak C is P1}
P1 = High[P1Bar];
{D is the buy point}
GD = Low;
PTValid = P1Bar < T1Bar and T1Bar < P2Bar and P2Bar < T2Bar;
HLValid = P1 T2 and P1 > T1;
InZone = GD T2 and P2 >= Highest(High, T2Bar);
If PTValid and HLValid and InZone Then Begin
XA = P2 - T2;
AB = P2 - T1;
BC = P1 - T1;
CD = P1 - GD;
AD = P2 - GD;
ABdXA = AB / XA; {AB should be 61.8% of XA}
C1 = ABdXA > F1 - Tolerance and ABdXA < F1 + Tolerance;
BCdAB = BC / AB; {BC should be 61.8-78.6% of AB}
C2 = BCdAB > F1 - Tolerance and BCdAB < F2 + Tolerance;
CDdBC = CD / BC; {CD should be 127-161.8% of BC}
C3 = CDdBC > F3 - Tolerance and CDdBC < F4 + Tolerance;
ADdXA = AD / XA; {AD should be 78.6% of XA}
C4 = ADdXA > F2 - Tolerance and ADdXA < F2 + Tolerance;
If C1 and C2 and C3 and C4 Then Begin
TL1 = TL_New(Date[T2Bar], Time[T2Bar], T2, Date[P2Bar], Time[P2Bar], P2);
If TL1 >= 0 Then Begin
TL_SetColor(TL1, BullColor);
TL_SetStyle(TL1, Tool_Solid);
TL_SetSize(TL1, 2);
End;
TL2 = TL_New(Date[P2Bar], Time[P2Bar], P2, Date[T1Bar], Time[T1Bar], T1);
If TL2 >= 0 Then Begin
TL_SetColor(TL2, BullColor);
TL_SetStyle(TL2, Tool_Solid);
TL_SetSize(TL2, 2);
End;
TL3 = TL_New(Date[T1Bar], Time[T1Bar], T1, Date[P1Bar], Time[P1Bar], P1);
If TL3 >= 0 Then Begin
TL_SetColor(TL3, BullColor);
TL_SetStyle(TL3, Tool_Solid);
TL_SetSize(TL3, 2);
End;
TL4 = TL_New(Date[P1Bar], Time[P1Bar], P1, Date, Time, GD);
If TL4 >= 0 Then Begin
TL_SetColor(TL4, BullColor);
TL_SetStyle(TL4, Tool_Solid);
TL_SetSize(TL4, 2);
End;
TL5 = TL_New(Date[T1Bar], Time[T1Bar], T1, Date, Time, GD);
If TL5 >= 0 Then Begin
TL_SetColor(TL5, BullColor);
TL_SetStyle(TL5, Tool_Dotted);
End;
TL6 = TL_New(Date[T2Bar], Time[T2Bar], T2, Date, Time, GD);
If TL6 >= 0 Then Begin
TL_SetColor(TL6, BullColor);
TL_SetStyle(TL6, Tool_Dotted);
End;
End;
End;
{Test for a bearish 222}
{Peak X is P2}
{Trough A is T2}
{Peak B is P1}
{Trough C is T1}
{GD is the short point}
GD = High;
PTValid = T1Bar < P1Bar and P1Bar < T2Bar and T2Bar < P2Bar;
HLValid = T1 > T2 and P1 < P2 and T1 < P1;
InZone = GD > P1 and GD < P2 and T2 <= Lowest(Low, P2Bar);
If PTValid and HLValid and InZone Then Begin
XA = P2 - T2;
AB = P1 - T2;
BC = P1 - T1;
CD = GD - T1;
AD = GD - T2;
ABdXA = AB / XA; {AB should be 61.8% of XA}
C1 = ABdXA > F1 - Tolerance and ABdXA < F1 + Tolerance;
BCdAB = BC / AB; {BC should be 61.8-78.6% of AB}
C2 = BCdAB > F1 - Tolerance and BCdAB < F2 + Tolerance;
CDdBC = CD / BC; {CD should be 127-161.8% of BC}
C3 = CDdBC > F3 - Tolerance and CDdBC < F4 + Tolerance;
ADdXA = AD / XA; {AD should be 78.6% of XA}
C4 = ADdXA > F2 - Tolerance and ADdXA < F2 + Tolerance;
If C1 and C2 and C3 and C4 Then Begin
TL1 = TL_New(Date[P2Bar], Time[P2Bar], P2, Date[T2Bar], Time[T2Bar], T2);
If TL1 >= 0 Then Begin
TL_SetColor(TL1, BearColor);
TL_SetStyle(TL1, Tool_Solid);
TL_SetSize(TL1, 2);
End;
TL2 = TL_New(Date[T2Bar], Time[T2Bar], T2, Date[P1Bar], Time[P1Bar], P1);
If TL2 >= 0 Then Begin
TL_SetColor(TL2, BearColor);
TL_SetStyle(TL2, Tool_Solid);
TL_SetSize(TL2, 2);
End;
TL3 = TL_New(Date[P1Bar], Time[P1Bar], P1, Date[T1Bar], Time[T1Bar], T1);
If TL3 >= 0 Then Begin
TL_SetColor(TL3, BearColor);
TL_SetStyle(TL3, Tool_Solid);
TL_SetSize(TL3, 2);
End;
TL4 = TL_New(Date[T1Bar], Time[T1Bar], T1, Date, Time, GD);
If TL4 >= 0 Then Begin
TL_SetColor(TL4, BearColor);
TL_SetStyle(TL4, Tool_Solid);
TL_SetSize(TL4, 2);
End;
TL5 = TL_New(Date[P1Bar], Time[P1Bar], P1, Date, Time, GD);
If TL5 >= 0 Then Begin
TL_SetColor(TL5, BearColor);
TL_SetStyle(TL5, Tool_Dotted);
End;
TL6 = TL_New(Date[P2Bar], Time[P2Bar], P2, Date, Time, GD);
If TL6 >= 0 Then Begin
TL_SetColor(TL6, BearColor);
TL_SetStyle(TL6, Tool_Dotted);
End;
End;
End;
End;[/CODE]
Or from Wealth-Lab code to metatrader4:
[CODE]procedure Gartley222
(
VPFactor: float;
Tolerance: float;
Lookback: integer;
HoldBars: integer;
VolMin: integer
);
begin
var ATRValue, VP, Reversal: float;
var F1, F2, F3, F4, P1, P2, T1, T2: float;
var Bar, P1Bar, P2Bar, T1Bar, T2Bar, p: integer;
var XA, AB, BC, CD, AD, D, XD, DT, ABdXA, BCdAB, CDdBC, ADdXA: float;
var PTValid, HLValid, InZone, C1, C2, C3, C4: boolean;
var BT, BS, ST, SS: float;
{Fibonacci Constants}
F1 := 0.618;
F2 := 0.786;
F3 := 1.27;
F4 := 1.618;
InstallTimeBasedExit(HoldBars);
for Bar := Lookback to BarCount() - 1 do
begin
ApplyAutoStops(Bar);
ATRValue := ATR(Bar, Lookback);
SetShareSize( 1000 * Int( 10 / ATRValue ) );
VP := 100 * ATRValue / PriceClose(Bar);
{Find peaks and troughs}
Reversal := Int(VPFactor * VP);
P1 := Peak(Bar, #High, F1 * Reversal);
P1Bar := PeakBar(Bar, #High, F1 * Reversal);
P2 := Peak(P1Bar, #High, Reversal);
P2Bar := PeakBar(P1Bar, #High, Reversal);
T1 := Trough(Bar, #Low, F1 * Reversal);
T1Bar := TroughBar(Bar, #Low, F1 * Reversal);
T2 := Trough(T1Bar, #Low, Reversal);
T2Bar := TroughBar(T1Bar, #Low, Reversal);
{Test for a bullish 222}
{Trough X is T2}
{Peak A is P2}
{Trough B is T1}
{Peak C is P1}
{D is the buy zone}
D := PriceLow(Bar);
PTValid := (P1Bar > T1Bar) and (T1Bar > P2Bar) and (P2Bar > T2Bar);
HLValid := (P1 T2) and (P1 > T1);
InZone := (D T2);
if (MarketPosition = 0) and
(SMA(Bar, #Volume, Lookback) >= VolMin) and
(PTValid) and (HLValid) and (InZone) then
begin
XA := P2 - T2;
AB := P2 - T1;
BC := P1 - T1;
XD := P2 - (F2 * XA);
CD := P1 - XD;
AD := P2 - XD;
ABdXA := AB / XA; {AB should be 61.8% of XA}
C1 := (ABdXA > F1 - Tolerance) and (ABdXA < F1 + Tolerance);
BCdAB := BC / AB; {BC should be 61.8-78.6% of AB}
C2 := (BCdAB > F1 - Tolerance) and (BCdAB < F2 + Tolerance);
CDdBC := CD / BC; {CD should be 127-161.8% of BC}
C3 := (CDdBC > F3 - Tolerance) and (CDdBC < F4 + Tolerance);
ADdXA := AD / XA; {AD should be 78.6% of XA}
C4 := (ADdXA > F2 - Tolerance) and (ADdXA < F2 + Tolerance);
if C1 and C2 and C3 and C4 then
begin
DrawLine(P2Bar, P2, T2Bar, T2, 0, #Blue, #Solid);
DrawLine(T1Bar, T1, P2Bar, P2, 0, #Blue, #Solid);
DrawLine(P1Bar, P1, T1Bar, T1, 0, #Blue, #Solid);
DrawLine(Bar, D, P1Bar, P1, 0, #Blue, #Solid);
DrawLine(Bar, D, T1Bar, T1, 0, #Blue, #Dotted);
DrawLine(Bar, D, T2Bar, T2, 0, #Blue, #Dotted);
AnnotateBar('B', Bar, True, #Blue, 10);
BuyAtLimit(Bar, XD, 'G222 LE');
DT := F1 * CD;
BT := XD + DT;
BS := T2;
end;
end;
{Test for a bearish 222}
{Peak X is P2}
{Trough A is T2}
{Peak B is P1}
{Trough C is T1}
{D is the short zone}
D := PriceHigh(Bar);
PTValid := (T1Bar > P1Bar) and (P1Bar > T2Bar) and (T2Bar > P2Bar);
HLValid := (T1 > T2) and (P1 < P2) and (T1 < P1);
InZone := (D > P1) and (D < P2);
if (MarketPosition = 0) and
(PriceClose( Bar ) >= 5) and
(SMA(Bar, #Volume, Lookback) >= VolMin) and
(PTValid) and (HLValid) and (InZone) then
begin
XA := P2 - T2;
AB := P1 - T2;
BC := P1 - T1;
XD := T2 + (F2 * XA);
CD := XD - T1;
AD := XD - T2;
ABdXA := AB / XA; {AB should be 61.8% of XA}
C1 := (ABdXA > F1 - Tolerance) and (ABdXA < F1 + Tolerance);
BCdAB := BC / AB; {BC should be 61.8-78.6% of AB}
C2 := (BCdAB > F1 - Tolerance) and (BCdAB < F2 + Tolerance);
CDdBC := CD / BC; {CD should be 127-161.8% of BC}
C3 := (CDdBC > F3 - Tolerance) and (CDdBC < F4 + Tolerance);
ADdXA := AD / XA; {AD should be 78.6% of XA}
C4 := (ADdXA > F2 - Tolerance) and (ADdXA < F2 + Tolerance);
if C1 and C2 and C3 and C4 then
begin
DrawLine(T2Bar, T2, P2Bar, P2, 0, #Red, #Solid);
DrawLine(P1Bar, P1, T2Bar, T2, 0, #Red, #Solid);
DrawLine(T1Bar, T1, P1Bar, P1, 0, #Red, #Solid);
DrawLine(Bar, D, T1Bar, T1, 0, #Red, #Solid);
DrawLine(Bar, D, P1Bar, P1, 0, #Red, #Dotted);
DrawLine(Bar, D, P2Bar, P2, 0, #Red, #Dotted);
AnnotateBar('S', Bar, False, #Red, 10);
ShortAtLimit(Bar, XD, 'G222 SE');
DT := F1 * CD;
ST := XD - DT;
SS := P2;
end;
end;
if LastPositionActive then
begin
if MarketPosition = 1 then begin
SellAtLimit(Bar+1, BT, #All, 'G222 LX+');
SellAtStop(Bar+1, BS, #All, 'G222 LX-');
end;
if MarketPosition = -1 then begin
CoverAtLimit(Bar+1, ST, #All, 'G222 LX+');
CoverAtStop(Bar+1, SS, #All, 'G222 LX-');
end;
end;
end;
end;
Gartley222(2.0, 0.1, 20, 7, 2000000);