• Genel bakış
  • İncelemeler (3)
  • Yorumlar (4)
  • Yenilikler

Support Resistance Propulsion Targets MT5

3.67
Grafiğinizde otomatik olarak destek ve direnç seviyeleri PLUS itici mum boşlukları çizin, böylece fiyatın nereye gidebileceğini ve / veya potansiyel olarak tersine dönebileceğini görebilirsiniz.

Bu gösterge, web sitemde (The Market Structure Trader) öğretilen pozisyon ticareti metodolojisinin bir parçası olarak kullanılmak üzere tasarlanmıştır ve hedefleme ve potansiyel girişler için temel bilgileri görüntüler.

MT4 Version: https://www.mql5.com/en/market/product/97246/

Göstergede 2 TEMEL özellik ve 4 ek özellik bulunmaktadır:
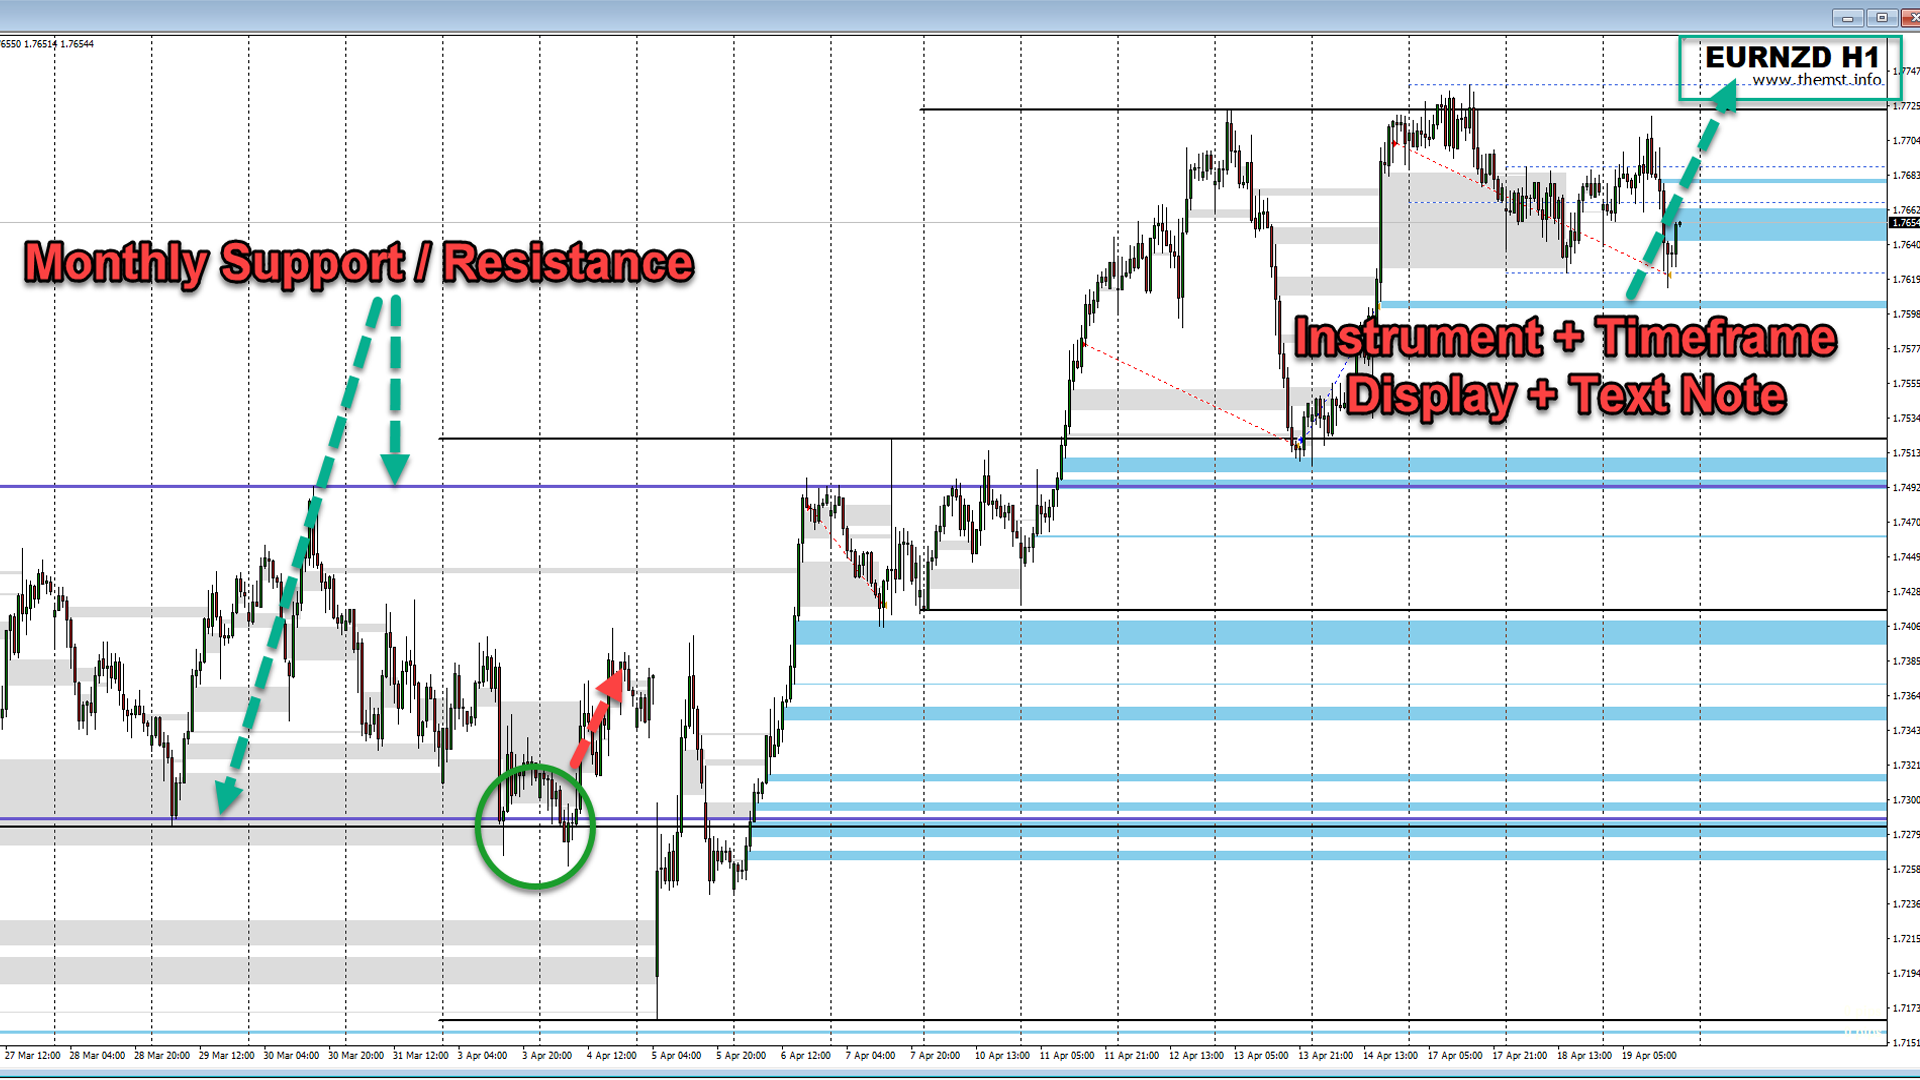
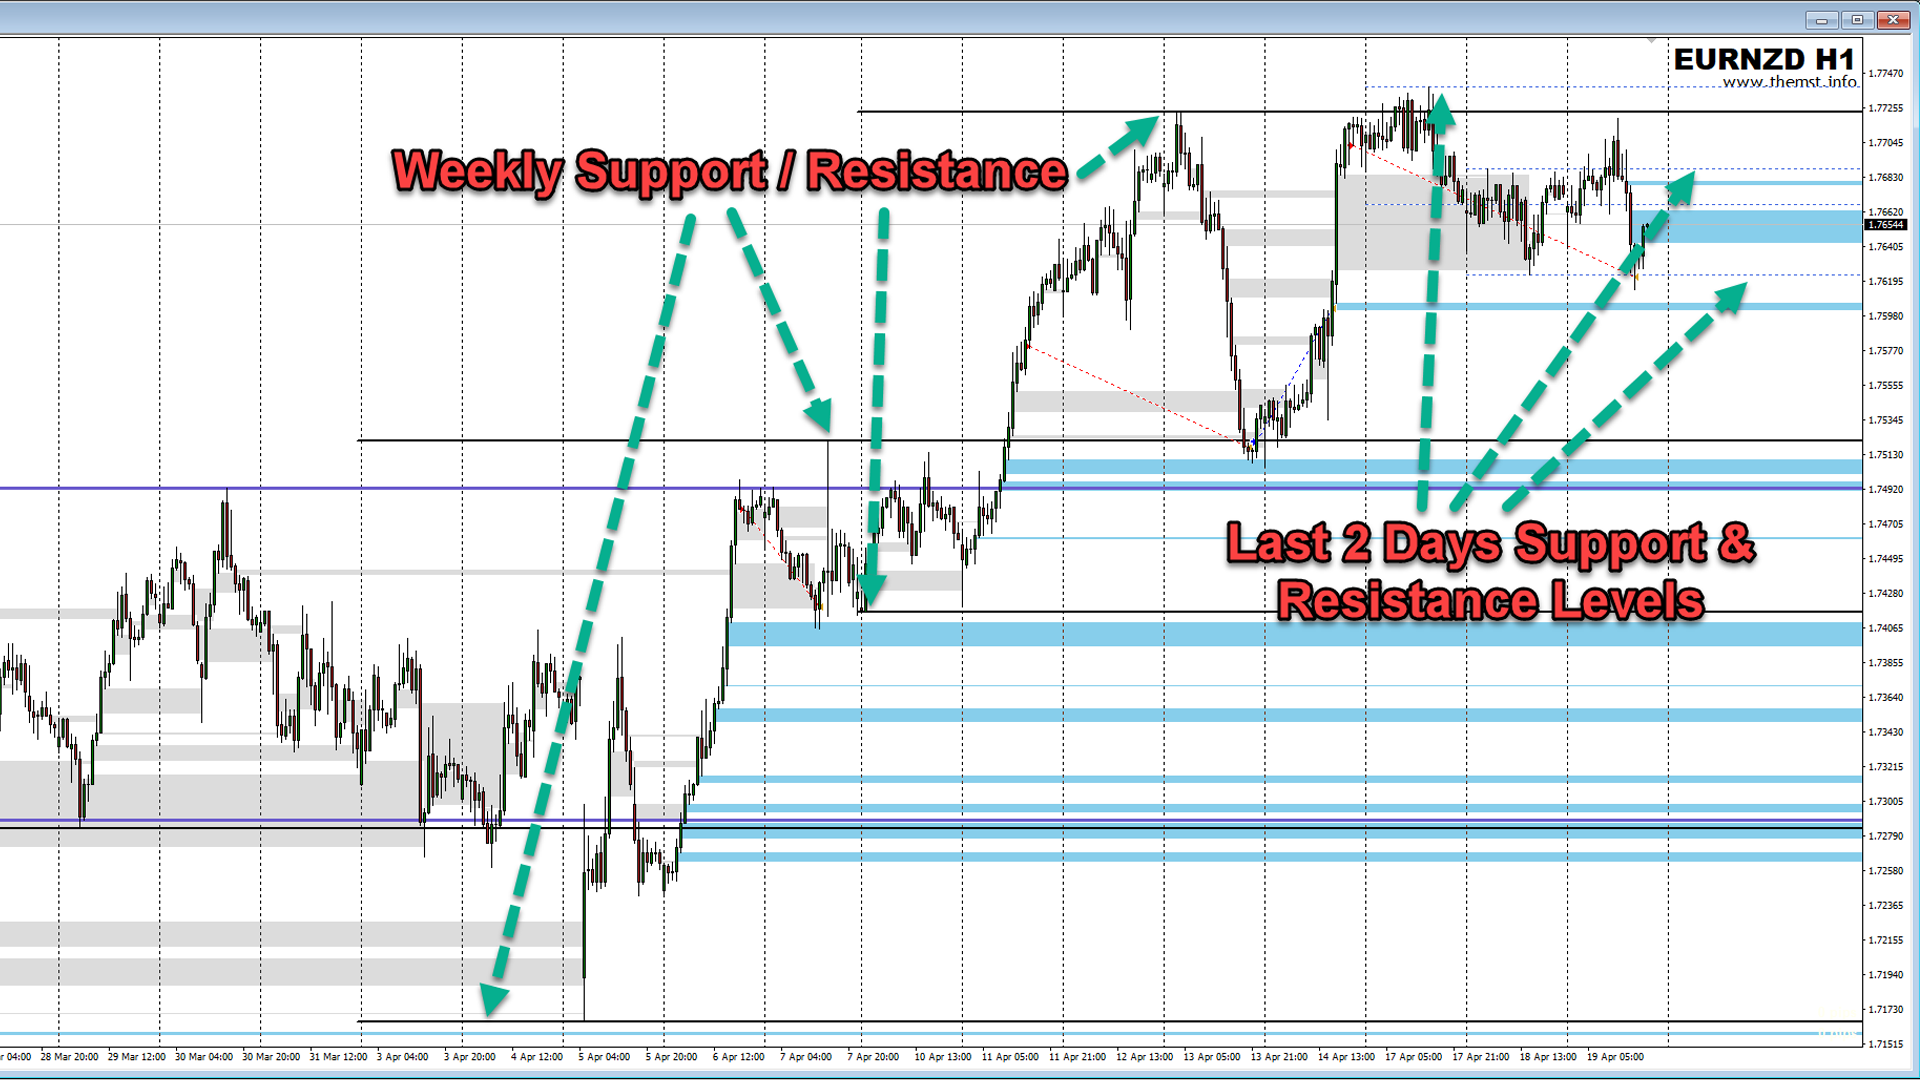
TEMEL ÖZELLİK 1 - Günlük, Haftalık ve Aylık Zaman Dilimleri İçin Otomatik Destek ve Direnç Çizgileri
Gösterge, sizin için son 2 gün ve 6 hafta ve ay öncesine kadar en son destek ve direnç seviyelerini otomatik olarak çizer. Bu seviyelerin görünümünü size uyacak şekilde tamamen özelleştirebilir ve kaç tanesinin gösterileceğini görüntüleyebilirsiniz. Bu kilit seviyeler genellikle fiyatın döneceği ve geri çekileceği ya da tersine döneceği ana destek ve direnç bölgeleri olarak hareket eder. Bunlar aynı zamanda fiyatın yöneleceği hedeflerdir, böylece bir ticaret için mevcut potansiyel mesafeyi dönme olasılığından önce hızlı bir şekilde görebilirsiniz.

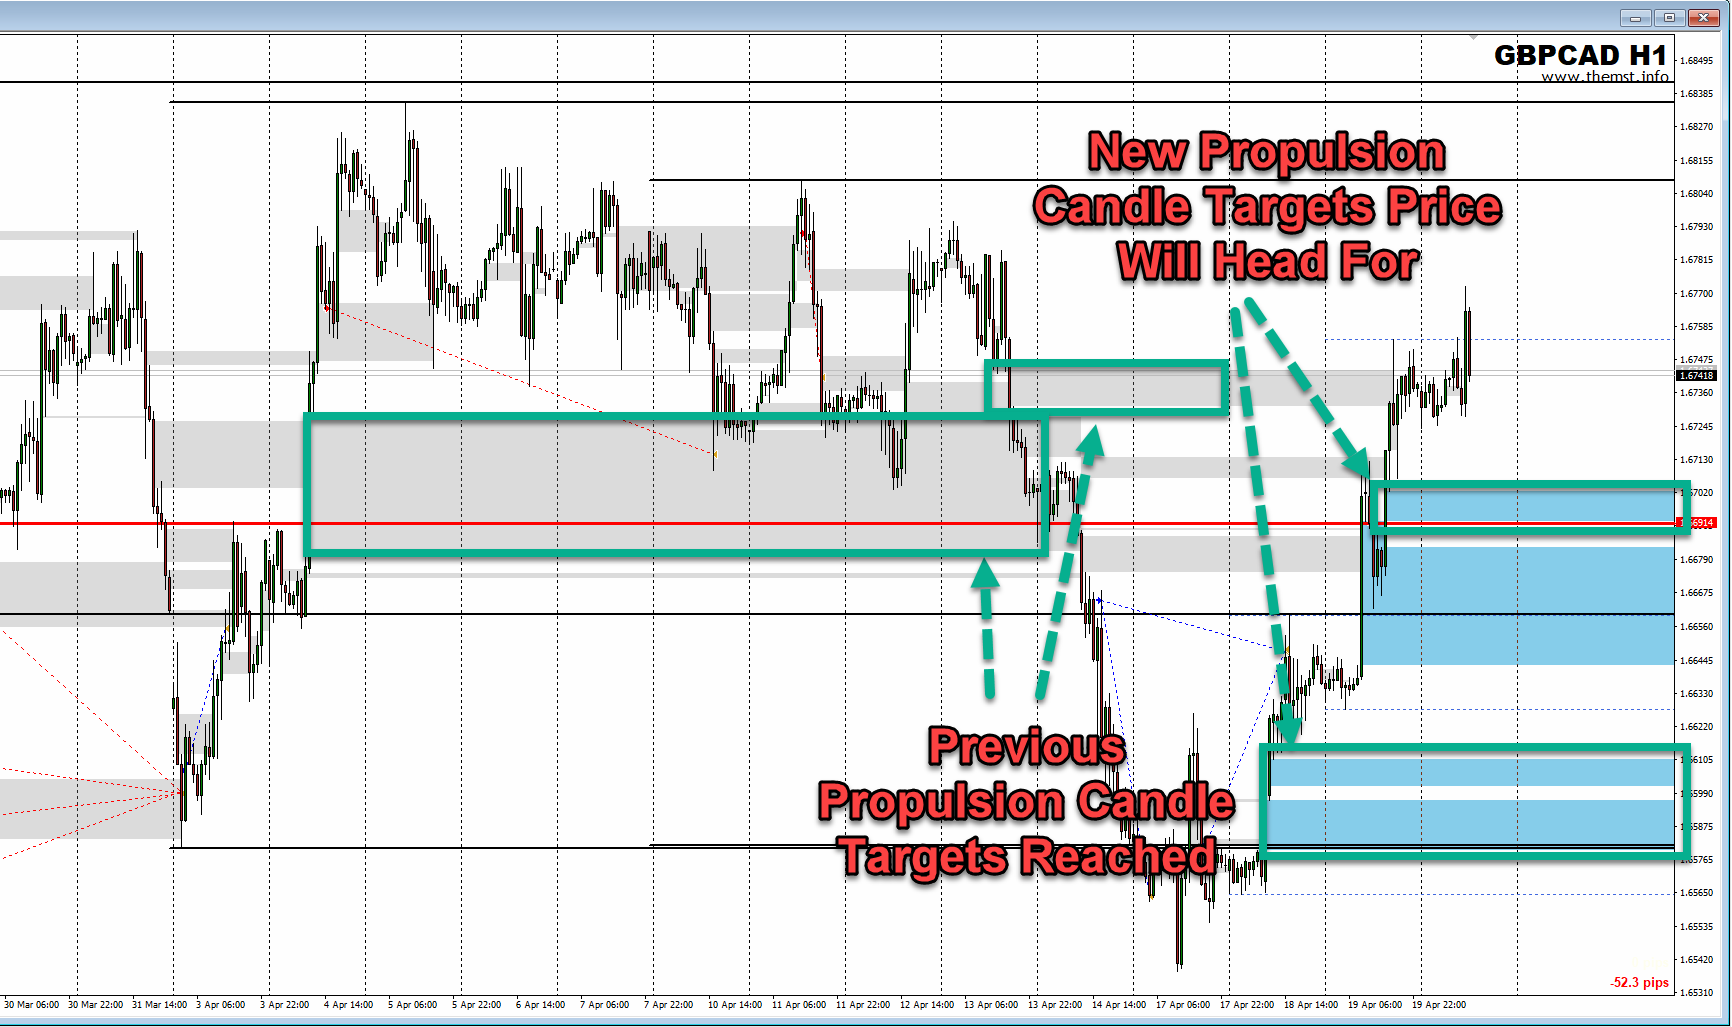
TEMEL ÖZELLİK 2 - İtici Mum Boşluğu Hedefleri
İtici boşluk mumları, bankalar ve kurumlar tarafından herhangi bir piyasada büyük pozisyonlar alarak yaratılan güçlü, hızlı hareketlerdir. Bu büyük mumlar oluştuktan sonra iki temel amaca hizmet eder.

1. Büyük piyasa katılımcıları, fiyatın bir kez oluştuktan sonra genellikle bir süre daha hareket etmeye devam edeceği bir yön seçtiğinden, yön sinyali görevi görürler.

2. Daha da önemlisi, bu alanlar genellikle diğer büyük oyuncuları pozisyonlarında "ofsaytta" bırakacağından ve fiyat çoğu zaman bu seviyelere geri çekileceğinden hedef görevi görürler (ekran görüntülerine bakın).

İtici mum boşlukları, esas olarak hedefleme amacıyla işlemlere girerken kullanışlıdır, böylece bir hareketin en olası bitiş noktasının nerede olacağını görebilirsiniz. Bu alanların kısa bir süre içinde %90'dan fazla kez yeniden test edildiğini biliyoruz. Bir ticarete girme nedeniniz ne olursa olsun, FİYATIN NEREYE GİTTİĞİNİ yüksek bir kesinlik derecesiyle BİLMEK son derece faydalı olabilir. Risk:ödül temelinde işlem yapıyorsanız bunları önemli kararlar almak için de kullanabilirsiniz. Ticaretinizle belirli bir risk: ödül oranını hedefliyorsanız, ancak aralığınız içinde potansiyel bir itici mum boşluğu hedefi göremiyorsanız veya çok yakın bir tane görüyorsanız, bu, bir ticaretin uygun olup olmadığına karar vermenize yardımcı olabilir. almak ya da yapmamak.

***EK ÖZELLİKLER***
Enstrümanı ve Zaman Dilimini Grafiğinizde Görüntüleme
İşlem yaptığınız enstrümanın grafiğinde sembolü ve zaman dilimini gösterin; bu, ekran görüntüleri alıyorsanız işlemlerinizin gelecekteki analizi için kullanışlıdır, böylece neyin işlem gördüğünü ve analiz için zaman dilimini kolayca belirleyebilirsiniz.

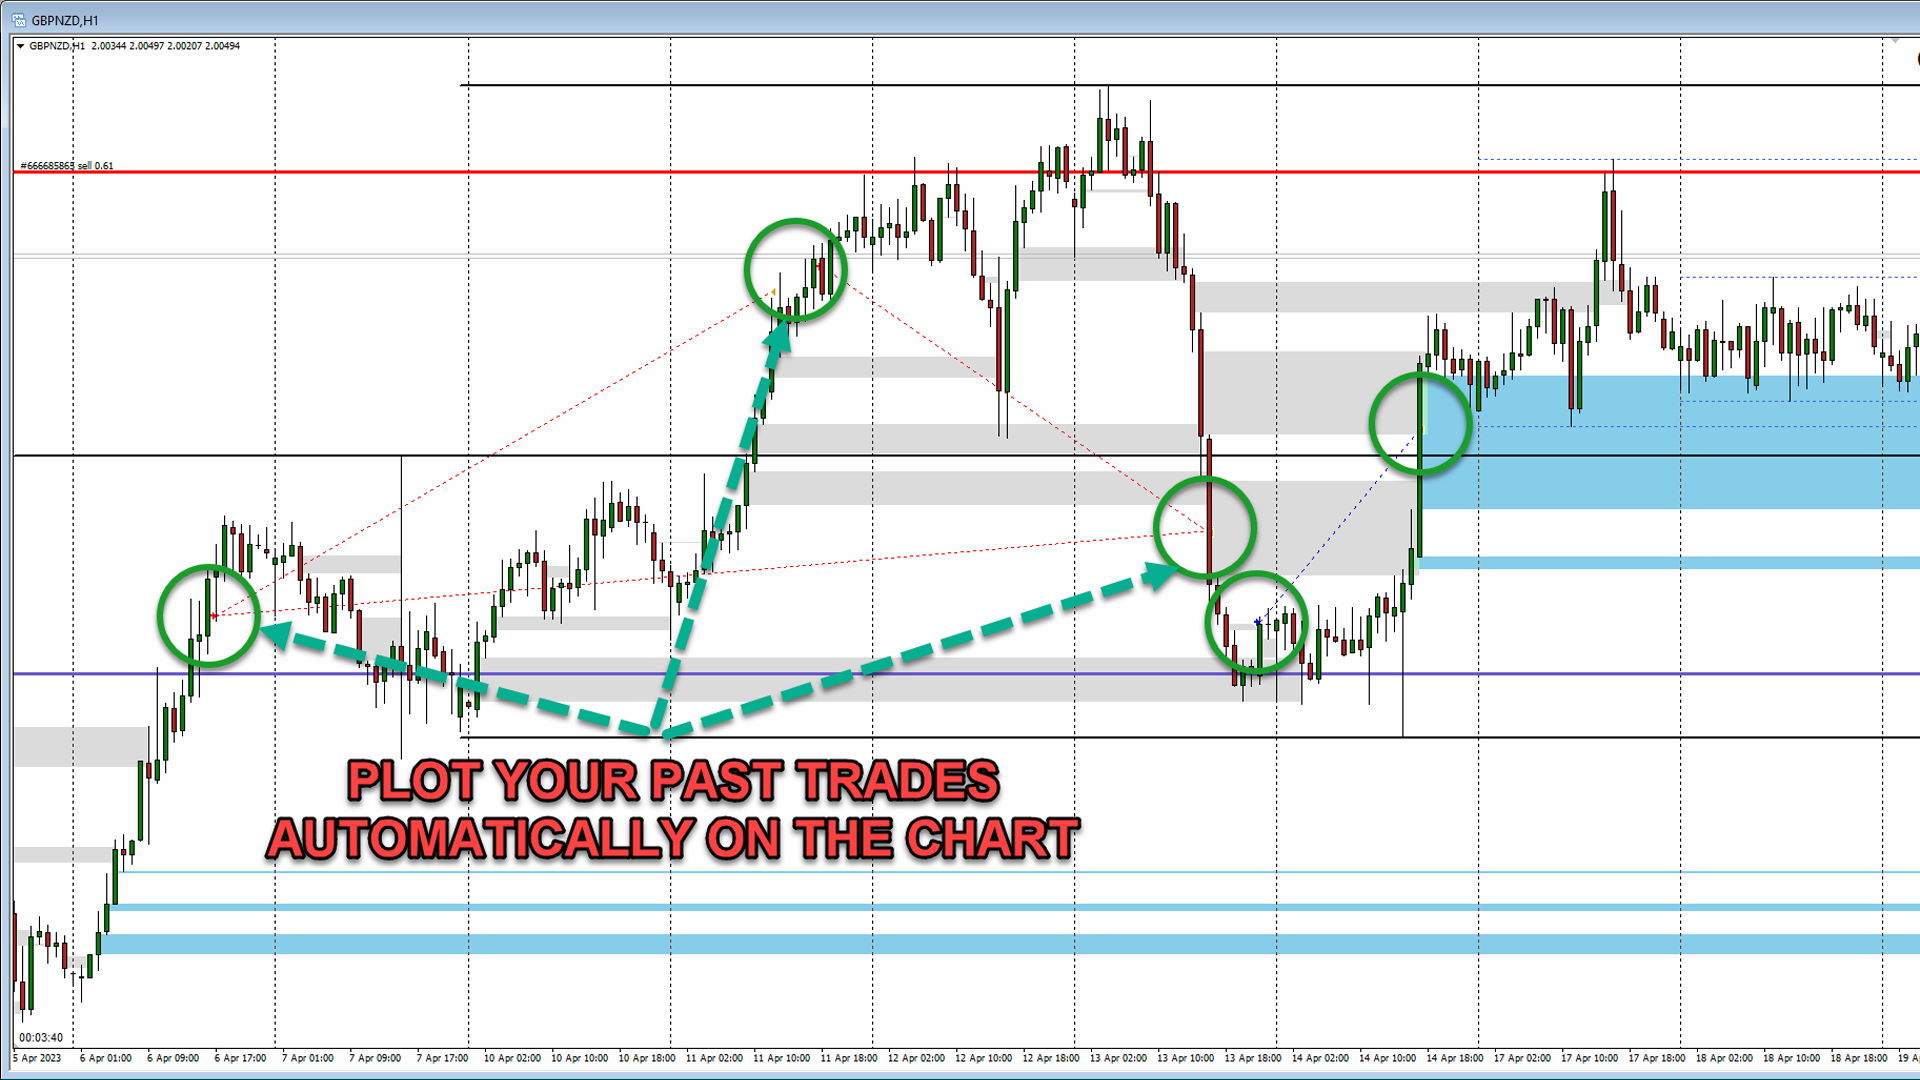
İşlem Geçmişini Grafiğinizde Görüntüleyin
Grafiğinizde çizilen geçmiş işlemlerinizi otomatik olarak çizin, böylece geçmiş performansı analiz edebilir ve gelişmenize yardımcı olmak için girişlerinizin ve çıkışlarınızın ne kadar iyi olduğunu görebilirsiniz.

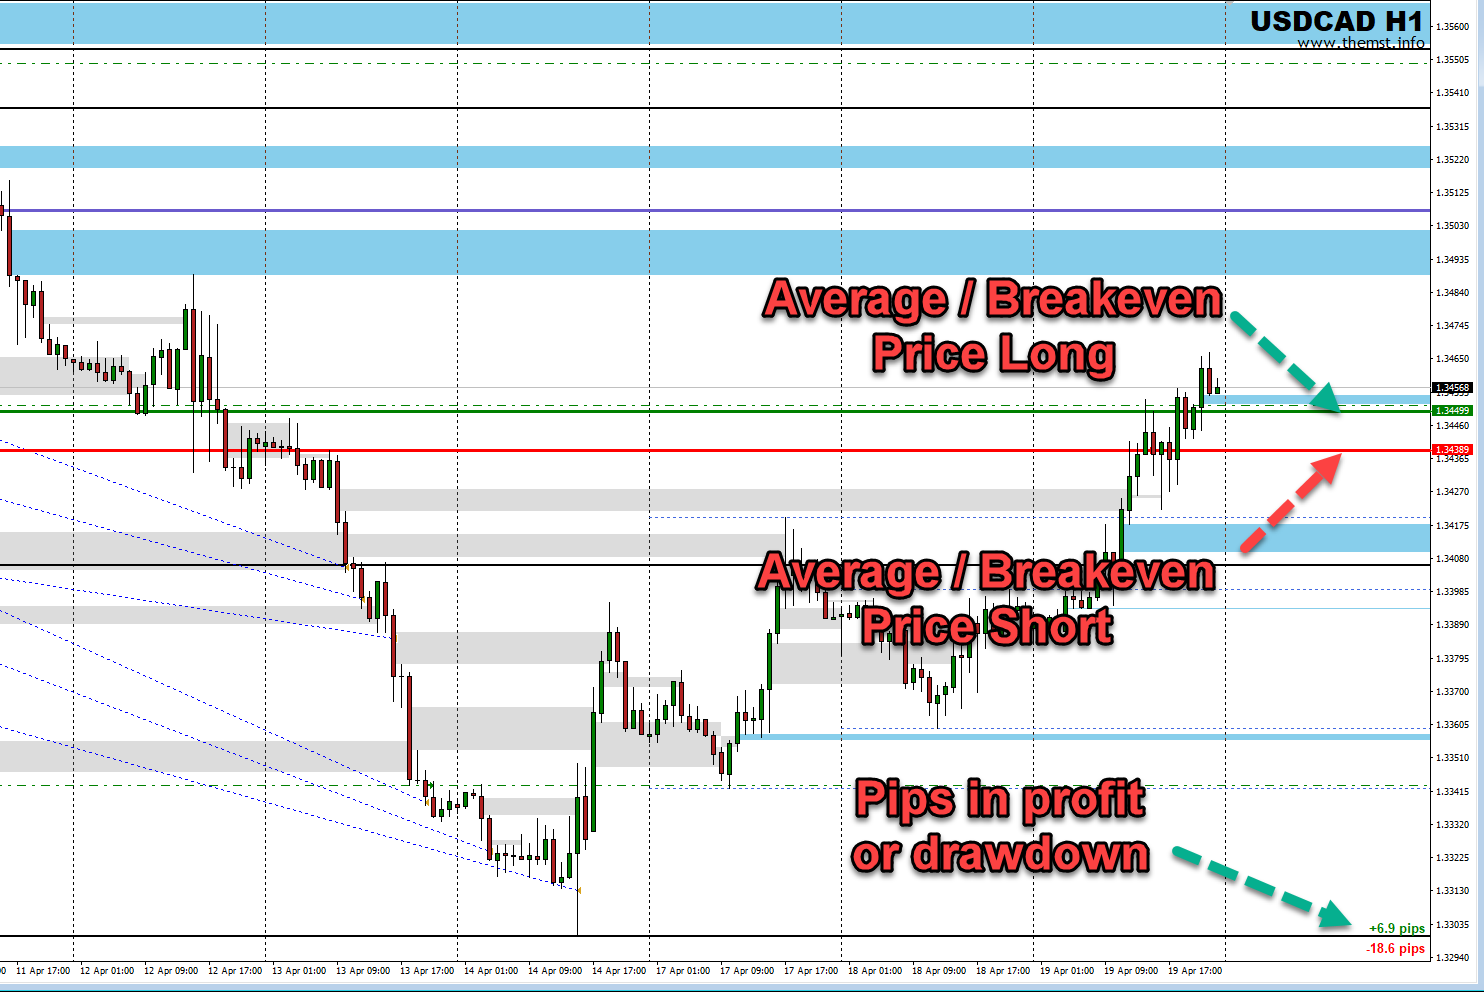
Başabaş veya Ortalama Fiyat Seviyenizi + Kârdaki Piplerinizi Gösterin
Bu özellik, birden fazla işlemle pozisyonlara girip çıkan tüccarlar için kullanışlıdır. Başabaş çizgisi, uzun ve kısa pozisyonlar için ortalama fiyatınızı ayrı ayrı çizer. İşlem yaparken, riskten korunurken veya martingale tarzı bir giriş yöntemi kullanırken Dolar maliyet ortalaması alıyorsanız, işlemlerinizde nerede başa baş olacağınızı anında görebilirsiniz. İşlemlerinizin kâr veya zararda olduğu pip miktarı da grafikte görüntülenir, böylece pozisyonlarınızı pip cinsinden de görebilirsiniz.

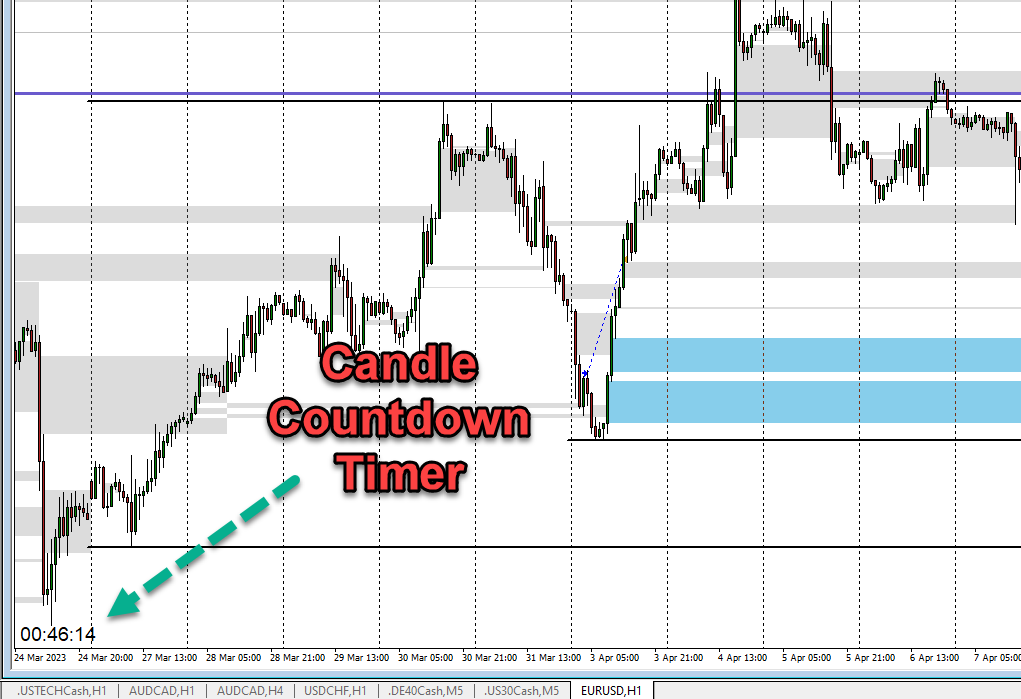
Mum Geri Sayım Sayacı
Grafiğinizde baktığınız zaman diliminde mevcut mum kapanmadan önce kalan süreyi görüntüler. Scalpers veya yalnızca bir mum kapandığında işlemlere girenler için çok kullanışlıdır, böylece bir sonraki sinyalin ne zaman gerçekleşebileceğini kolayca görebilirsiniz.


İncelemeler 3
Betatester69
181
Betatester69 2024.05.06 20:22 
 

Quite useful indicator, shows fvg's, important highs/lows, candle timer and a few other useful things. Takes a while to load on mt5 but that is just mt5...much better on mt4 I hear but I had already bought this. Part and parcel now of the position trading strategy that I use thanks to the author.

camira
224
camira 2023.06.02 18:07 
 

absolutely good tool! Is highly recommended! Thanks Lee ;))

Önerilen ürünler
Double HMA MTF for MT5
Pavel Zamoshnikov
3.67 (3)
This is an advanced multi-timeframe version of the popular Hull Moving Average (HMA) Features Two lines of the Hull indicator of different timeframes on the same chart. The HMA line of the higher timeframe defines the trend, and the HMA line of the current timeframe defines the short-term price movements. A graphical panel with HMA indicator data from all timeframes at the same time . If the HMA switched its direction on any timeframe, the panel displays a question or exclamation mark with a tex
KT Horizontal Lines MT5
KEENBASE SOFTWARE SOLUTIONS
In MetaTrader, plotting multiple   horizontal lines   and then tracking their respective price levels can be a hassle. This indicator automatically plots multiple horizontal lines at equal intervals for setting price alerts, plotting support and resistance levels, and other manual purposes. This indicator is suitable for Forex traders who are new and looking for chances to make quick profits from buying and selling. Horizontal lines can help traders find possible areas to start trading when the
The indicator is the advanced form of the MetaTrader 4 standard Fibonacci tool. It is unique and very reasonable for serious Fibonacci traders. Key Features Drawing of Fibonacci retracement and expansion levels in a few seconds by using hotkeys. Auto adjusting of retracement levels once the market makes new highs/lows. Ability to edit/remove any retracement & expansion levels on chart. Auto snap to exact high and low of bars while plotting on chart. Getting very clear charts even though many ret
The Rocket Trend indicator is trending. The indicator draws two-color points connected by lines along the chart. This is a trend indicator, it is an algorithmic indicator. It is easy to work and understand when a blue circle appears, you need to buy, when a red one appears, sell. The indicator is used for scalping and pipsing, and has proven itself well. Rocket Trend is available for analyzing the direction of the trend for a specific period of time. Ideal for novice traders learning the laws o
MarketMagnet
Kelly Adediran Raymond
Are you ready to take your trading journey to new heights? Look no further than MarketMagnet, this groundbreaking indicator designed to propel your trading success with excitement and accuracy. Powered by the convergence of Momentum and CCI (Commodity Channel Index), MarketMagnet equips traders with the ultimate tool to determine direction and entry prices for a wide range of recommended currency pairs and instruments. It is designed for traders seeking to scalp for a few pips on lower timeframe
Owl Smart Levels MT5
Sergey Ermolov
4.07 (28)
MT4 versiyonu  |  FAQ Owl Smart Levels Indicator , Bill Williams'ın gelişmiş fraktalları , piyasanın doğru dalga yapısını oluşturan Valable ZigZag ve kesin giriş seviyelerini gösteren Fibonacci seviyeleri gibi popüler piyasa analiz araçlarını içeren tek gösterge içinde eksiksiz bir ticaret sistemidir. pazara ve kar elde edilecek yerlere. Stratejinin ayrıntılı açıklaması Gösterge ile çalışma talimatı Baykuş Yardımcısı ticaretinde Danışman Yardımcısı Kullanıcıların özel sohbeti -> Satın aldıktan
Support & Resistance indicator is a modification of the standard Bill Williams' Fractals indicator. The indicator works on any timeframes. It displays support and resistance levels on the chart and allows setting stop loss and take profit levels (you can check the exact value by putting the mouse cursor over the level). Blue dashed lines are support level. Red dashed lines are resistance levels. If you want, you can change the style and color of these lines. If the price approaches a support lev
To download MT4 version please click here . This is the exact conversion from TradingView: "WaveTrend [LazyBear]" By "zeusuk3". One of the coolest indicators out there to detect overbought and oversold zones. It can be used as a part of more complicated strategy and for confirming a potential trade setup. There are buffers to use in EAs also. The indicator is loaded light and non-repaint. - You can message in private chat for further changes you need. Thanks for downloading 
Trade smarter, not harder: Empower your trading with Harmonacci Patterns Special Offer: Purchase now to receive free bonuses worth $165! (Read more for details) This is arguably the most complete harmonic price formation auto-recognition indicator you can find for the MetaTrader Platform. It detects 19 different patterns, takes fibonacci projections as seriously as you do, displays the Potential Reversal Zone (PRZ) and finds suitable stop-loss and take-profit levels. [ Installation Guide | Up
Overview The Breakout and Retest indicator is designed to identify potential trading opportunities by detecting price breakouts from significant support and resistance levels followed by a retest of the broken level. How it Works The indicator analyzes price data to determine key support and resistance areas. When the price decisively breaks through one of these levels and then retest it, then  a potential breakout is signaled when it breakout again. To increase the probability of a successful t
The Penta-O is a 6-point retracement harmonacci pattern which usually precedes big market movements. Penta-O patterns can expand and repaint quite a bit. To make things easier this indicator implements a twist: it waits for a donchian breakout in the right direction before signaling the trade. The end result is an otherwise repainting indicator with a very reliable trading signal. The donchian breakout period is entered as an input. [ Installation Guide | Update Guide | Troubleshooting | FAQ | A
Bu, fiyat etiketleriyle (devre dışı bırakılabilir)   Gelişmiş ZigZag Dinamik   ve/veya   Genişletilmiş Fraktallar   göstergesi ekstremumlarına dayalı destek ve direnç seviyelerinin bir MTF göstergesidir. MTF modu için daha yüksek TF'ler seçilebilir. Varsayılan olarak, seviyeler ZigZag gösterge noktalarına göre oluşturulur. Fraktal gösterge noktaları da ZigZag ile birlikte veya onun yerine kullanılabilir. Kullanımı basitleştirmek ve CPU zamanından tasarruf etmek için, açılışta her çubuk için bir
Nrha
Ratna Purwantari
This indicator uses Fibonacci to determine your trading levels precisely and measurably. It helps you to earn big profits. This indicator can also be used for various currency charts. You can also combine it with other indicators that you like so that the profits you get are also even greater. I hope you give me input so that this indicator can be better. We recommend using for the period M1 to M15. feel free to discuss with me. Thanks. 
ACB Breakout Arrows MT5
KEENBASE SOFTWARE SOLUTIONS
5 (1)
The ACB Breakout Arrows indicator provides a crucial entry signal in the market by detecting a special breakout pattern. The indicator constantly scans the chart for a settling momentum in one direction and provide the accurate entry signal right before the major move. Get multi-symbol and multi-timeframe scanner from here - Scanner for ACB Breakout Arrows MT 5 Key features Stoploss   and Take Profit levels are provided by the indicator. Comes with a MTF Scanner dashboard which tracks the br
"Hunttern harmonic pattern finder" base on the dynamic zigzag with the notification and prediction mode This version of the indicator identifies 11 harmonic patterns and predicts them in real-time before they are completely formed. It offers the ability to calculate the error rate of Zigzag patterns depending on a risk threshold. It moreover sends out a notification once the pattern is complete. The supported patterns: ABCD BAT ALT BAT BUTTERFLY GARTLEY CRAB DEEP CRAB CYPHER SHARK THREE
MTF Candles PRO
Renato Fiche Junior
1 (2)
Tool that allows viewing candles in multiple timeframes. This way, it helps the analysis in multiple timeframes. This is another product developed by Renato Fiche Junior and available to all MetaTrader 5 users! Input Parameters - Option 1 - TimeFrame: Standard MT5 timeframe - Option 2 - Custom TimeFrame (in minutes): Or, if this value is different from zero, the timeframe will be customized. This allows you to choose timeframe other than the MT5 standard. - Total Candles: Number of candle
Your Trend Friend
Luigi Nunes Labigalini
5 (1)
The trend is your friend! Look at the color of the indicator and trade on that direction. It does not  repaint. After each candle is closed, that's the color of the trend. You can focus on shorter faster trends or major trends, just test what's most suitable for the symbol and timeframe you trade. Simply change the "Length" parameter and the indicator will automatically adapt. You can also change the color, thickness and style of the lines. Download and give it a try! There are big movements
Special Channel channel indicator is a classic indicator of a family of channel indicators, the use of which allows the trader to respond in time to the price out of the channel set for it. This corridor is built on the basis of the analysis of several candles, starting from the last, as a result of which the extrema of the studied interval are determined. It is they who create the channel lines. Trading in the channel is one of the most popular Forex strategies; its simplicity allows even be
How to use Pair Trading Station Pair Trading Station is recommended for H1 time frame and you can use it for any currency pairs. To generate buy and sell signal, follow few steps below to apply Pair Trading Station to your MetaTrader terminal. When you load Pair Trading Station on your chart, Pair Trading station will assess available historical data in your MetaTrader platforms for each currency pair. On your chart, the amount of historical data available will be displayed for each currency pai
Adaptive Trend Lines
Henri Salvatore Bigatti
4.71 (21)
This indicator shows the TLH and TLL and some trendlines that allow us to estimate the trend of market.  It also shows the values of the angles of the lines in percentage in points (pip) , the standard deviation, and the trend of each line, and when it breaks the lines of support and resistance (TLH and TLL). And finally, it also shows the points identified as supports and resistances through the fractal algorithm in the graph. The high and low trend lines are supported by the highs and lows, th
FREE
This indicator uses the metaquotes ZigZag indicator as base to plot fibonacci extension and fibonacci retracement based in the Elliot waves. A fibonacci retracement will be plotted on every wave draw by the ZigZag. A fibonacci extension will be plotted only after the 2nd wave. Both fibonacci will be updated over the same wave tendency. Supporting until 9 consecutive elliot waves. Parameters: Depth: How much the algorithm will iterate to find the lowest and highest candles Deviation: Amoun
This indicator would help you I DENTIFY different HORIZONTAL SUPPORT / RESISTANCE LEVELS AND TRENDLINES.  ADVANTAGES: Use up till 5 different levels of Support and Resistance Use up till 5 different trend lines  Use true/false options to display for Support/Resistance or Trend line Image PARAMETERS: nPeriod: the time period to decide  Limits: the candles limit to look back UseHorizontalLines: true/false option to display Horizontal Support and Resistance Lines UseTrendline: true/false opti
The well-known ZigZag indicator that draws rays based on the "significant movement" specified by the pips parameter. If a ray appears, it will not disappear (the indicator is not redrawn), only its extremum will be updated until the opposite ray appears. You also can display text labels on each rays describing the width of the ray in bars and the length of the ray in points.
The Cube Bars Forex is an indicator for meta trader 5 created by me Tomas Lekim to color the candlesticks based on the volume peaks of the large investors in the forex market. It tracks the buy and sell peaks and paints the candles according to the amount of money invested by the other robots. It is a powerful tool against large robots because it identifies the moments when it must make decisions. It can be configured according to the currency pair you will use. It has 4 different colors so that
Rico
Sabina Fik
With this indicator, you can predict future price behavior for a certain number of bars ahead, giving you the ability to anticipate market dynamics. The indicator draws a forecast line , which models potential future price values based on sophisticated algorithms analyzing past data. This information can be leveraged not only for market entry and exit decisions but also for setting or adjusting stop-loss levels to better manage your positions. Application of the Forecast The data provided by the
This is a well-known ZigZag indicator. But it differs by the fact that its plot is based on values of the middle line which is set by a user. It can display Andrews’ Pitchfork and standard or Bobokus Fibo levels. NO REPAINTING. Parameters Period МА — middle line period. Default value is 34. Minimum value is 4. Maximum value is set at your discretion. Used to calculate price — type of price used for the midline calculations. The averaging method — type of smoothing for the middle line. Turning
Megan
Maryna Shulzhenko
One of the main definitions for monitoring the currency market is a trend, which is why the Megan indicator was created in order to display the trend in a visual form. Forex indicator Megan is a real trading strategy with which you can achieve the desired results. As soon as the indicator is set, the main indicators will immediately begin to be recalculated at the price of the traded pair, based on the postulates of technical analysis. In addition, when potential entry points are detected, visua
SolarTrade Suite Finansal Göstergesi: Jüpiter Piyasa Göstergesi - Finans Piyasaları Dünyasında Güvenilir Rehberiniz! Bu, değerini hesaplamak için özel yenilikçi ve gelişmiş algoritmalar kullanan ve ayrıca göze hoş gelen bir tasarıma sahip bir trend göstergesidir. Bu göstergenin okumalarını anlamak çok kolaydır: mavi renk - al, kırmızı - sat. Açıklamanın alt kısmında SolarTrade Suite serisindeki diğer ürünlerimize göz atın. Yatırım ve finans piyasaları dünyasında güvenle gezinmek ister m
The indicator builds a graphical analysis based on the Fibonacci theory. Fibo Fan is used for the analysis of the impulses and corrections of the movement. Reversal lines (2 lines at the base of the Fibonacci fan) are used to analyze the direction of movements. The indicator displays the of 4 the target line in each direction. The indicator takes into account market volatility. If the price is above the reversal lines, it makes sense to consider buying, if lower, then selling. You can op
The indicator, Support and Resistance Detect Signal automatically detects support and resistance levels and trend lines, emitting a signal whenever the condition is met, as configured. It reads support and resistance drawn manually or automatically built into the chart by other external indicators. Note: Support and Resistance Detect Signal is compatible with almost all external indicators that draw on the chart, support and resistance levels, in addition to trend lines. Discover our Elit
Bu ürünün alıcıları ayrıca şunları da satın alıyor
TPSpro RFI Levels MT5
Roman Podpora
4.73 (11)
TALİMATLAR         RUS   -        ENG       Bir gösterge ile kullanılması   önerilir       -       TPSpro   TREND PRO -   Sürüm MT4         Ticarette önemli bir unsur, bir ticaret aracını satın alma veya satma kararlarının alındığı bölgeler veya seviyelerdir. Büyük oyuncuların piyasadaki varlıklarını gizleme girişimlerine rağmen, kaçınılmaz olarak izler bırakırlar. Bizim görevimiz bu izleri nasıl tanımlayacağımızı ve doğru şekilde nasıl yorumlayacağımızı öğrenmekti. Ana işlevler:: Satıcılar ve
TPSproTREND PrO MT5
Roman Podpora
4.89 (9)
TPSpro TREND PRO  - is a trend indicator that automatically analyzes the market and provides information about the trend and each of its changes, as well as giving signals for entering trades without redrawing! The indicator uses each candle, analyzing them separately. referring to different impulses - up or down impulse. Exact entry points into transactions for currencies, crypto, metals, stocks, indices!  Version MT4               DETAILED DESCRIPTION               R ecommended to use with an
Atbot
Zaha Feiz
4.97 (34)
AtBot: Come funziona e come usarlo ### Come funziona L'indicatore "AtBot" per la piattaforma MT5 genera segnali di acquisto e vendita utilizzando una combinazione di strumenti di analisi tecnica. Integra la Media Mobile Semplice (SMA), la Media Mobile Esponenziale (EMA) e l'indice di Gamma Vero Medio (ATR) per identificare opportunità di trading. Inoltre, può utilizzare le candele Heikin Ashi per migliorare la precisione dei segnali. Lascia una recensione dopo l'acquisto e ricevi un regalo bonu
Öncelikle, bu Ticaret Sistemi'nin Non-Repainting, Non-Redrawing ve Non-Lagging Göstergesi olduğunu vurgulamak önemlidir, bu da hem manuel hem de robot ticareti için ideal hale getirir. Online kurs, kılavuz ve ön ayarları indir. "Smart Trend Trading System MT5", yeni ve deneyimli tüccarlar için özelleştirilmiş kapsamlı bir ticaret çözümüdür. 10'dan fazla premium göstergeyi birleştiriyor ve 7'den fazla sağlam ticaret stratejisi sunuyor, bu da çeşitli piyasa koşulları için esnek bir seçim yapar. Tr
Atomic Analyst MT5
Issam Kassas
4.42 (19)
Öncelikle belirtmek gerekir ki bu Ticaret Göstergesi Yeniden Çizim Yapmaz, Gecikmez ve Gecikme Göstermez, bu da hem manuel hem de robot ticareti için ideal hale getirir. Kullanıcı kılavuzu: ayarlar, girişler ve strateji. Atom Analisti, Piyasada Daha İyi Bir Avantaj Bulmak İçin Fiyatın Gücünü ve Momentumunu Kullanan PA Fiyat Hareketi Göstergesidir. Gürültüleri ve Yanlış Sinyalleri Kaldırmaya ve Ticaret Potansiyelini Artırmaya Yardımcı Olan Gelişmiş Filtrelerle Donatılmıştır. Birden fazla katmanl
Trend Screener Pro MT5
STE S.S.COMPANY
4.87 (63)
Trend Göstergesi, Trend Alım Satım ve Filtreleme için Çığır Açan Benzersiz Çözüm, Tüm Önemli Trend Özellikleriyle Tek Bir Araç İçinde Yerleştirildi! Forex, emtialar, kripto para birimleri, endeksler ve hisse senetleri gibi tüm sembollerde/araçlarda kullanılabilen %100 yeniden boyamayan çoklu zaman çerçevesi ve Çoklu para birimi göstergesidir. Trend Screener, grafikte noktalarla ok trend sinyalleri sağlayan etkili bir trend trend göstergesidir. Trend analizörü göstergesinde bulunan özellikler: 1.
Öncelikle, bu Ticaret Aracının Non-Repainting, Non-Redrawing ve Non-Lagging Gösterge olduğunu vurgulamakta fayda var, bu da onu profesyonel ticaret için ideal hale getiriyor. Çevrimiçi kurs, kullanıcı kılavuzu ve demo. Akıllı Fiyat Hareketi Kavramları Göstergesi, hem yeni hem de deneyimli tüccarlar için çok güçlü bir araçtır. İleri ticaret fikirlerini, Inner Circle Trader Analizi ve Smart Money Concepts Ticaret Stratejileri gibi 20'den fazla kullanışlı göstergeyi bir araya getirerek bir aray
Quantum Trend Sniper
Bogdan Ion Puscasu
4.8 (49)
Tanıtım       Kuantum Trend Keskin Nişancı Göstergesi   , trend tersine dönmeleri belirleme ve ticaret yapma şeklinizi değiştiren çığır açan MQL5 Göstergesi! 13 yılı aşkın ticaret tecrübesine sahip deneyimli tüccarlardan oluşan bir ekip tarafından geliştirilmiştir.       Kuantum Trend Keskin Nişancı Göstergesi       trend dönüşlerini son derece yüksek doğrulukla belirlemenin yenilikçi yolu ile ticaret yolculuğunuzu yeni zirvelere taşımak için tasarlanmıştır. ***Kuantum Trend Keskin Nişancı Gö
TrendMaestro5
Stefano Frisetti
note: this indicator is for METATRADER4, if you want the version for METATRADER5 this is the link:  https://www.mql5.com/it/market/product/108106 TRENDMAESTRO ver 2.4 TRENDMAESTRO recognizes a new TREND in the bud, he never makes mistakes. The certainty of identifying a new TREND is priceless. DESCRIPTION TRENDMAESTRO identifies a new TREND in the bud, this indicator examines the volatility, volumes and momentum to identify the moment in which there is an explosion of one or more of these data a
Bu gösterge paneli, seçilen semboller için mevcut en son   harmonik kalıpları   gösterir, böylece zamandan tasarruf edersiniz ve daha verimli olursunuz /   MT4 sürümü . Ücretsiz Gösterge:   Basic Harmonic Pattern Gösterge sütunları Symbol :   seçilen semboller görünecektir Trend:   yükseliş veya düşüş Pattern :   desen türü (gartley, kelebek, yarasa, yengeç, köpekbalığı, cypher veya ABCD) Entry :   giriş fiyatı SL:   zararı durdur fiyatı TP1:   1. kar alma fiyatı TP2:   2. kar alma fiyatı
FX Power MT5 NG
Daniel Stein
5 (5)
Sabah Brifingimiz burada mql5 ve on Telegram! FX Power MT5 NG , uzun zamandır çok popüler olan döviz gücü ölçerimiz FX Power'ın yeni neslidir. Peki bu yeni nesil güç ölçer ne sunuyor? Orijinal FX Power hakkında sevdiğiniz her şey PLUS GOLD/XAU güç analizi Daha da hassas hesaplama sonuçları Ayrı ayrı yapılandırılabilir analiz dönemleri Daha da iyi performans için özelleştirilebilir hesaplama limiti Özel çokluDaha fazlasını görmek isteyenler için örnek ayarlar Her grafikte en sevdiğiniz renkler i
** All Symbols x All Timeframes scan just by pressing scanner button ** *** Contact me  to send you instruction and add you in "123 scanner group" for sharing or seeing experiences with other users. After 17 years of experience in the markets and programming, Winner indicator is ready. I would like to share with you! Introduction The 123 Pattern Scanner indicator with a special enhanced algorithm is a very repetitive common pattern finder with a high success rate . Interestingly, this Winner in
IX Power MT5
Daniel Stein
4.17 (6)
IX Power   nihayet FX Power'ın rakipsiz hassasiyetini Forex dışı sembollere getiriyor. En sevdiğiniz endeksler, hisse senetleri, emtialar, ETF'ler ve hatta kripto para birimlerindeki kısa, orta ve uzun vadeli eğilimlerin yoğunluğunu doğru bir şekilde belirler. Terminalinizin sunduğu   her şeyi analiz   edebilirsiniz. Deneyin ve işlem yaparken   zamanlamanızın   nasıl   önemli ölçüde iyileştiğini   deneyimleyin. IX Power Temel Özellikler 100 hassas, yeniden boyanmayan hesaplama sonuçları -
Blahtech Supply Demand MT5
Blahtech Limited
4.54 (13)
Was: $299  Now: $99   Supply Demand uses previous price action to identify potential imbalances between buyers and sellers. The key is to identify the better odds zones, not just the untouched ones. Blahtech Supply Demand indicator delivers functionality previously unavailable on any trading platform. This 4-in-1 indicator not only highlights the higher probability zones using a multi-criteria strength engine, but also combines it with multi-timeframe trend analysis, previously confirmed swings
Auto Order Block with break of structure based on ICT and Smart Money Concepts (SMC) Futures Break of Structure ( BoS )             Order block ( OB )            Higher time frame Order block / Point of Interest ( POI )    shown on current chart           Fair value Gap ( FVG ) / Imbalance   -  MTF      ( Multi Time Frame )    HH/LL/HL/LH  -  MTF      ( Multi Time Frame )  Choch  MTF      ( Multi Time Frame )  Volume Imbalance     ,  MTF          vIMB Gap’s Power of 3 Equal High
Matrix Arrow Indicator MT5
Juvenille Emperor Limited
5 (12)
Matrix Arrow Indicator MT5 ,   forex ,   emtialar ,   kripto   para birimleri ,   endeksler ,   hisse senetleri   gibi tüm sembollerde/araçlarda kullanılabilen   %100 yeniden boyamayan   çoklu zaman çerçevesi göstergesini izleyen benzersiz bir 10'u 1 arada trenddir.  Matrix Arrow Indicator MT5 , mevcut eğilimi erken aşamalarında belirleyecek ve aşağıdakiler gibi 10'a kadar standart göstergeden bilgi ve veri toplayacaktır: Ortalama Yönlü Hareket Endeksi (ADX) Emtia Kanal Endeksi (CCI) Klasik Hei
Top indicator for MT5   providing accurate signals to enter a trade without repainting! It can be applied to any financial assets:   forex, cryptocurrencies, metals, stocks, indices .  Watch  the video  (6:22) with an example of processing only one signal that paid off the indicator! MT4 version is here It will provide pretty accurate trading signals and tell you when it's best to open a trade and close it. Most traders improve their trading results during the first trading week with the help of
FxaccurateLS
Shiv Raj Kumawat
WHY IS OUR FXACCCURATE LS MT5 THE PROFITABLE ? PROTECT YOUR CAPITAL WITH RISK MANAGEMENT Gives entry, stop and target levels from time to time. It finds Trading opportunities by analyzing what the price is doing during established trends. POWERFUL INDICATOR FOR A RELIABLE STRATEGIES We have made these indicators with a lot of years of hard work. It is made at a very advanced level. Established trends provide dozens of trading opportunities, but most trend indicators completely ignore them!
AT Forex Indicator MT5
Marzena Maria Szmit
5 (4)
The AT Forex Indicator MT5 is a sophisticated trading tool designed to provide traders with a comprehensive analysis of multiple currency pairs. This powerful indicator simplifies the complex nature of the forex market, making it accessible for both novice and experienced traders. AT Forex Indicator uses advanced algorithms to detect trends, patterns and is an essential tool for traders aiming to enhance their forex trading performance. With its robust features, ease of use, and reliable signal
ICT, SMC, SMART MONEY CONCEPTS, SMART MONEY, Smart Money Concept, Support and Resistance, Trend Analysis, Price Action, Market Structure, Order Blocks, BOS/CHoCH,   Breaker Blocks ,  Momentum Shift,   Supply&Demand Zone/Order Blocks , Strong Imbalance,   HH/LL/HL/LH,    Fair Value Gap, FVG,  Premium  &   Discount   Zones, Fibonacci Retracement, OTE, Buy Side Liquidity, Sell Side Liquidity, BSL/SSL Taken, Equal Highs & Lows, MTF Dashboard, Multiple Time Frame, BigBar, HTF OB, HTF Market Structure
Advanced Supply Demand MT5
Bernhard Schweigert
4.5 (14)
Herhangi bir Acemi veya Uzman Tüccar için En İyi Çözüm! Bu gösterge benzersiz, yüksek kaliteli ve uygun fiyatlı bir ticaret aracıdır çünkü bir dizi tescilli özelliği ve yeni bir formülü bir araya getirdik. Bu güncelleme ile çift zaman dilimi dilimlerini gösterebileceksiniz. Yalnızca daha yüksek bir TF gösteremeyeceksiniz, aynı zamanda TF grafiğini ve ARTIK daha yüksek TF'yi de gösterebileceksiniz: YUVARLAK BÖLGELERİ GÖSTERMEK. Tüm Arz Talebi tüccarları buna bayılacak. :) Önemli Bilgiler Açıkland
TPA True Price Action indicator reveals the true price action of the market makers through 100% non-repainting signals strictly at the close of a candle! TPA shows entries and re-entries, every time the bulls are definitely stronger than the bears and vice versa. Not to confuse with red/green candles. The shift of power gets confirmed at the earliest stage and is ONE exit strategy of several. There are available now two free parts of the TPA User Guide for our customers. The first "The Basics"
XQ Indicator MetaTrader 5
Marzena Maria Szmit
3 (2)
Step into the realm of Forex trading with confidence and precision using XQ, a cutting-edge Forex indicator designed to elevate your trading game to unprecedented heights. Whether you're a seasoned trader or just stepping into the world of currency exchange, XQ Forex Indicator empowers you with the insights and signals needed to make informed trading decisions. The signal conditions are a combination of three indicators, and XQ Forex Indicator only display  medium and long-term trends . The ind
Protect against whipsaws: revolutionize your swing trading approach Special Offer: Purchase now to receive free bonuses worth $135! (Read more for details) Swing Trading is the first indicator designed to detect swings in the direction of the trend and possible reversal swings. It uses the baseline swing trading approach, widely described in trading literature. The indicator studies several price and time vectors to track the aggregate trend direction and detects situations in which the market i
FX Volume MT5
Daniel Stein
4.93 (14)
Sabah Brifingimiz aracılığıyla ayrıntılar ve ekran görüntüleri ile günlük piyasa güncellemenizi alın burada mql5 ve on Telegram ! FX Volume, bir brokerin bakış açısından piyasa duyarlılığı hakkında GERÇEK bir fikir veren İLK ve TEK hacim göstergesidir. COT raporlarından çok daha hızlı bir şekilde, brokerlar gibi kurumsal piyasa katılımcılarının Forex piyasasında nasıl konumlandıklarına dair harika bilgiler sağlar. Bu bilgileri doğrudan grafiğinizde görmek, ticaretiniz için gerçek oyun değiştir
Noize Absorption Index - is the manual trading system that measures the difference of pressure between bears forces and bulls forces. Green line - is a noize free index that showing curent situation. Zero value of index shows totally choppy/flat market.Values above zero level shows how powerfull bullish wave is and values below zero measures bearish forces.Up arrow appears on bearish market when it's ready to reverse, dn arrow appears on weak bullish market, as a result of reverse expectation.
Unlock key market insights with automated support and resistance lines Special Offer: Purchase now to receive free bonuses worth $75! (Read more for details) Tired of plotting support and resistance lines? This is a multi-timeframe indicator that detects and plots supports and resistance lines in the chart with the same precision as a human eye would. As price levels are tested over time and its importance increases, the lines become thicker and darker, making price leves easy to glance and ev
Gold Trend 5
Sergei Linskii
5 (1)
Altın Trend - bu iyi bir hisse senedi teknik göstergesidir. Gösterge algoritması, bir varlığın fiyat hareketini analiz eder ve oynaklığı ve potansiyel giriş bölgelerini yansıtır. En iyi gösterge sinyalleri: - SATIŞ için = kırmızı histogram + kırmızı KISA işaretçi + aynı yönde sarı sinyal oku. - AL için = mavi histogram + mavi UZUN işaretçi + aynı yönde aqua sinyal oku. Göstergenin faydaları: 1. Gösterge yüksek doğrulukta sinyaller üretir. 2. Onaylanmış bir ok sinyali yalnızca trend
Bu gösterge paneli, seçilen semboller için ticaret stratejinize bağlı olarak hem ölçeklendirme hem de uzun vadeli modda grafikteki   Arz ve Talep   bölgelerini keşfeder ve görüntüler. Ek olarak, gösterge tablosunun tarayıcı modu, istediğiniz tüm sembolleri bir bakışta kontrol etmenize ve uygun pozisyonları kaçırmamanıza yardımcı olur /   MT4 sürümü Ücretsiz gösterge:   Basic Supply Demand Özellikler Birden fazla döviz çiftinde   alım satım fırsatlarını görüntülemenize olanak tanıyarak,
The Price Action Finder Multi indicator is an indicator of entry points that searches for and displays Price Action system patterns on dozens of trading instruments and on all standard time frames: (m1, m5, m15, m30, H1, H4, D1, Wk, Mn). The indicator places the found patterns in a table at the bottom of the screen. By clicking on the pattern names in the table, you can move to the chart where this pattern is located. Manual (Be sure to read before purchasing) | Version for MT4 Advantages 1. Pa
Yazarın diğer ürünleri
Herhangi bir ticaret stratejisini bir pozisyon ticaret stratejisine dönüştürün veya size karşı hareket eden pozisyonlar için otomatik düşüş kontrol sistemi de dahil olmak üzere kanıtlanmış RSI ve ADR tabanlı pozisyon ticaret stratejilerini takas edin. Bu EA, uzun yıllardan beri Market Structure Trader web sitesinde öğretilen pozisyon ticaret stratejileri için kullanılan MRA EA'nın geliştirilmiş hali ve basitleştirilmiş halidir. Web sitesine bağlantı, ücretsiz pozisyon ticareti kursu ve diğer ür
Piyasa Ters Çevirme Uyarıları EA, aynı adı taşıyan gösterge (burada mevcuttur) ve piyasa yapısı değişimlerine dayalı işlemler tarafından desteklenmektedir. EA, gösterge tarafından her piyasa geri dönüş uyarısı gönderildiğinde varsayılan olarak bir alım satım yapacak ve bu uyarıları EA ayarlarında belirlediğiniz koşullara ve filtrelere göre takas edecektir. Fiyat, mevcut eğilim yönünde hareket ederken destek dikdörtgenleri çizer ve fiyat keskin bir şekilde tersine döndüğünde işlem görür ve
Fiyat tersine döndükçe ve geri çekildikçe piyasa yapısından elde edilen kâr değişir. Piyasa yapısını tersine çevirme uyarısı göstergesi, bir trendin veya fiyat hareketinin ne zaman tükenmeye yaklaştığını ve tersine dönmeye hazır olduğunu tanımlar. Genellikle bir geri dönüş veya büyük bir geri çekilme meydana gelmek üzereyken meydana gelen piyasa yapısındaki değişiklikler konusunda sizi uyarır. Gösterge, olası bir tükenme noktasının yakınında her yeni yüksek veya düşük oluştuğunda, başlangıçta
Bu gösterge panosu, piyasa yapısını tersine çevirme göstergesiyle kullanım için bir uyarı aracıdır. Birincil amacı, belirli zaman dilimlerinde geri dönüş fırsatları ve ayrıca göstergenin yaptığı gibi uyarıların yeniden test edilmesi (onay) konusunda sizi uyarmaktır. Pano, kendi başına bir grafik üzerinde oturacak ve seçtiğiniz çiftler ve zaman dilimlerinde size uyarılar göndermek için arka planda çalışacak şekilde tasarlanmıştır. Piyasa tersine çevrilme göstergesinin tek bir MT4'te birden fazla
Hisse senedi endekslerinin açılışında meydana gelen patlayıcı hareketlerden yararlanın ve kendinize her gün harekete geçirilebilir bir avantaj sağlayın. Açılış aralığı patlaması EA, DAX, DOW, NASDAQ ve S&P500 gibi ana hisse senedi endekslerinde her gün açılıştan hemen sonra oluşan trendleri yakalamak için beğeninize göre ayarlanabilir. Bu açılışlar her gün aynı saatte gerçekleşir, böylece volatilitenin ne zaman ortaya çıkacağını bilirsiniz ve genellikle bu EA ile yakalayabileceğiniz ve tüm işle
Forex portföyünüzün kontrolünü elinize alın. Nerede durduğunuzu, neyin işe yaradığını ve size neyin acı verdiğini anında görün! MT5 VERSİYONU BURADA MEVCUTTUR: https://www.mql5.com/en/market/product/58658 Trade Manager Dashboard, forex piyasasında sahip olduğunuz her pozisyonun şu anda nerede olduğunu bir bakışta size göstermek ve risk yönetimini ve para birimlerine maruz kalmayı daha kolay anlamak için tasarlanmıştır. Birden fazla pozisyon veya ticaret ızgarası ve sepet stratejileri ile kade
Fiyat tersine döndükçe ve geri çekildikçe piyasa yapısından elde edilen kâr değişir. Piyasa yapısını tersine çevirme uyarısı göstergesi, bir trendin veya fiyat hareketinin ne zaman tükenmeye yaklaştığını ve tersine dönmeye hazır olduğunu tanımlar. Genellikle bir geri dönüş veya büyük bir geri çekilme meydana gelmek üzereyken meydana gelen piyasa yapısındaki değişiklikler konusunda sizi uyarır. Gösterge, olası bir tükenme noktasının yakınında her yeni yüksek veya düşük oluştuğunda, başlangıçta
Grafiğinizde otomatik olarak destek ve direnç seviyeleri PLUS itici mum boşlukları çizin, böylece fiyatın nereye gidebileceğini ve / veya potansiyel olarak tersine dönebileceğini görebilirsiniz. Bu gösterge, web sitemde (The Market Structure Trader) öğretilen pozisyon ticareti metodolojisinin bir parçası olarak kullanılmak üzere tasarlanmıştır ve hedefleme ve potansiyel girişler için temel bilgileri görüntüler. Göstergede 2 TEMEL özellik ve 4 ek özellik bulunmaktadır: TEMEL ÖZELLİK 1 - Günl
Herhangi bir ticaret stratejisini bir pozisyon ticaret stratejisine dönüştürün veya size karşı hareket eden pozisyonlar için otomatik düşüş kontrol sistemi de dahil olmak üzere kanıtlanmış RSI ve ADR tabanlı pozisyon ticaret stratejilerini takas edin. Bu EA, uzun yıllardan beri Market Structure Trader web sitesinde öğretilen pozisyon ticaret stratejileri için kullanılan MRA EA'nın geliştirilmiş hali ve basitleştirilmiş halidir. Web sitesine bağlantı, ücretsiz pozisyon ticareti kursu ve diğer ür
ADR Alert Dashboard
LEE SAMSON
3.83 (12)
ADR Uyarı Gösterge Tablosu, normal ortalama günlük aralığa göre fiyatın şu anda nerede işlem gördüğünü bir bakışta size gösterir. Fiyat, ortalama aralığı ve seçtiğiniz seviyenin üzerindeki seviyeleri aştığında, açılır pencere, e-posta veya push yoluyla anında uyarılar alacaksınız, böylece hızlı bir şekilde geri çekilmelere ve geri dönüşlere atlayabilirsiniz. Çizgi, boş bir çizelgeye yerleştirilmek üzere tasarlanmıştır ve sadece arka planda oturun ve seviyelere ulaşıldığında sizi uyarır, böylece
RSI / TDI uyarı panosu, ticaret yaptığınız her büyük çiftte RSI'leri (sizin tarafınızdan seçilebilir) bir kerede izlemenize olanak tanır. İki şekilde kullanabilirsiniz: 1. Birden fazla zaman çerçevesi seçin ve çizgi, normal ticaret koşullarının ötesine geçen birden fazla zaman çerçevesi olduğunda size gösterecektir. Birden fazla zaman diliminde aşırı alım veya aşırı satım seviyesine ulaştığı için fiyatın son zamanlarda sert bir şekilde yükseldiğinin harika bir göstergesi, bu nedenle yakın
Piyasa Ters Çevirme Uyarıları EA, aynı adı taşıyan gösterge ( https://www.mql5.com/en/market/product/57892 ) ve piyasa yapısı değişimlerine dayalı işlemler tarafından desteklenmektedir. EA, gösterge tarafından her piyasa geri dönüş uyarısı gönderildiğinde varsayılan olarak bir alım satım yapacak ve bu uyarıları EA ayarlarında belirlediğiniz koşullara ve filtrelere göre takas edecektir. Fiyat, mevcut eğilim yönünde hareket ederken destek dikdörtgenleri çizer ve fiyat keskin bir şekilde ter
ADR Ters Çevirme Göstergesi, normal ortalama günlük aralığına göre fiyatın şu anda nerede işlem gördüğünü bir bakışta size gösterir. Fiyat, ortalama aralığı ve seçtiğiniz seviyenin üzerindeki seviyeleri aştığında, açılır pencere, e-posta veya push yoluyla anında uyarılar alacaksınız, böylece hızlı bir şekilde geri çekilmelere ve geri dönüşlere atlayabilirsiniz. Gösterge, grafikte ortalama günlük aralık uç noktalarında yatay çizgiler ve ayrıca fiyatları aşan matematiksel olasılıkları olan seviye
Büyük hisse senedi endekslerinin açılış volatilitesinden yararlanın ve piyasanın açılış zilinde kırıldığı anlarda oluşan ani hareketlerden kar elde edin. Stratejilerin amacı, piyasanın açıkta ve hareket eden bankada tek yönde hızlı ve sert hareket ettiği günlerden faydalanmaktır. Piyasa zayıf ve yönsüz açılırsa EA, riskten korunma kaybına kilitlenir ve pozisyonlardan çıkmadan önce piyasanın bir yöne karar vermesini bekler. Hisse senedi endeksi hedge'i EA, açılıştan önceki aralığı analiz eder ve
Simetrik bir üçgen grafik paterni, fiyat yükselmeye veya kırılmaya zorlanmadan önceki bir daralma ve konsolidasyon dönemini temsil eder. Alt trend çizgisinden bir kırılma, yeni bir düşüş eğiliminin başlangıcını işaret ederken, üst trend çizgisinden bir kırılma, yeni bir yükseliş trendinin başlangıcını gösterir. Simetrik üçgen kalıpları için takas ettiğiniz tüm enstrümanları ve zaman dilimlerini bir kerede izlemek için kontrol panelini edinin! https://www.mql5.com/en/market/product/69169/ MT5
Büyük hisse senedi endekslerinin açılış volatilitesinden yararlanın ve piyasanın açılış zilinde kırıldığı anlarda oluşan ani hareketlerden kar elde edin. Stratejilerin amacı, piyasanın açıkta ve hareket eden bankada tek yönde hızlı ve sert hareket ettiği günlerden faydalanmaktır. Piyasa zayıf ve yönsüz açılırsa EA, riskten korunma kaybına kilitlenir ve pozisyonlardan çıkmadan önce piyasanın bir yöne karar vermesini bekler. Hisse senedi endeksi hedge'i EA, açılıştan önceki aralığı analiz eder ve
Hisse senedi endekslerinin açılışında meydana gelen patlayıcı hareketlerden yararlanın ve kendinize her gün harekete geçirilebilir bir avantaj sağlayın. Açılış aralığı patlaması EA, DAX, DOW, NASDAQ ve S&P500 gibi ana hisse senedi endekslerinde her gün açılıştan hemen sonra oluşan trendleri yakalamak için beğeninize göre ayarlanabilir. Bu açılışlar her gün aynı saatte gerçekleşir, böylece volatilitenin ne zaman ortaya çıkacağını bilirsiniz ve genellikle bu EA ile yakalayabileceğiniz ve tüm işle
ADR Ters Çevirme Göstergesi, normal ortalama günlük aralığına göre fiyatın şu anda nerede işlem gördüğünü bir bakışta size gösterir. Fiyat, ortalama aralığı ve seçtiğiniz seviyenin üzerindeki seviyeleri aştığında, açılır pencere, e-posta veya push yoluyla anında uyarılar alacaksınız, böylece hızlı bir şekilde geri çekilmelere ve geri dönüşlere atlayabilirsiniz. Gösterge, grafikte ortalama günlük aralık uç noktalarında yatay çizgiler ve ayrıca fiyatları aşan matematiksel olasılıkları olan seviye
ADR Uyarı Gösterge Tablosu, normal ortalama günlük aralığa göre fiyatın şu anda nerede işlem gördüğünü bir bakışta size gösterir. Fiyat, ortalama aralığı ve seçtiğiniz seviyenin üzerindeki seviyeleri aştığında, açılır pencere, e-posta veya push yoluyla anında uyarılar alacaksınız, böylece hızlı bir şekilde geri çekilmelere ve geri dönüşlere atlayabilirsiniz. Çizgi, boş bir çizelgeye yerleştirilmek üzere tasarlanmıştır ve sadece arka planda oturun ve seviyelere ulaşıldığında sizi uyarır, böylece
Simetrik bir üçgen grafik paterni, fiyat yükselmeye veya kırılmaya zorlanmadan önceki bir daralma ve konsolidasyon dönemini temsil eder. Alt trend çizgisinden bir kırılma, yeni bir düşüş eğiliminin başlangıcını işaret ederken, üst trend çizgisinden bir kırılma, yeni bir yükseliş trendinin başlangıcını gösterir. MT4 Sürümü Burada Bulunmaktadır: https://www.mql5.com/en/market/product/68709/ Bu gösterge, bu kalıpları tanımlar ve 4 kilit nokta oluştuğunda ve fiyat tekrar üçgene geri döndüğünde
RSI / TDI uyarı panosu, ticaret yaptığınız her büyük çiftte RSI'leri (sizin tarafınızdan seçilebilir) bir kerede izlemenize olanak tanır. İki şekilde kullanabilirsiniz: 1. Birden fazla zaman çerçevesi seçin ve çizgi, normal ticaret koşullarının ötesine geçen birden fazla zaman çerçevesi olduğunda size gösterecektir. Birden fazla zaman diliminde aşırı alım veya aşırı satım seviyesine ulaştığı için fiyatın son zamanlarda sert bir şekilde yükseldiğinin harika bir göstergesi, bu nedenle yakın
Simetrik üçgen formasyon panosu, burada bulunan simetrik üçgen formasyon göstergesi tarafından çizilen simetrik üçgen formasyonları için birden fazla piyasayı ve zaman dilimini aynı anda izlemenizi sağlar: https://www.mql5.com/en/market/product/68709/ Simetrik üçgen modellerinin nasıl oluşturulduğu ve bunları takas etmek için izlenmesi kolay stratejiler hakkında daha fazla bilgi edinmek için yukarıdaki göstergeyi ziyaret edin. Gösterge paneli bağımsız bir üründür ve göstergenin çalışmasını GE
Bu gösterge panosu, piyasa yapısını tersine çevirme göstergesiyle kullanım için bir uyarı aracıdır. Birincil amacı, belirli zaman dilimlerinde geri dönüş fırsatları ve ayrıca göstergenin yaptığı gibi uyarıların yeniden test edilmesi (onay) konusunda sizi uyarmaktır. Pano, kendi başına bir grafik üzerinde oturacak ve seçtiğiniz çiftler ve zaman dilimlerinde size uyarılar göndermek için arka planda çalışacak şekilde tasarlanmıştır. Piyasa tersine çevrilme göstergesinin tek bir MT4'te birden fazla
Forex portföyünüzün kontrolünü elinize alın. Nerede durduğunuzu, neyin işe yaradığını ve size neyin acı verdiğini anında görün! MT4 VERSİYONU BURADA MEVCUTTUR: https://www.mql5.com/en/market/product/58375 Trade Manager Dashboard, forex piyasasında sahip olduğunuz her pozisyonun şu anda nerede olduğunu bir bakışta size göstermek ve risk yönetimini ve para birimlerine maruz kalmayı daha kolay anlamak için tasarlanmıştır. Birden fazla pozisyon veya ticaret ızgarası ve sepet stratejileri ile kade
Fiyat eylemi araç seti EA, öncelikle scalpers için tasarlanmıştır, ancak durdurma seviyenize göre doğru hesaplanmış lot büyüklüğü ile pazara hızlı bir şekilde girmek için tüm zaman dilimlerinde kullanılabilir. emirler) ve ardından durakları ayarlayın ve piyasa hareket ettikçe kar elde edin. Kullanılacak tüm özelliklerin, ayarların ve en iyi uygulama stratejisinin tam listesi için burayı tıklayın: https://www.mql5.com/en/blogs/post/748072 Riske Dayalı Giriş Hızlı sipariş düğmeleri, hesabınız
Fiyat eylemi araç seti EA, öncelikle scalpers için tasarlanmıştır, ancak durdurma seviyenize göre doğru hesaplanmış lot büyüklüğü ile pazara hızlı bir şekilde girmek için tüm zaman dilimlerinde kullanılabilir. emirler) ve ardından durakları ayarlayın ve piyasa hareket ettikçe kar elde edin. Kullanılacak tüm özelliklerin, ayarların ve en iyi uygulama stratejisinin tam listesi için burayı tıklayın:   https://www.mql5.com/en/blogs/post/748072 Riske Dayalı Giriş Hızlı sipariş düğmeleri, hesabın
SONUNDA! MT4 için bir grafikte birden çok zaman çerçevesi gösteren stokastik bir gösterge! Eğitimli ticaret kararları vermenize yardımcı olmak için ana ve sinyal çizgilerinin gerçek konumunu 4 ayrı zaman diliminde anında görün. Göstergenin onlara ne söylediğini görsel olarak görmesi gereken tüccarlar için gerçek bir MTF stokastik göstergesi, ok yok sadece yukarı veya aşağı işaret edin veya gösterilen sayılar. Artık diğer stokastiklerin nerede olduğunu görmek için zaman dilimleri arasında gezinm
Filtrele:
Blobini
54
Blobini 2024.07.09 16:41 
 

Doesn't work. Prints a lot of false targets. Also the performance is very bad. No support from developer whatsoever ("well, no problems with it on my end...").

LEE SAMSON
64001
Geliştiriciden yanıt LEE SAMSON 2024.07.09 16:59
Yes works fine. I think you were the person who had an issue with their terminal in the Discord support. If you try another terminal/broker maybe that will help identify the issue, but working fine for my terminal and no other purchasers have an issue so it's isolated your end unfortunately. :(
Betatester69
181
Betatester69 2024.05.06 20:22 
 

Quite useful indicator, shows fvg's, important highs/lows, candle timer and a few other useful things. Takes a while to load on mt5 but that is just mt5...much better on mt4 I hear but I had already bought this. Part and parcel now of the position trading strategy that I use thanks to the author.

camira
224
camira 2023.06.02 18:07 
 

absolutely good tool! Is highly recommended! Thanks Lee ;))

İncelemeye yanıt
Sürüm 1.40 2024.04.11
v1.4 - bug update - offsets for pips in profit was not working correctly, now adjusts the Y axis setting as it should