Currency Power Meter Linear MT5
- Göstergeler
- Sergey Efimenko
- Sürüm: 2.4
- Güncellendi: 17 Ocak 2022
- Etkinleştirmeler: 15
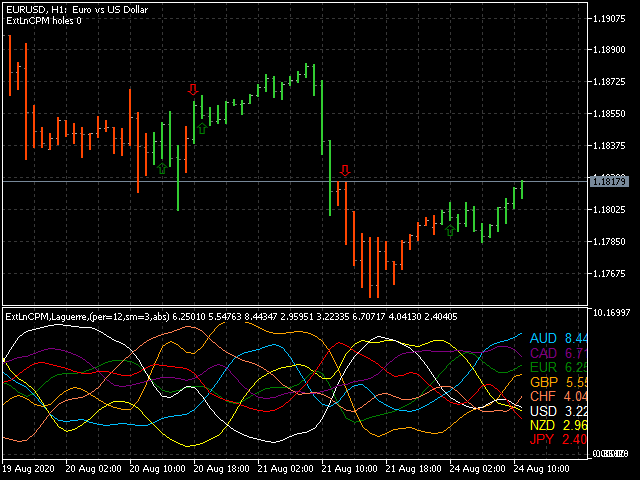
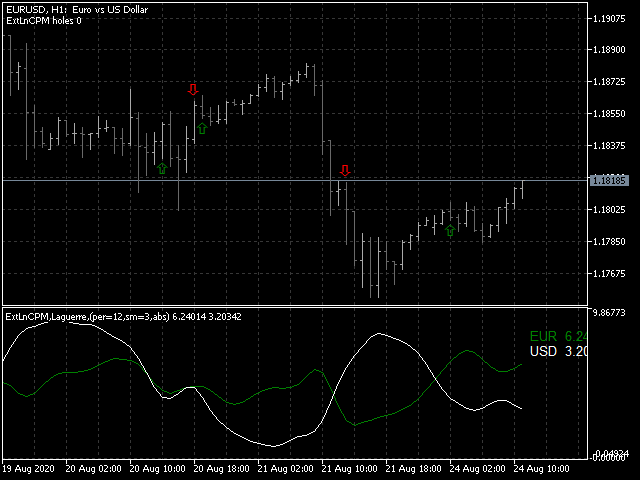
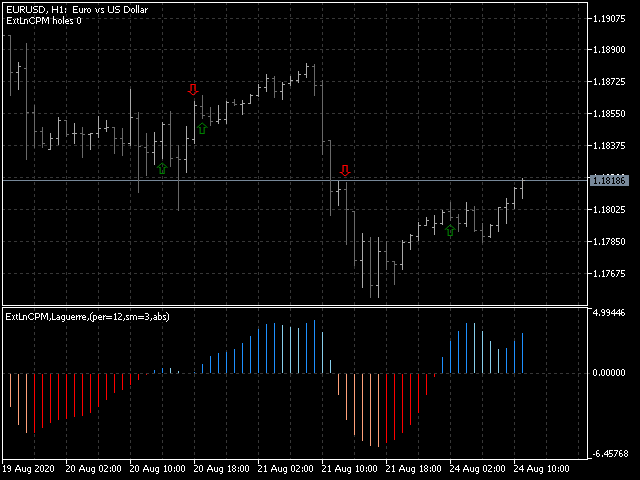
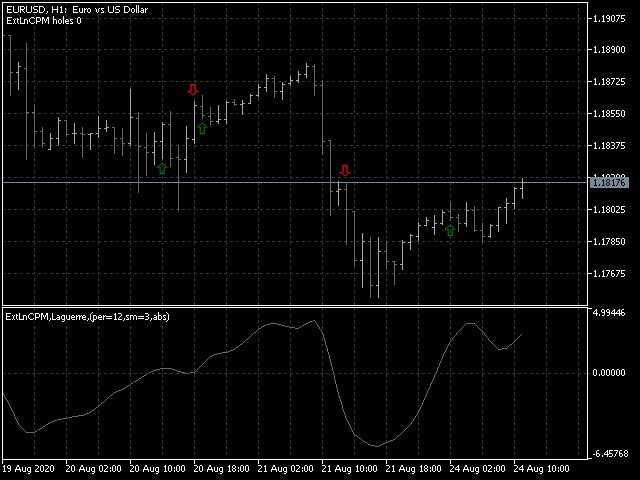
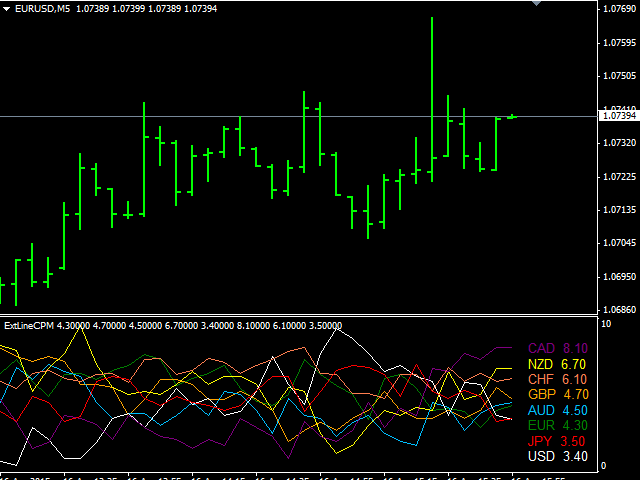
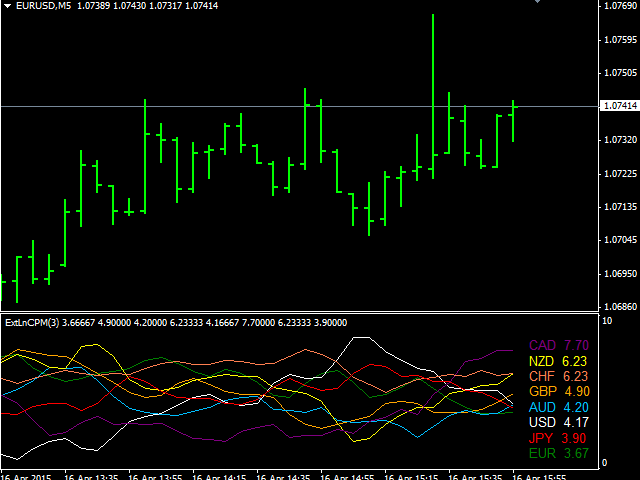
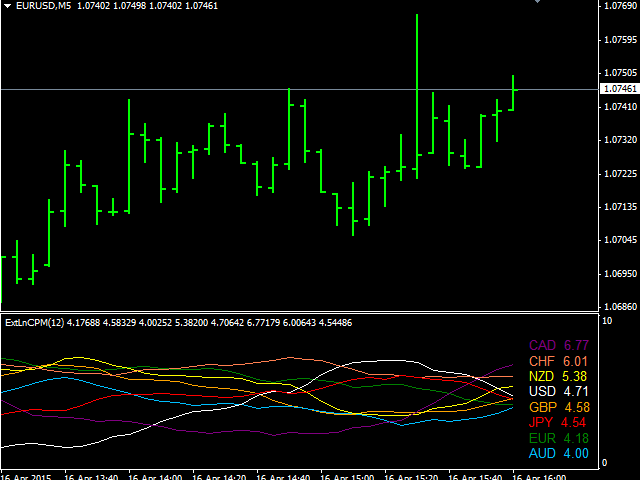
Bu, değerleri yumuşatarak filtreleme yeteneğine sahip bir para birimi gücünün doğrusal bir göstergesidir. Seçilen para birimlerinin mevcut gücünü (maksimum sayı 8'dir) ve geçmiş değerleri gösterir. Hesaplama, göstergenin başlatıldığı seçili grafik zaman dilimine bağlıdır.
Gösterge, verileri tüm para birimleri için satırlar veya mevcut para birimi çifti için bir histogram olarak görüntüler. Mevcut döviz çifti için döviz gücü endekslerinin kesişimi ek olarak grafikte oklar olarak görüntülenir. Mevcut trend yönü, çubukların renklendirilmesiyle vurgulanır.
Ana ayarlar:
- iPeriod - para birimi gücünü analiz etmek için kullanılan çubuk sayısı.
- HistoryBars - geçmiş üzerinde hesaplanan çubukların sayısı. Parametre, ilk başlatma sırasında yürütme süresini etkiler. Bir aracının geçmiş uzunluğu üzerinde sınırlaması olması durumunda, gerekli geçmiş verilerini azaltmak için de gereklidir.
- SmoothingPeriod - veri yumuşatma süresi (düzleştirmeyi etkinleştirmek için 1'e ayarlayın).
- SmoothingMethod - veri yumuşatma yöntemi.
- ShowPairLabels - gösterge penceresinin sol kısmında para birimlerinin adlarını içeren ekran etiketlerini etkinleştirin/devre dışı bırakın.
- LabelsFontSize - para birimi etiketi yazı tipi boyutu.
- ShowRatio1-8 - görüntülenecek para birimi adı.
- UsePairs - para birimi gücü hesaplaması için sembollerin listesi.
- PairPreffix - döviz çiftlerinin ek ön eki. Örneğin, EURUSD.e sembolünde ".e" bir önektir.
- ShowWarningComments - işlem hatalarıyla ilgili yorumları etkinleştirin/devre dışı bırakın, örneğin, bir aracı tarafında sembol tırnaklarının olmaması veya yetersiz sembol geçmişi uzunluğu.

Отличная работа! Индикатор не только самостоятельная торговая система, но и прекрасный фильтр для других инструментов! Спасибо за обновление!