Boom and Crash Spike Detector Indicator for MT5
- Göstergeler
- STE S.S.COMPANY
- Sürüm: 1.0
- Etkinleştirmeler: 10
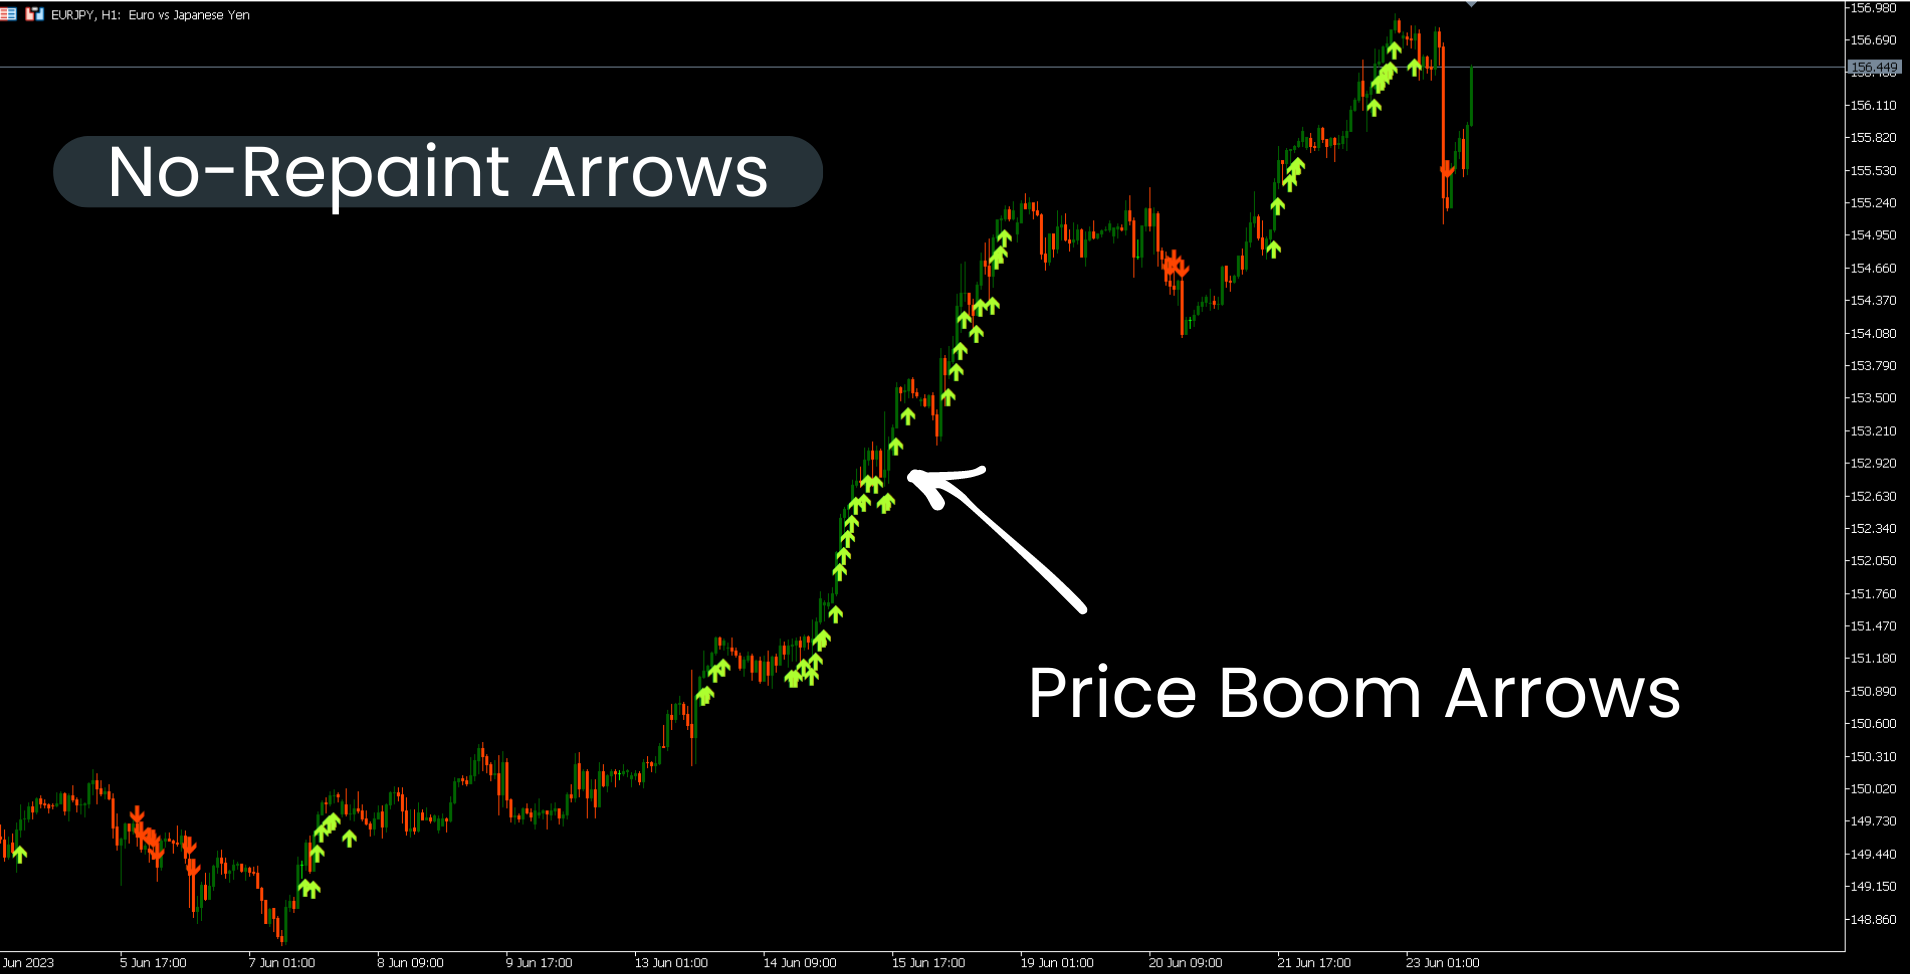
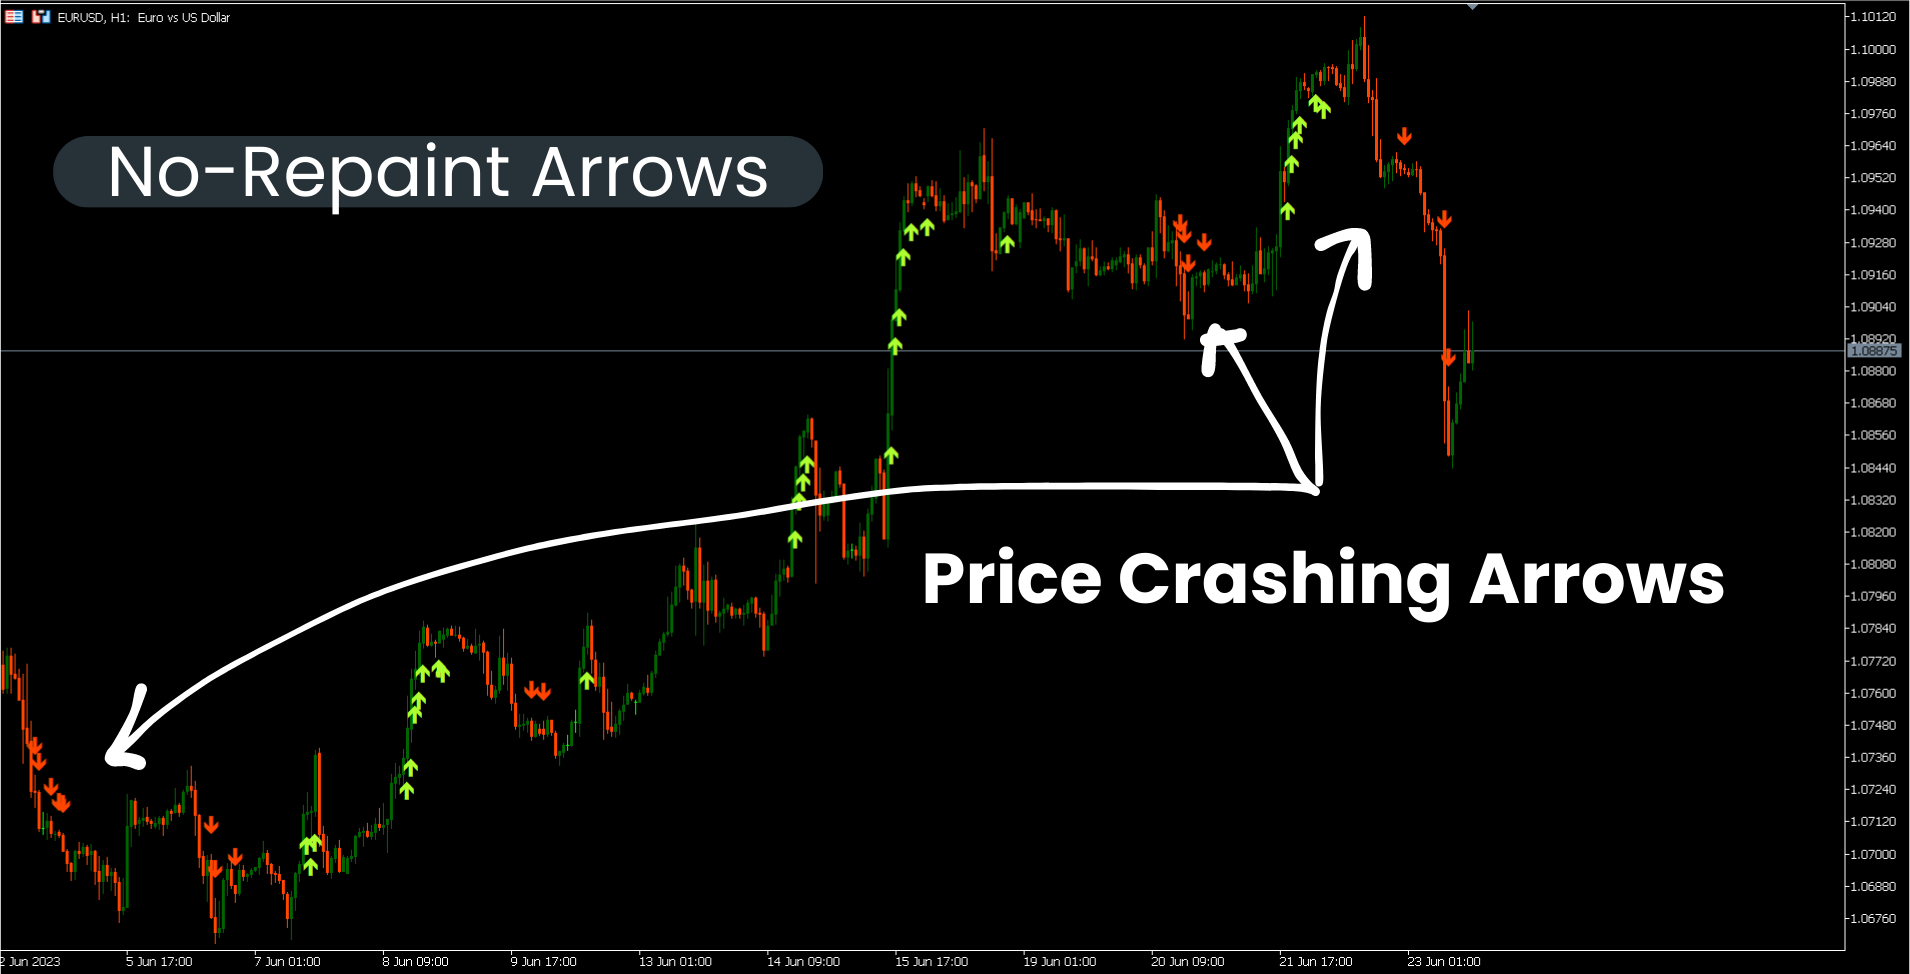
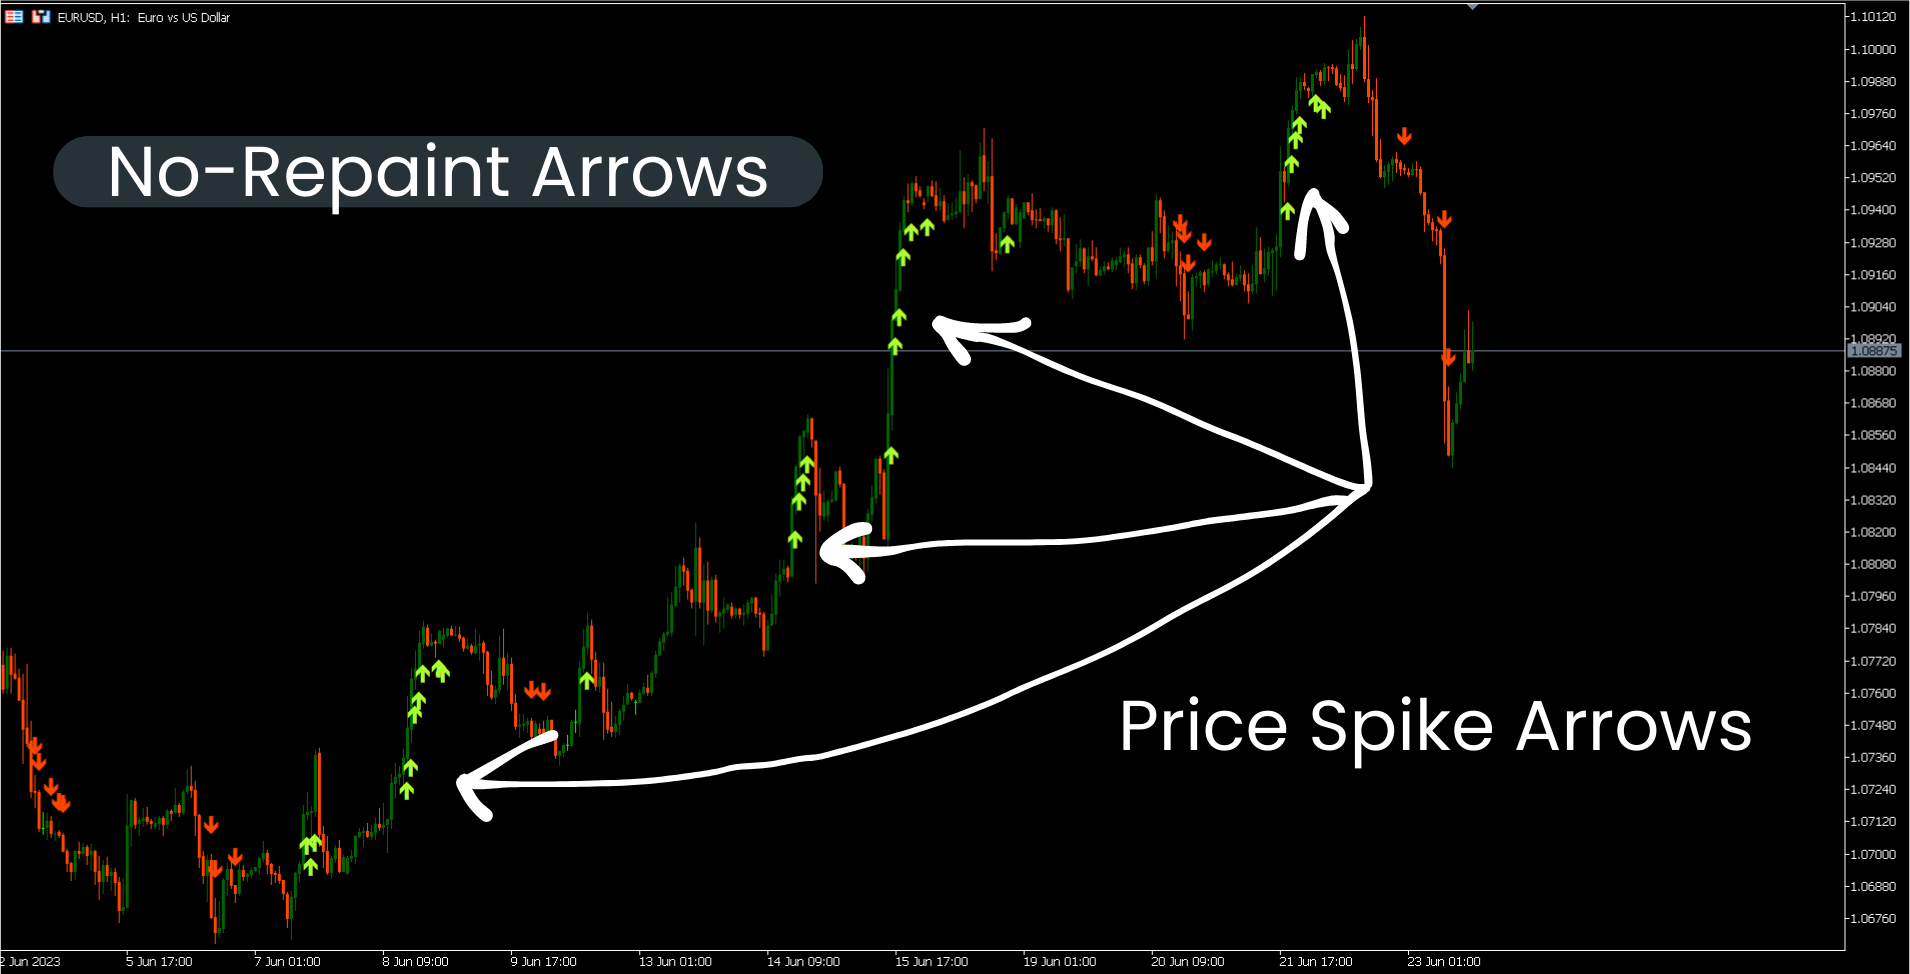
Boom ve Crash Spike Detector göstergesi, öncelikli olarak fiyatlardaki Boom ve Crash'i tespit etmek için gelişmiş bir stratejiye dayalı olarak kodlanmıştır. Fiyatlardaki yüksek olasılıklı Boom'ları ve Crash'leri tespit etmek için karmaşık algoritmalar yerleştirildi. Olası Patlama veya kilitlenme aşamalarında uyarı verir:
- Boom Phase: Fiyat çok hızlı arttığında.
- Çökme Aşaması: Fiyat çok hızlı düştüğünde.
SINIRLI SÜRELİ TEKLİF: Gösterge yalnızca 30 $ ve ömür boyu kullanılabilir.
Ana Özellikler
- Cep telefonuna push bildirimleri gönderir
- Bilgisayar veya dizüstü bilgisayarda açılır ve sesli uyarılar
- Yeniden boyamayan okları görüntüler (Potansiyel Patlama için yukarı oklar ve Olası Kilitlenme için aşağı oklar)
- Tüm çiftlerle çalışmak.
Öneri
- Zaman Çerçevesi: H1 ve H4
- Önerilen çiftler : Trend aşamalarındaki çiftler.
İletişim
Herhangi bir sorunuz varsa veya yardıma ihtiyacınız varsa, Özel Mesaj yoluyla bana ulaşın.
Yazar
SAYADI ACHREF , fintech yazılım mühendisi ve Finansya'nın kurucusu.
P0werful indicat0r, f0r b00m and crash H1 H4 Thumb up!