Linear Regression Trend MQL5
- Göstergeler
- Nery Adrian Gay
- Sürüm: 1.1
- Güncellendi: 25 Temmuz 2020
- Etkinleştirmeler: 5
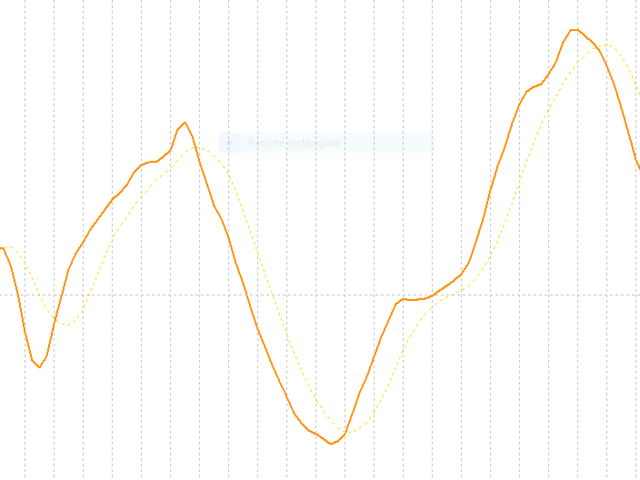
Representation of the slope value of the linear regression. It has a reference plot to visually determine changes in the slope value (acceleration / deceleration of the price).
PARAMETERS
• Periods: number of periods to calculate linear regression
• PeriodsReference: number of periods for the calculation of the moving average on the values of the main plot
• Displacement: displacement on the horizontal axis
• AppliedPrice: price on which the calculations are made
• MainPlot: display of the main plot
• ReferencePlot: display of the reference plot
SUGGESTIONS FOR USE
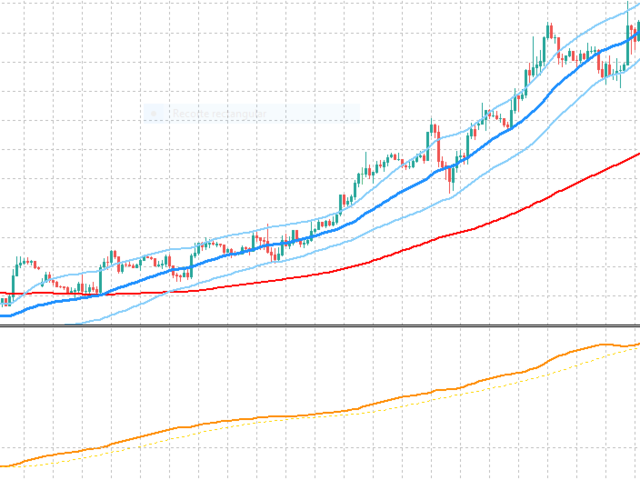
• Allows you to easily view the current price trend. If the MainPlot is greater than zero, the trend is positive and negative if it is less than zero.
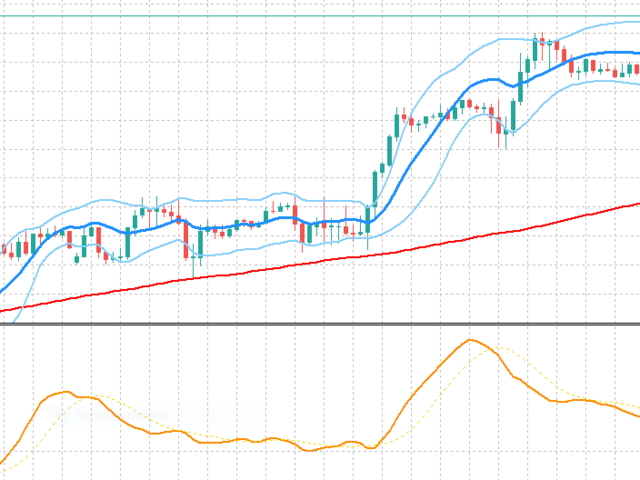
• It allows to easily visualize the changes in the slope (acceleration / deceleration of the price). If the MainPlot is above the ReferencePlot, the price is accelerating and if it is below, the price is decelerating.
• Ideal for swing trading or high speed trading.
• Ideal to determine the main direction of trade (BUY / SELL).
• It does not provide direct information on value areas (supports, resistances), so it is good to pair it with price indicators such as moving averages or Linear Regression Bands.
• Provides indirect information on market reaction zones (supports, resistances) when the MainPlot crosses zero (the crossing periods must be compared with the price area to determine the value zone to which the market reacted).
REMEMBER!!!…
• Indicators are just tools, there is no magic bullet, don't blindly believe in alerts.
• Stick to a trading style, prepare a strategy, be consistent with it, apply improvements if necessary.
• Study your tools and your alternatives well, don't forget to manage the money.
• Identify the trend direction, confirm it by another method if necessary, define your risk, identify value areas (supports and resistances), check how the market reacts to these value areas (price action), and don't forget Doing a fundamental analysis always helps a lot.
PARAMETERS
• Periods: number of periods to calculate linear regression
• PeriodsReference: number of periods for the calculation of the moving average on the values of the main plot
• Displacement: displacement on the horizontal axis
• AppliedPrice: price on which the calculations are made
• MainPlot: display of the main plot
• ReferencePlot: display of the reference plot
SUGGESTIONS FOR USE
• Allows you to easily view the current price trend. If the MainPlot is greater than zero, the trend is positive and negative if it is less than zero.
• It allows to easily visualize the changes in the slope (acceleration / deceleration of the price). If the MainPlot is above the ReferencePlot, the price is accelerating and if it is below, the price is decelerating.
• Ideal for swing trading or high speed trading.
• Ideal to determine the main direction of trade (BUY / SELL).
• It does not provide direct information on value areas (supports, resistances), so it is good to pair it with price indicators such as moving averages or Linear Regression Bands.
• Provides indirect information on market reaction zones (supports, resistances) when the MainPlot crosses zero (the crossing periods must be compared with the price area to determine the value zone to which the market reacted).
REMEMBER!!!…
• Indicators are just tools, there is no magic bullet, don't blindly believe in alerts.
• Stick to a trading style, prepare a strategy, be consistent with it, apply improvements if necessary.
• Study your tools and your alternatives well, don't forget to manage the money.
• Identify the trend direction, confirm it by another method if necessary, define your risk, identify value areas (supports and resistances), check how the market reacts to these value areas (price action), and don't forget Doing a fundamental analysis always helps a lot.