Raff Channel MT5
- Göstergeler
- Andrey Kaunov
- Sürüm: 1.1
- Etkinleştirmeler: 10
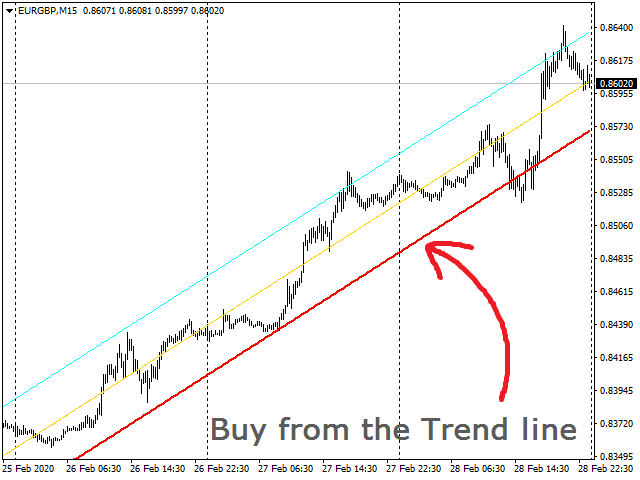
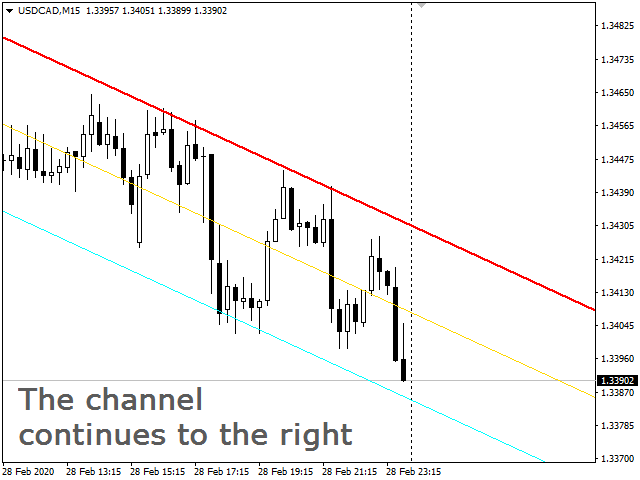
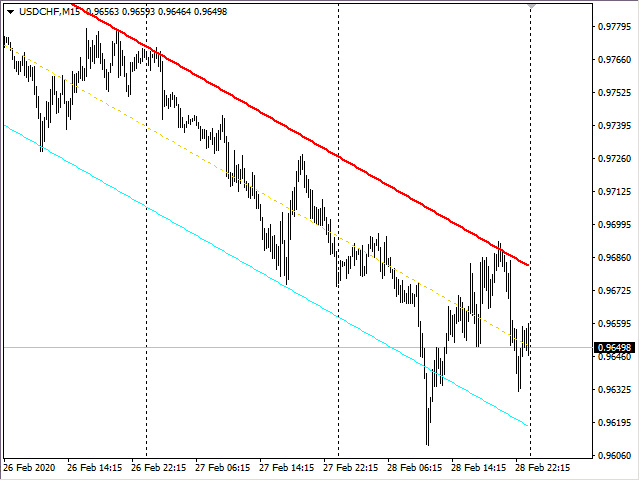
Индикатор строит канал Раффа на основе линейной регрессии. Красная линия тренда может использоваться для принятия решения о покупке или продаже внутрь канала при подходе цены к ней. Настройками можно задать ширину канала по коэффициенту отклонения от базовой линии или по максимальному и минимальному экстремуму. Так же можно включить продолжение канала вправо от текущих цен.
Индикатор канала регрессии Раффа – удобный инструмент, значительно облегчающий работу современного трейдера. Он может быть задействован практически на любом графике, возможно в связке с другими индикаторами.
Input parameters:
Number of bars to calculate - The number of bars in the history, starting from the current one for drawing the channelTrend line Deviation - Coefficient of deviation of the trend lineResistance line Deviation - Coefficient of deviation of the resistance lineUse Trend line Deviation - true: the trend line is based on the coefficient, false: the trend line is based on the extremeUse Resistance line Deviation - true: the resistance line is built by a coefficient, false: the resistance line is built by an extremeExtend channel to the right - Continue the channel to the right (ray to the right)Base line width - Width of the regression baselineBase line color - The color of the regression baselineTrend line width - The width of the trend lineTrend line color - The color of the trend lineResistance line width - The width of the resistance lineResistance line color - The color of the resistance line
Indicator buffers (for programmers):
   SetIndexBuffer(0,Base_line);
   PlotIndexSetDouble(0,PLOT_EMPTY_VALUE,0.0);
   PlotIndexSetString(0,PLOT_LABEL,"Base Line");

   SetIndexBuffer(1,Trend_line);
   PlotIndexSetDouble(1,PLOT_EMPTY_VALUE,0.0);
   PlotIndexSetString(1,PLOT_LABEL,"Trend Line");

   SetIndexBuffer(2,Res_line);
   PlotIndexSetDouble(2,PLOT_EMPTY_VALUE,0.0);
   PlotIndexSetString(2,PLOT_LABEL,"Resist Line");