Volume Orderflow Profile
- Göstergeler
- Suvashish Halder
- Sürüm: 1.0
- Etkinleştirmeler: 10
Introducing Volume Orderflow Profile, a versatile tool designed to help traders visualize and understand the dynamics of buying and selling pressure within a specified lookback period. Perfect for those looking to gain deeper insights into volume-based market behavior!
MT5 Version - https://www.mql5.com/en/market/product/122657
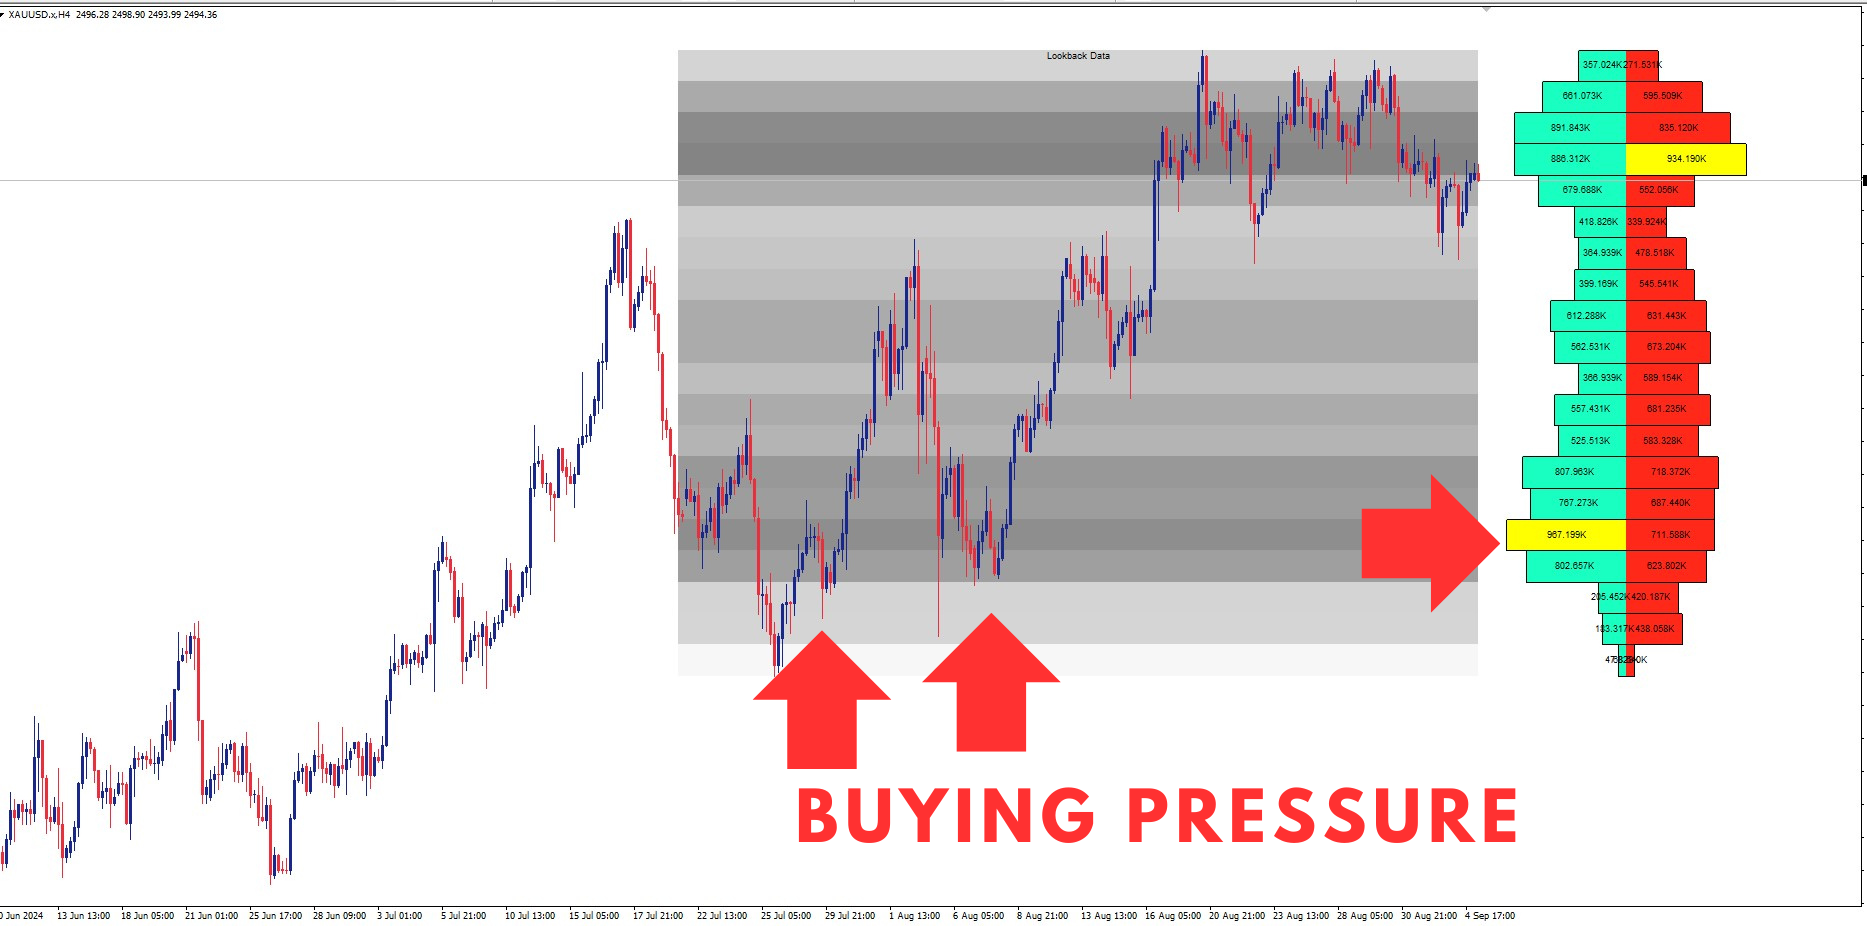
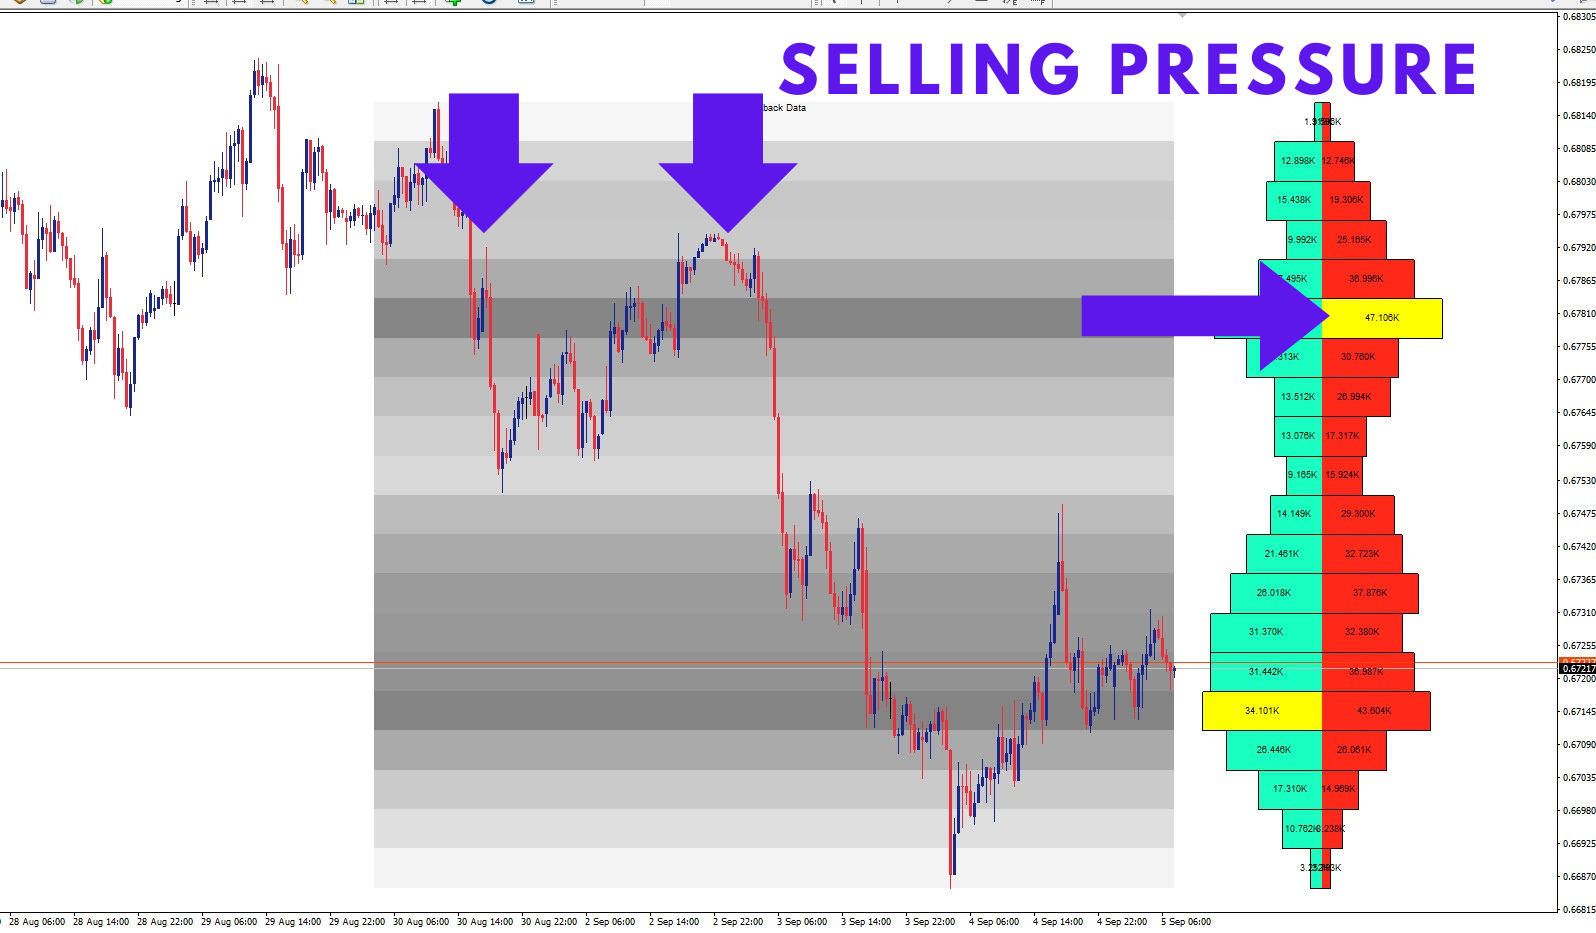
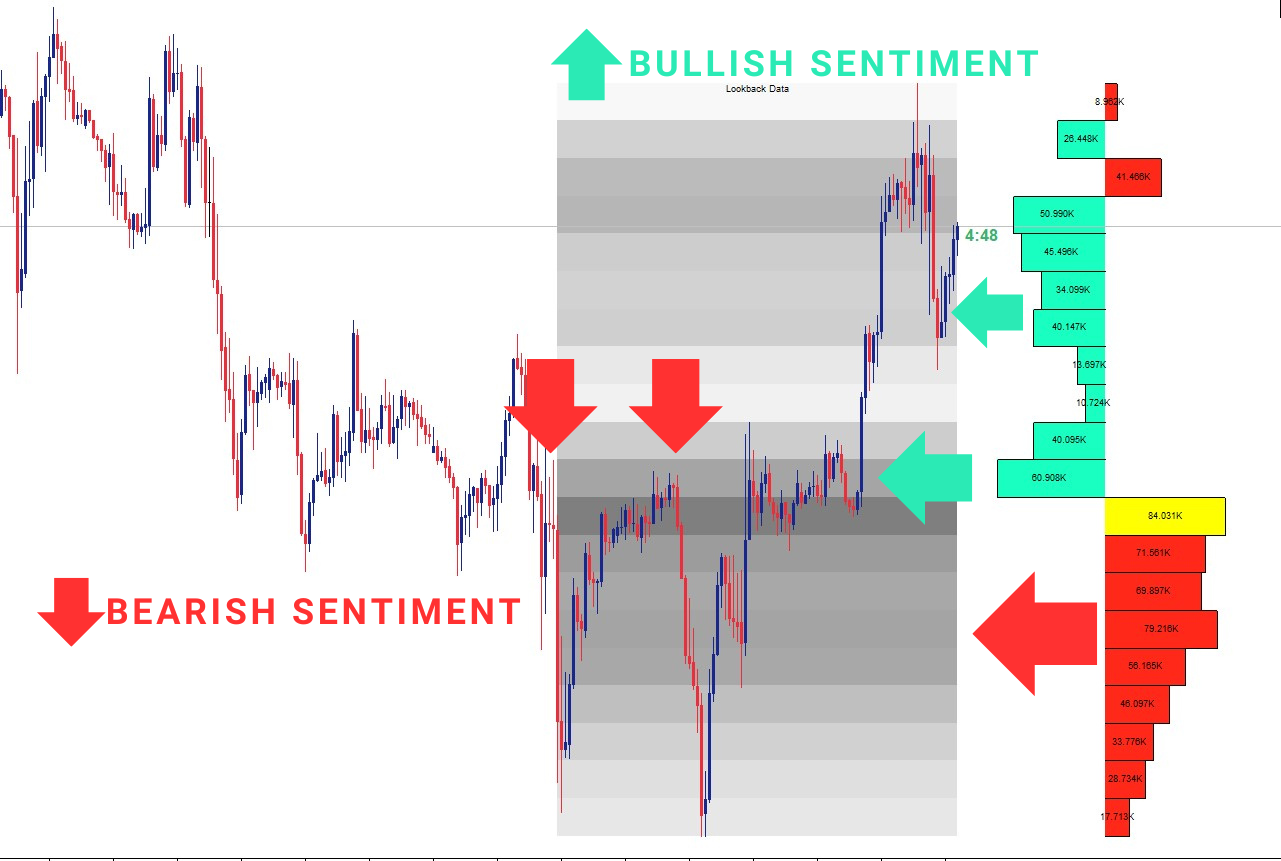
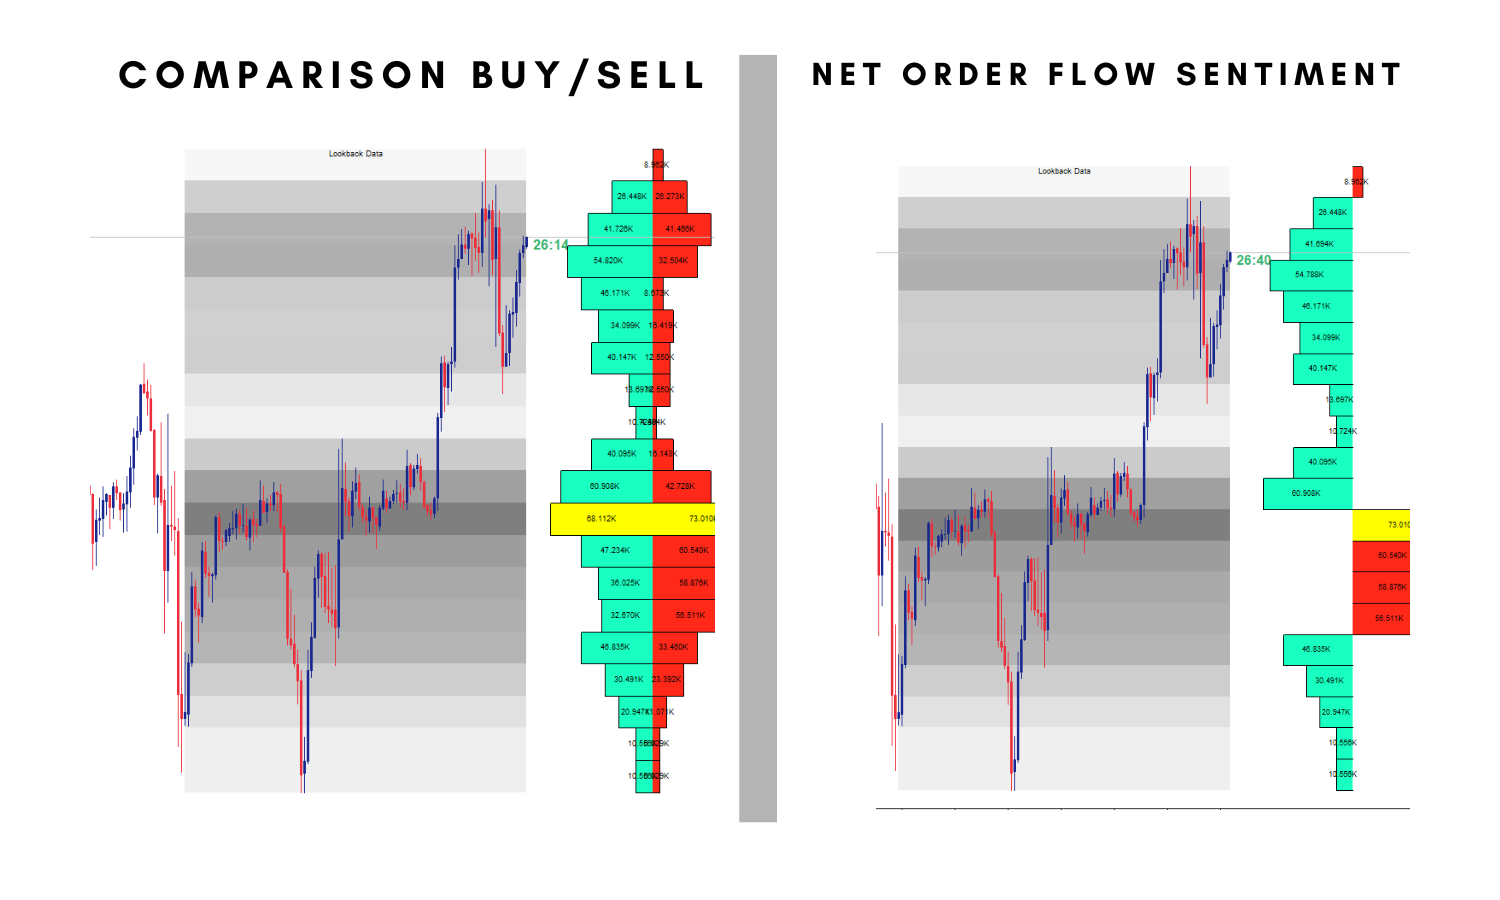
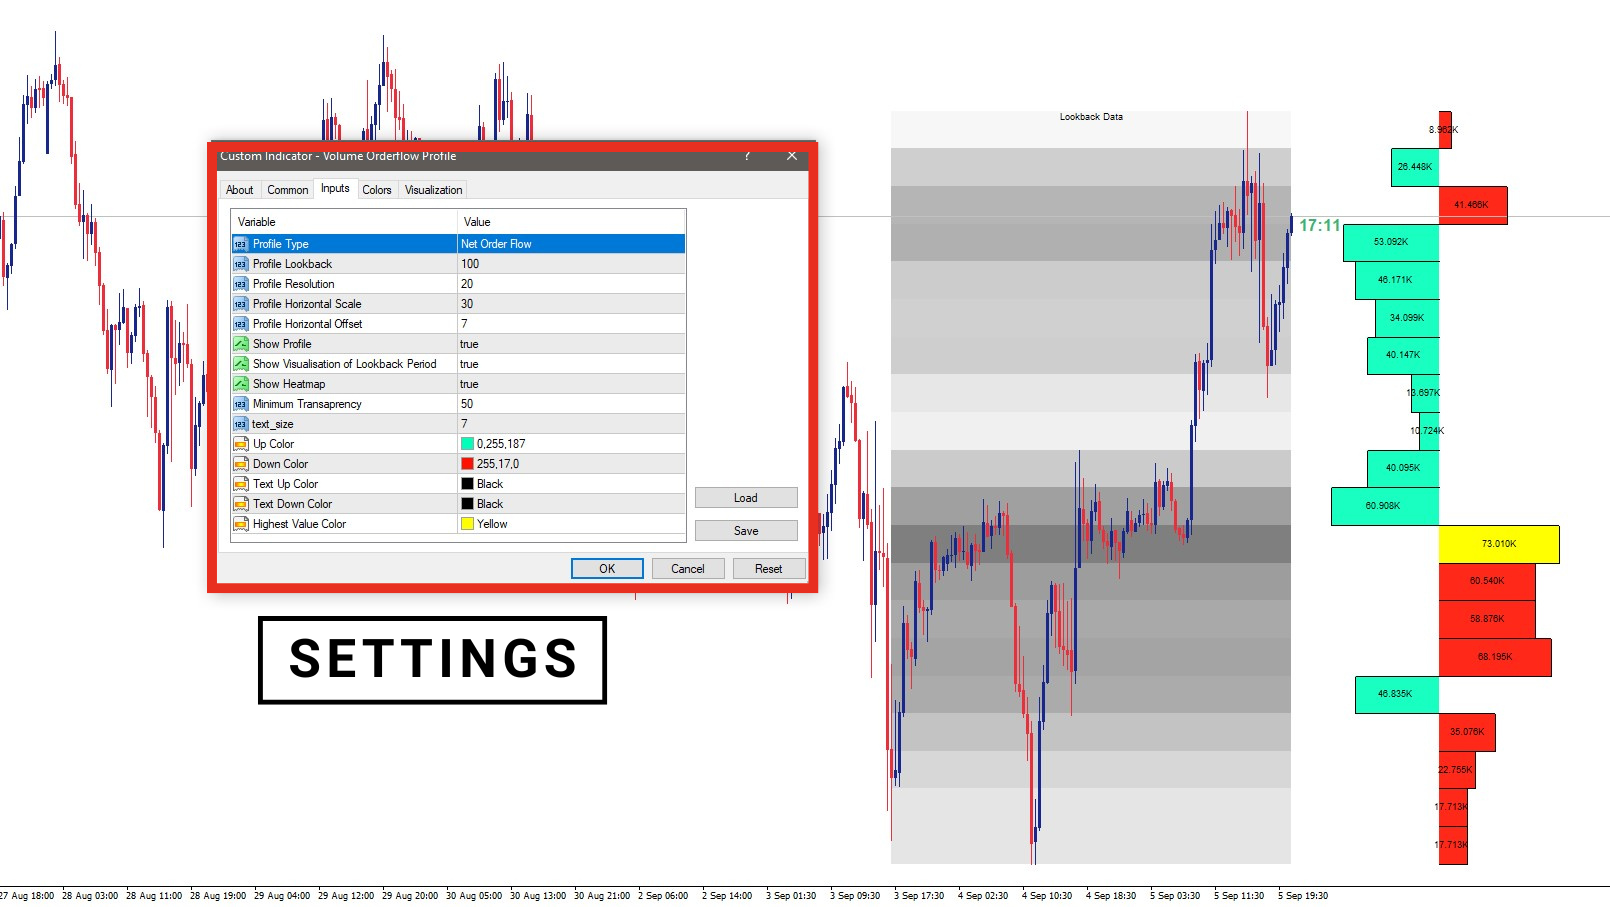
The indicator gathers data on high and low prices, along with buy and sell volumes, over a user-defined period. It calculates the maximum and minimum prices during this period and divides the range into bins based on your selected resolution. For each bin, the tool computes total buy and sell volumes. In "Comparison" mode, it displays side-by-side boxes for buy and sell volumes, while "Net Order Flow" mode highlights the net difference. The profiles are visually presented on the chart, with customizable colors, transparency, and an optional heatmap for enhanced insight into volume activity.
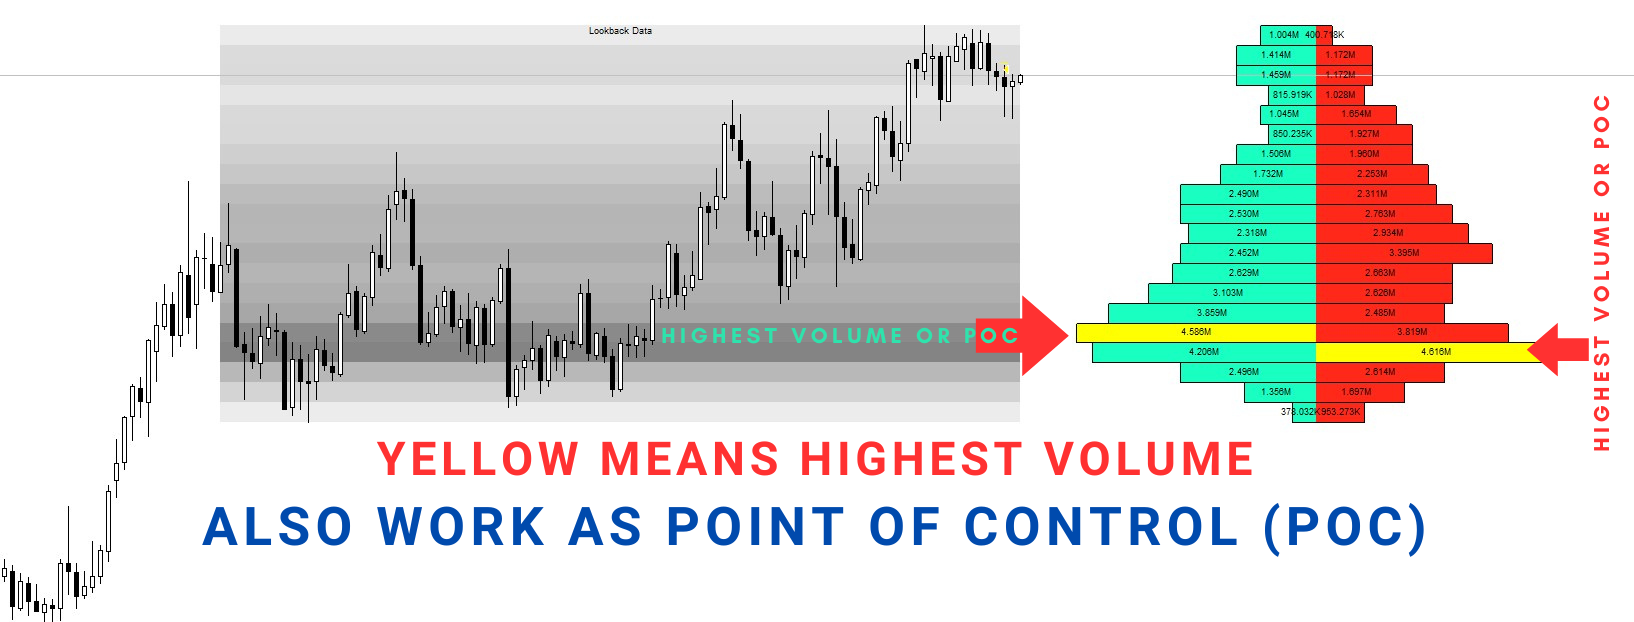
Use this tool to identify areas of strong buying or selling pressure. "Comparison" mode helps you spot significant volume differences, while "Net Order Flow" mode emphasizes net volume shifts. Additionally, the activity heatmap can reveal key levels that may act as support or resistance, indicating potential price reactions.
Key Features:
- Profile Mode Options: Choose between "Comparison" and "Net Order Flow" for a tailored view of market activity.
- Adjustable Lookback Period: Customize the lookback period to fit your trading strategy.
- Flexible Display Settings: Toggle visibility for profiles, lookback period visualization, and heatmaps.
- Color Customization: Select your preferred colors for buy and sell volumes.
- High-Activity Zones: Use the transparency settings to highlight significant trading activity.
A powerful tool to enhance your trading with deeper volume insights!
Feel free to contact me if you need any assistance.