• Genel bakış
  • İncelemeler
  • Yorumlar

Liquidity ICT Series

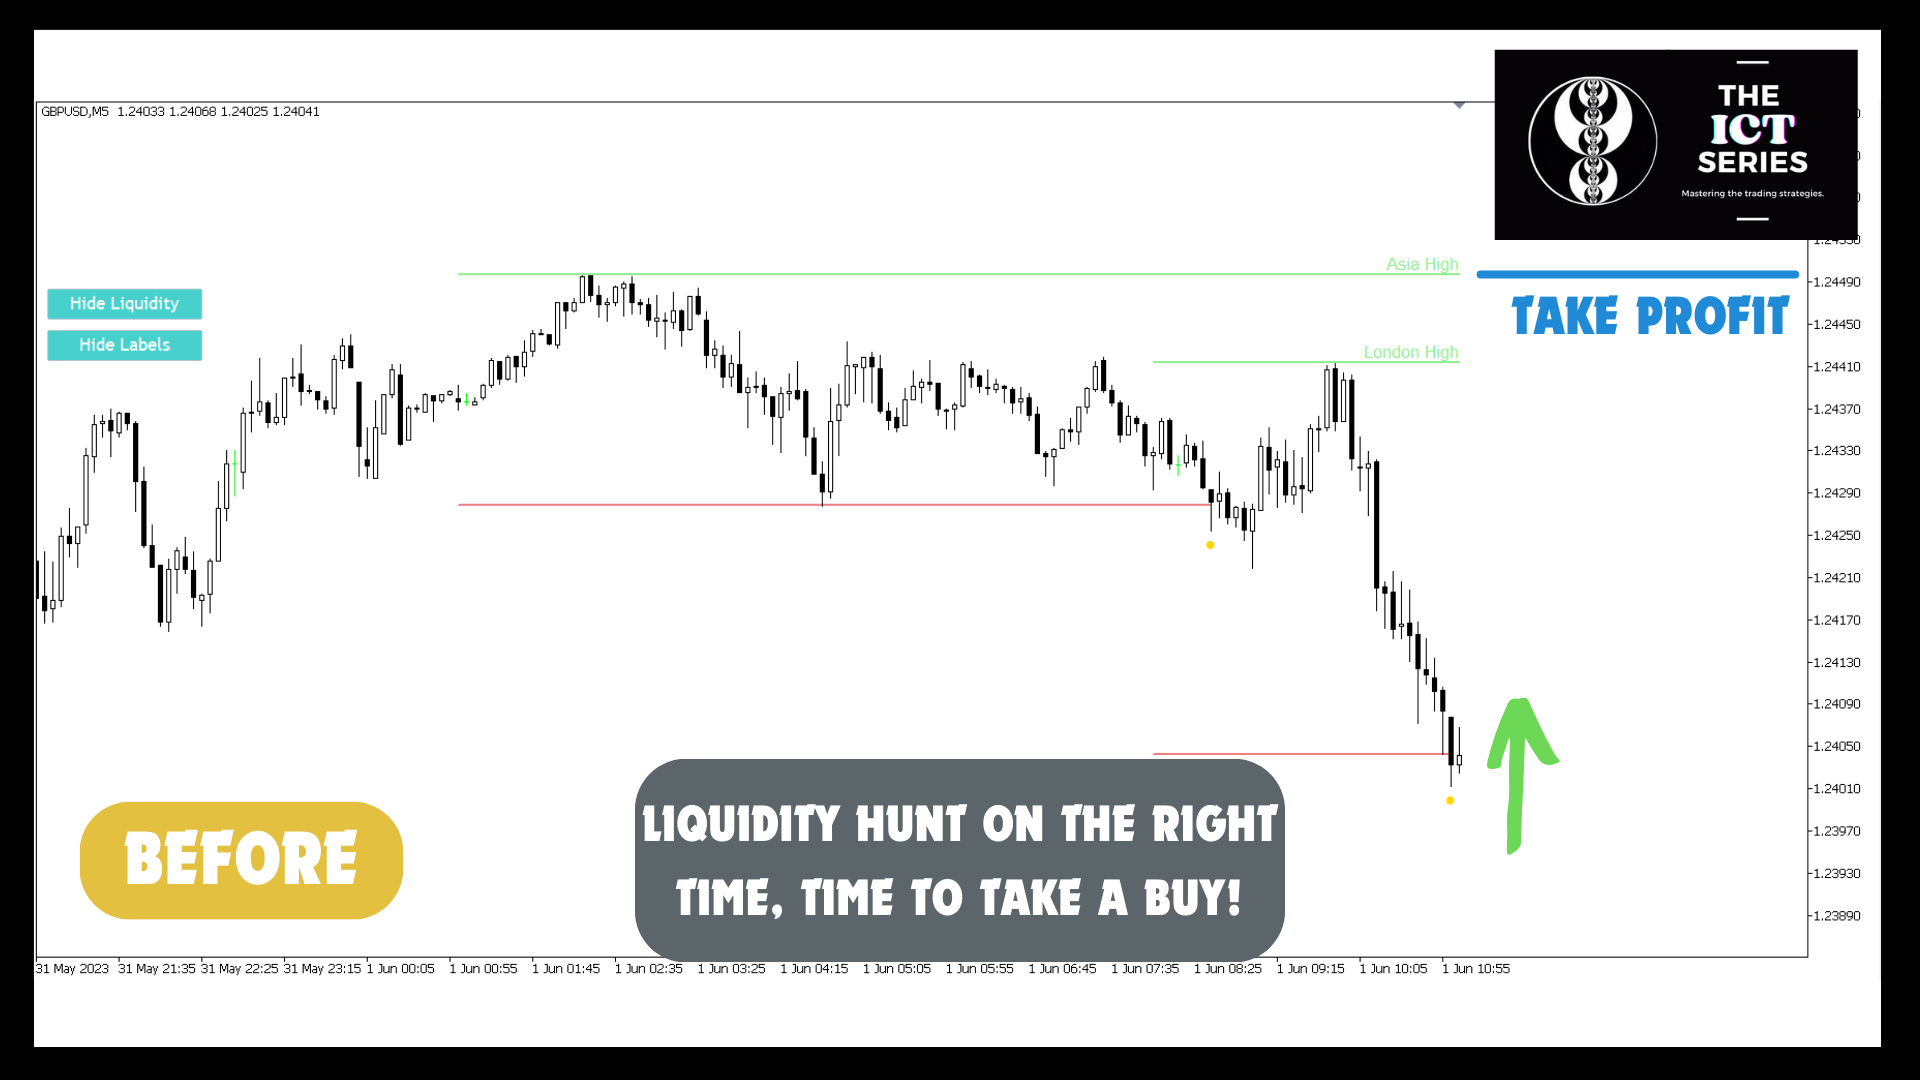
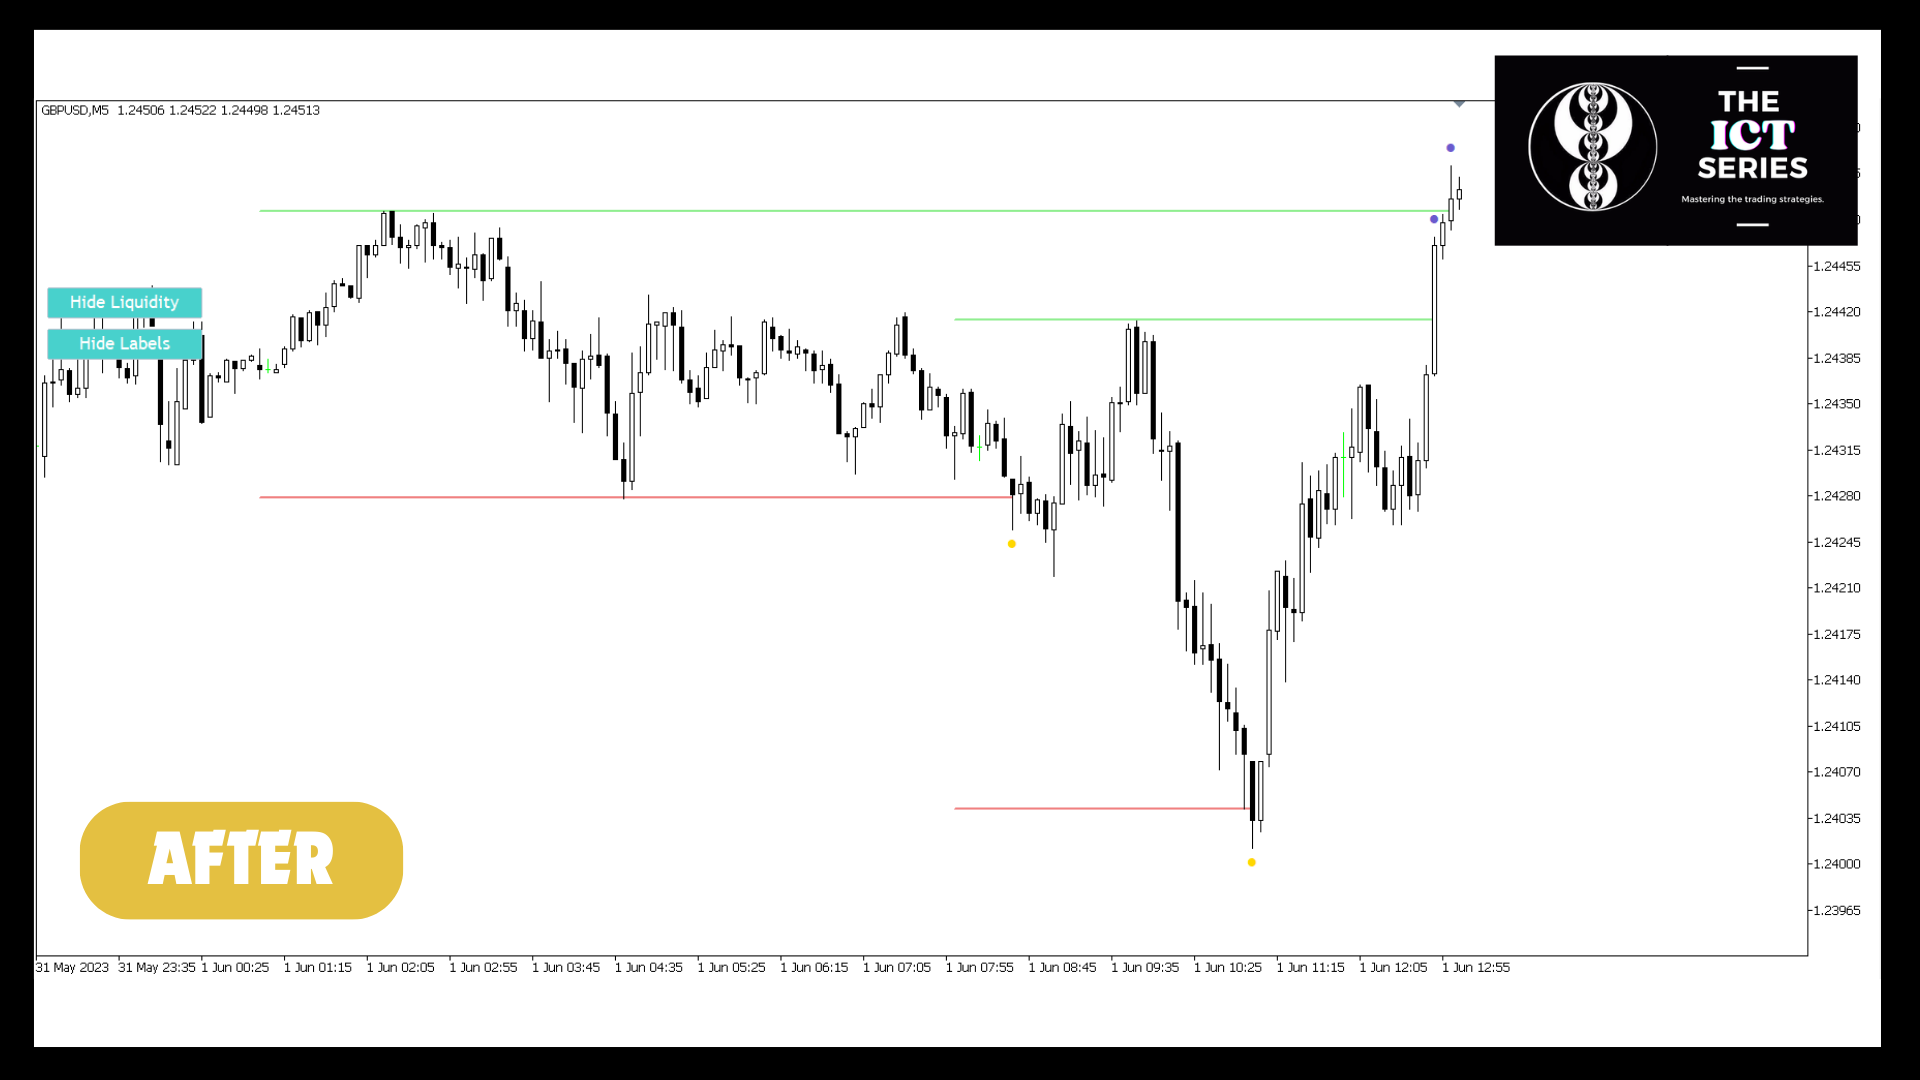
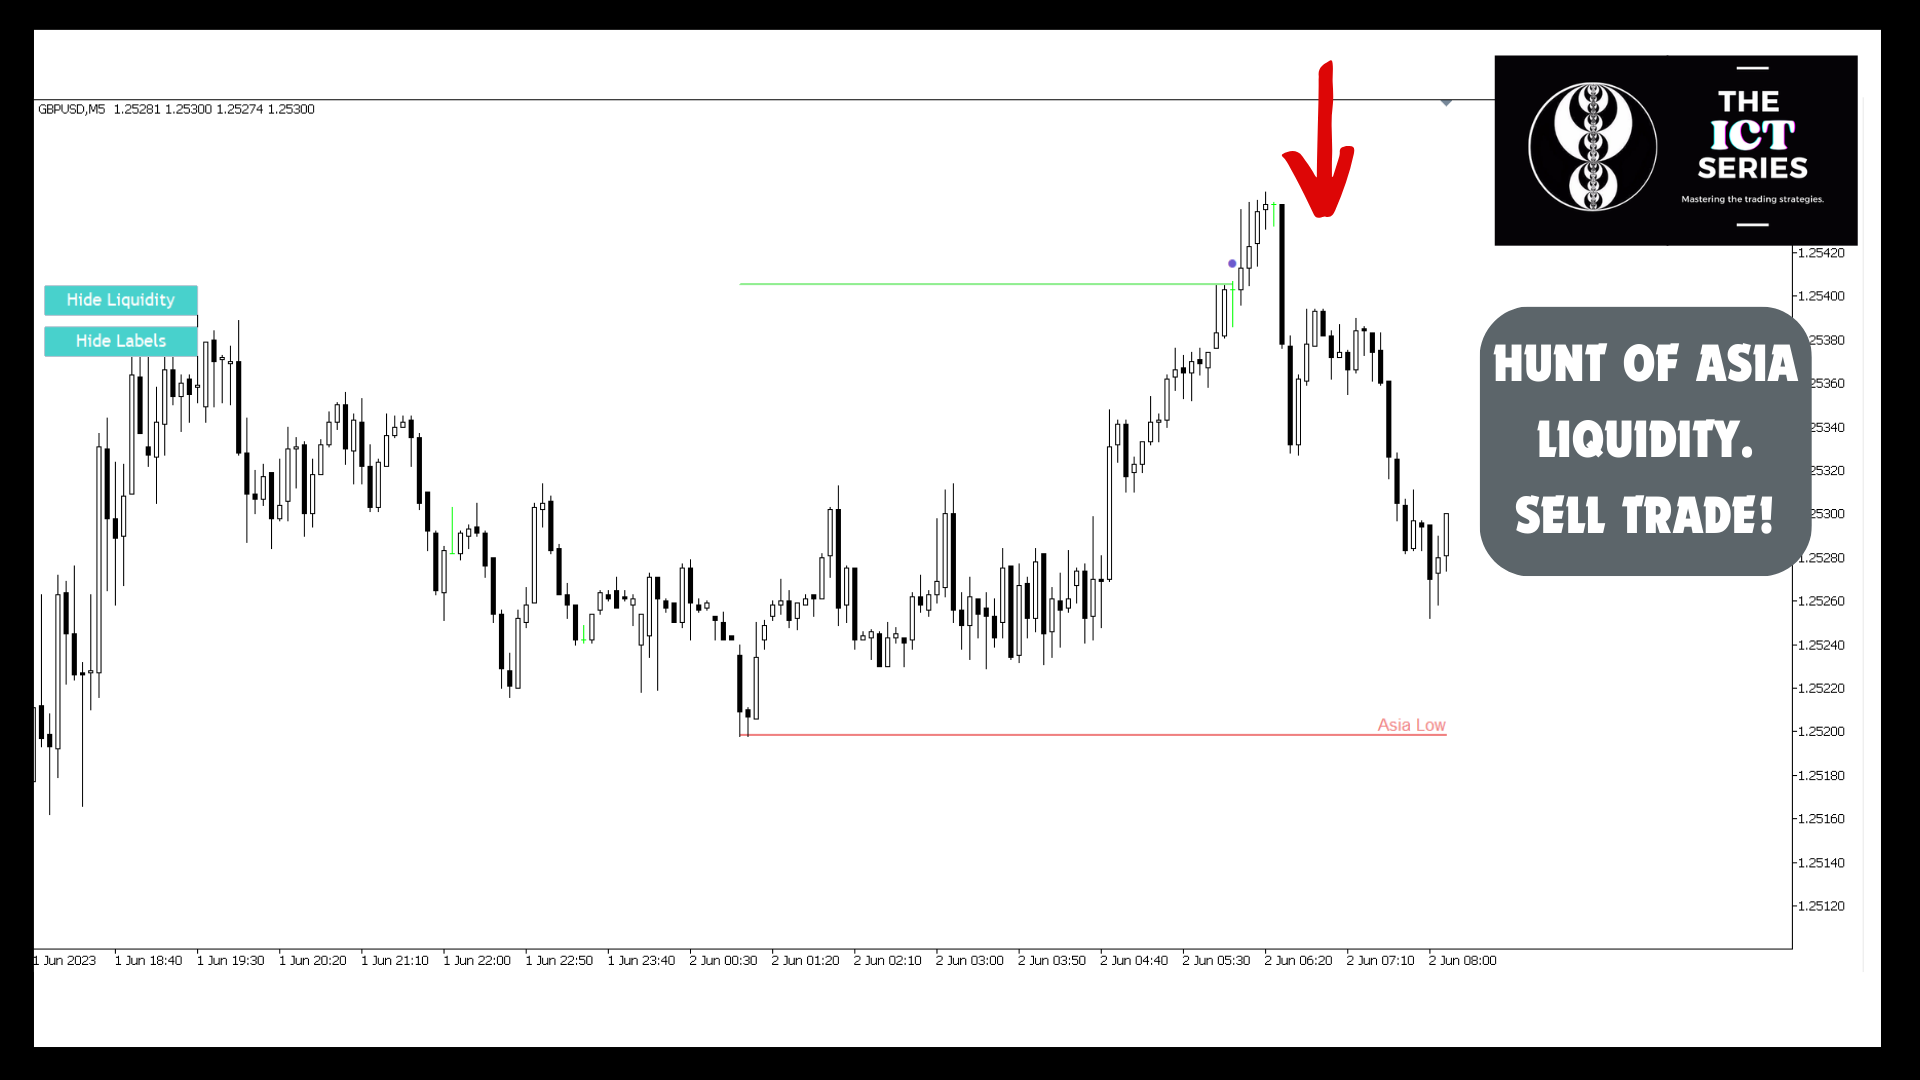
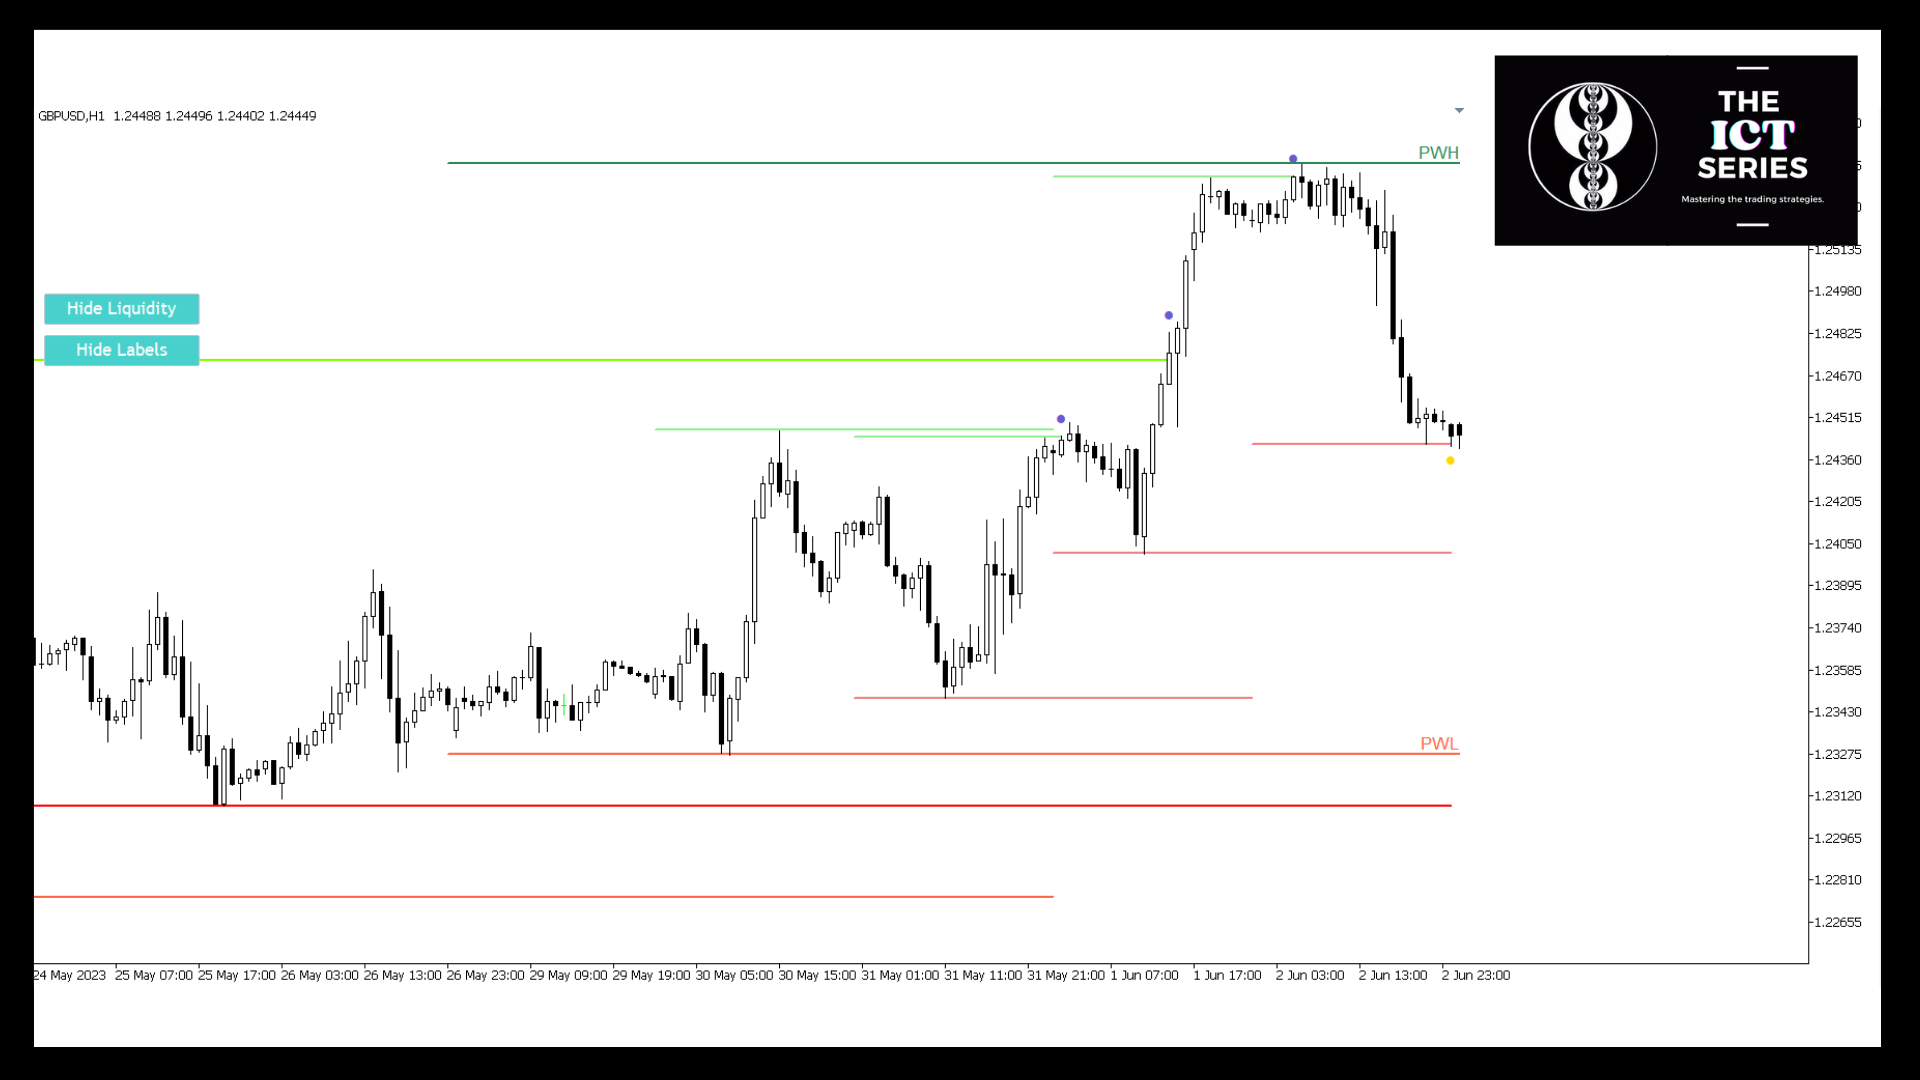
Liquidity ICT, giriş noktanızı bulmak için en iyi araçtır. Bir likidite havuzu dokunulduğunda uyarılar alarak, ideal işlem anını öğrenin. Uyarı ayrıca işlem yönünü belirtecek ve en yakın likidite havuzunda TP'yi ayarlayacaktır. Bu gösterge ile hangi yönde işlem yapacağınızı ve Hangi seviyelerde Take Profit ve Stop Loss belirlemeniz gerektiğini bileceksiniz. Kurumsal düzeyde piyasayı anlamanıza yardımcı olacak şekilde tasarlanmıştır. 


Likidite ICT ile neler yapabilirsiniz?

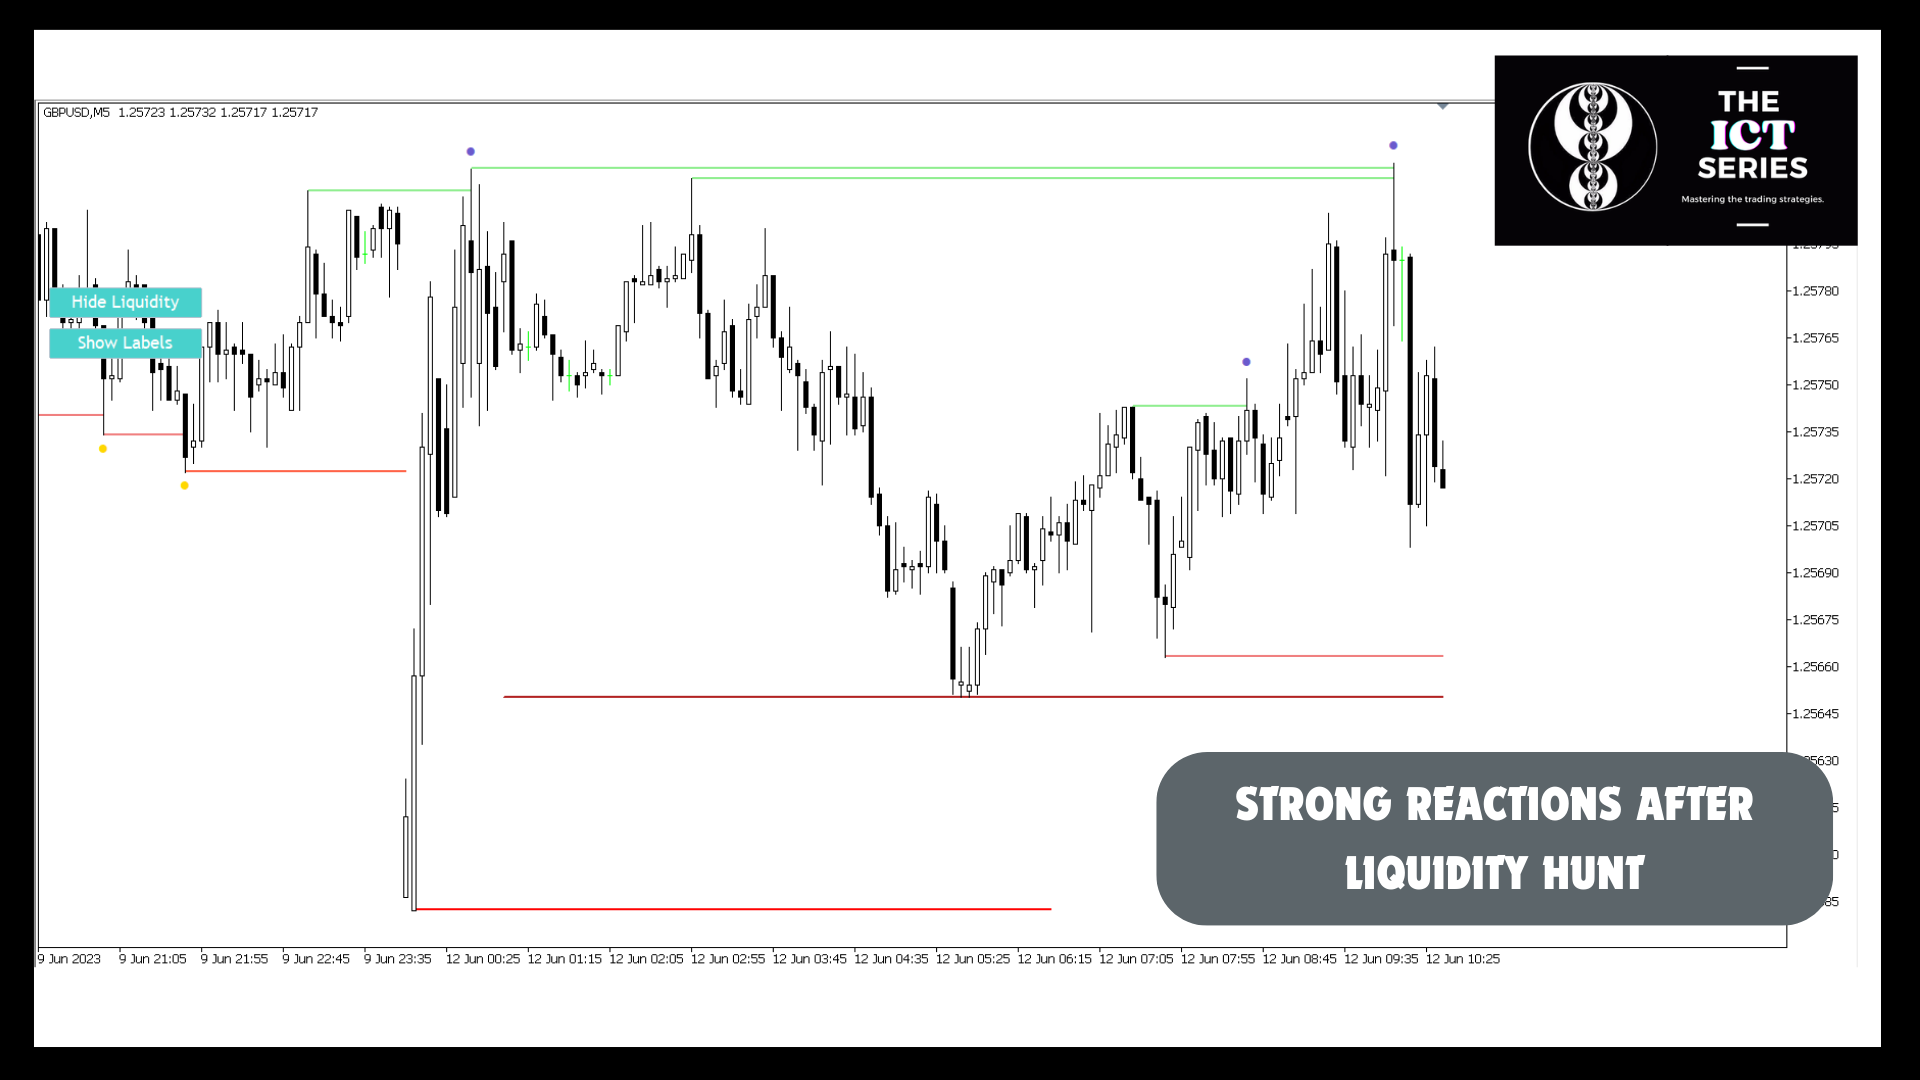
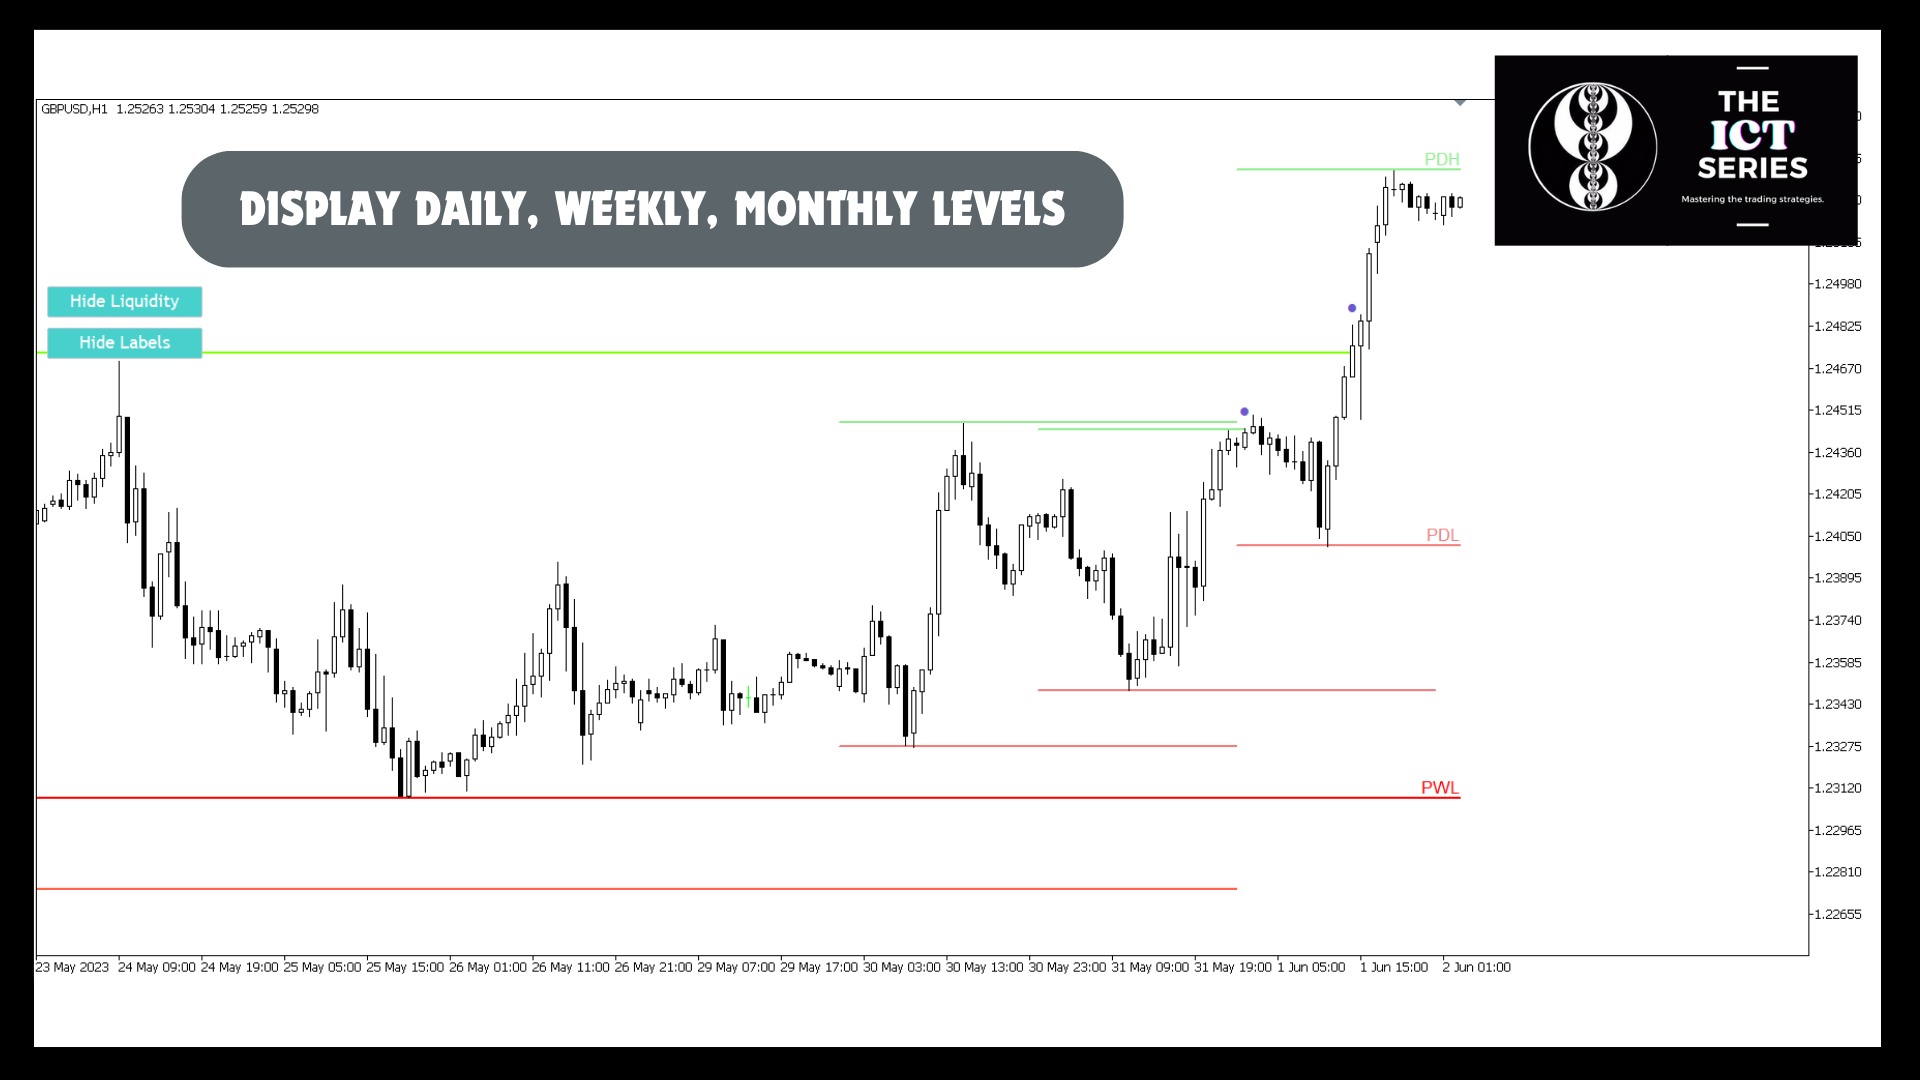
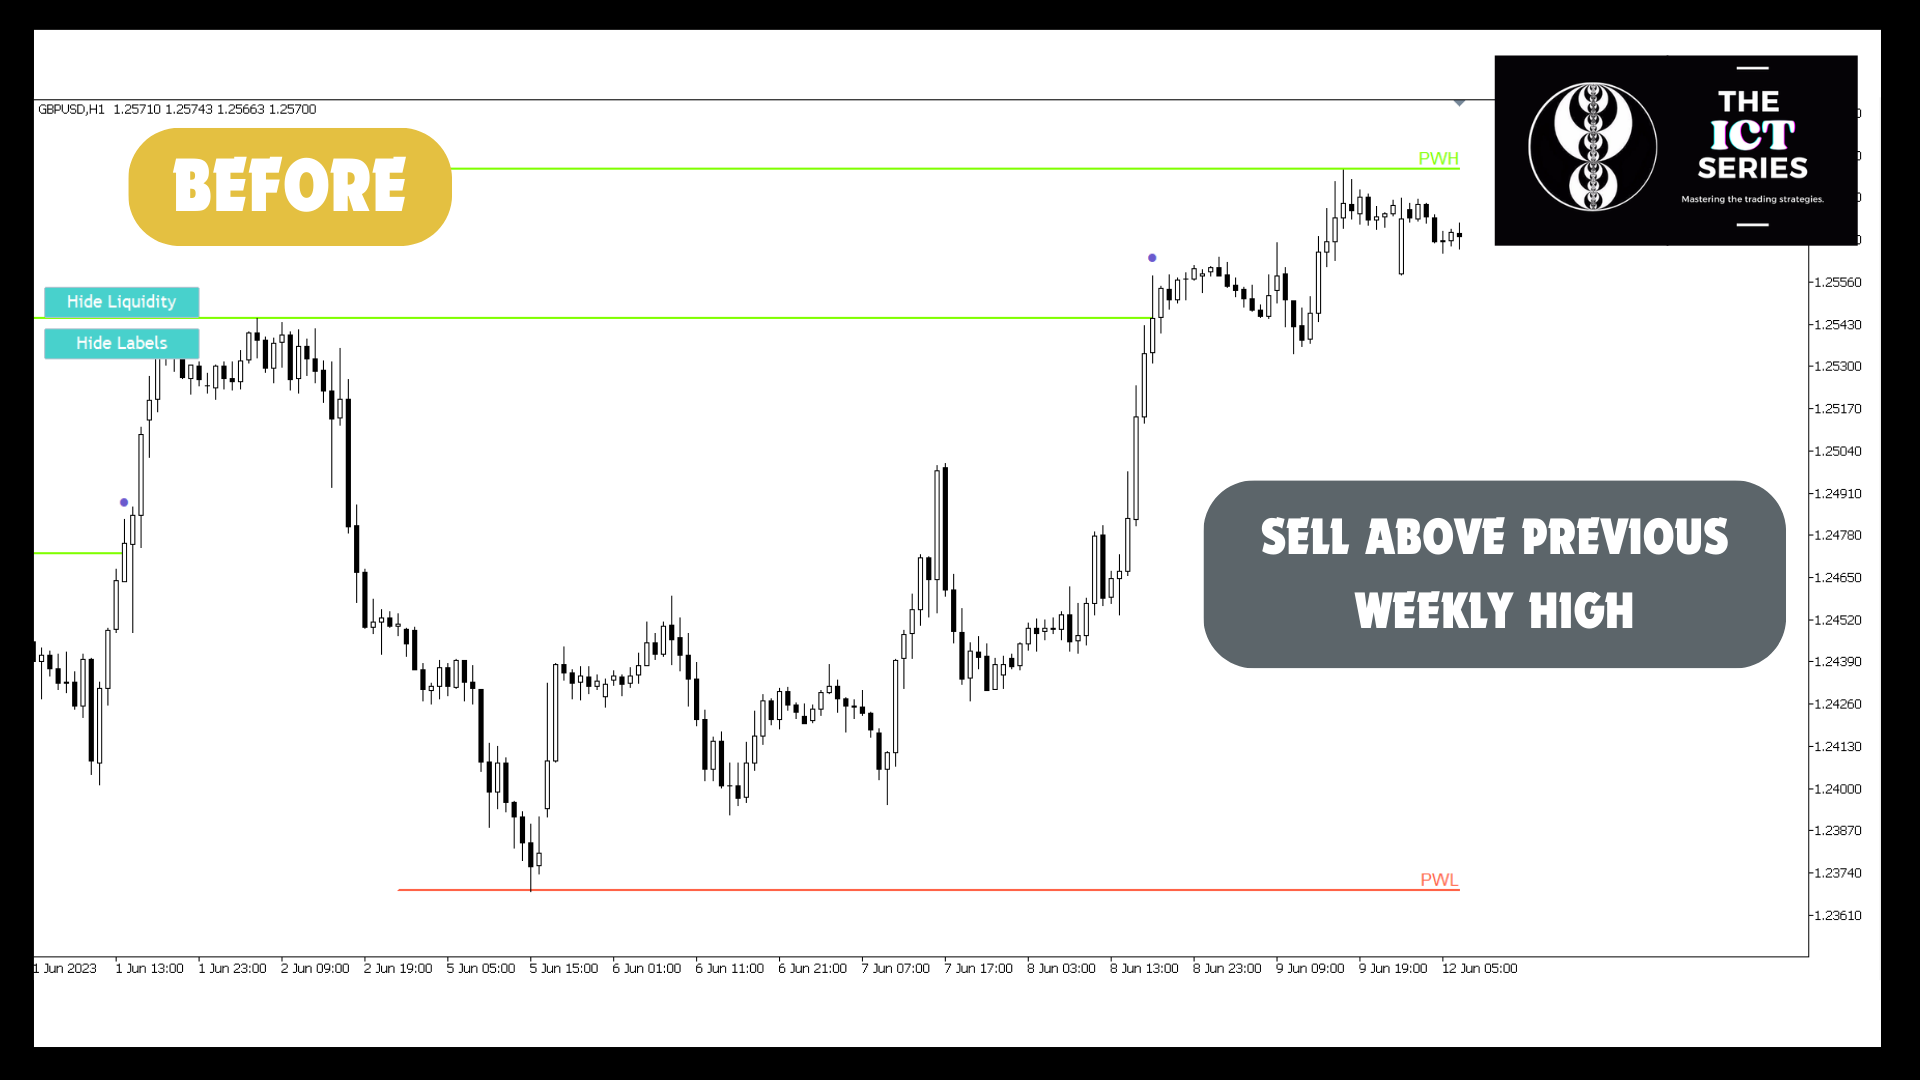
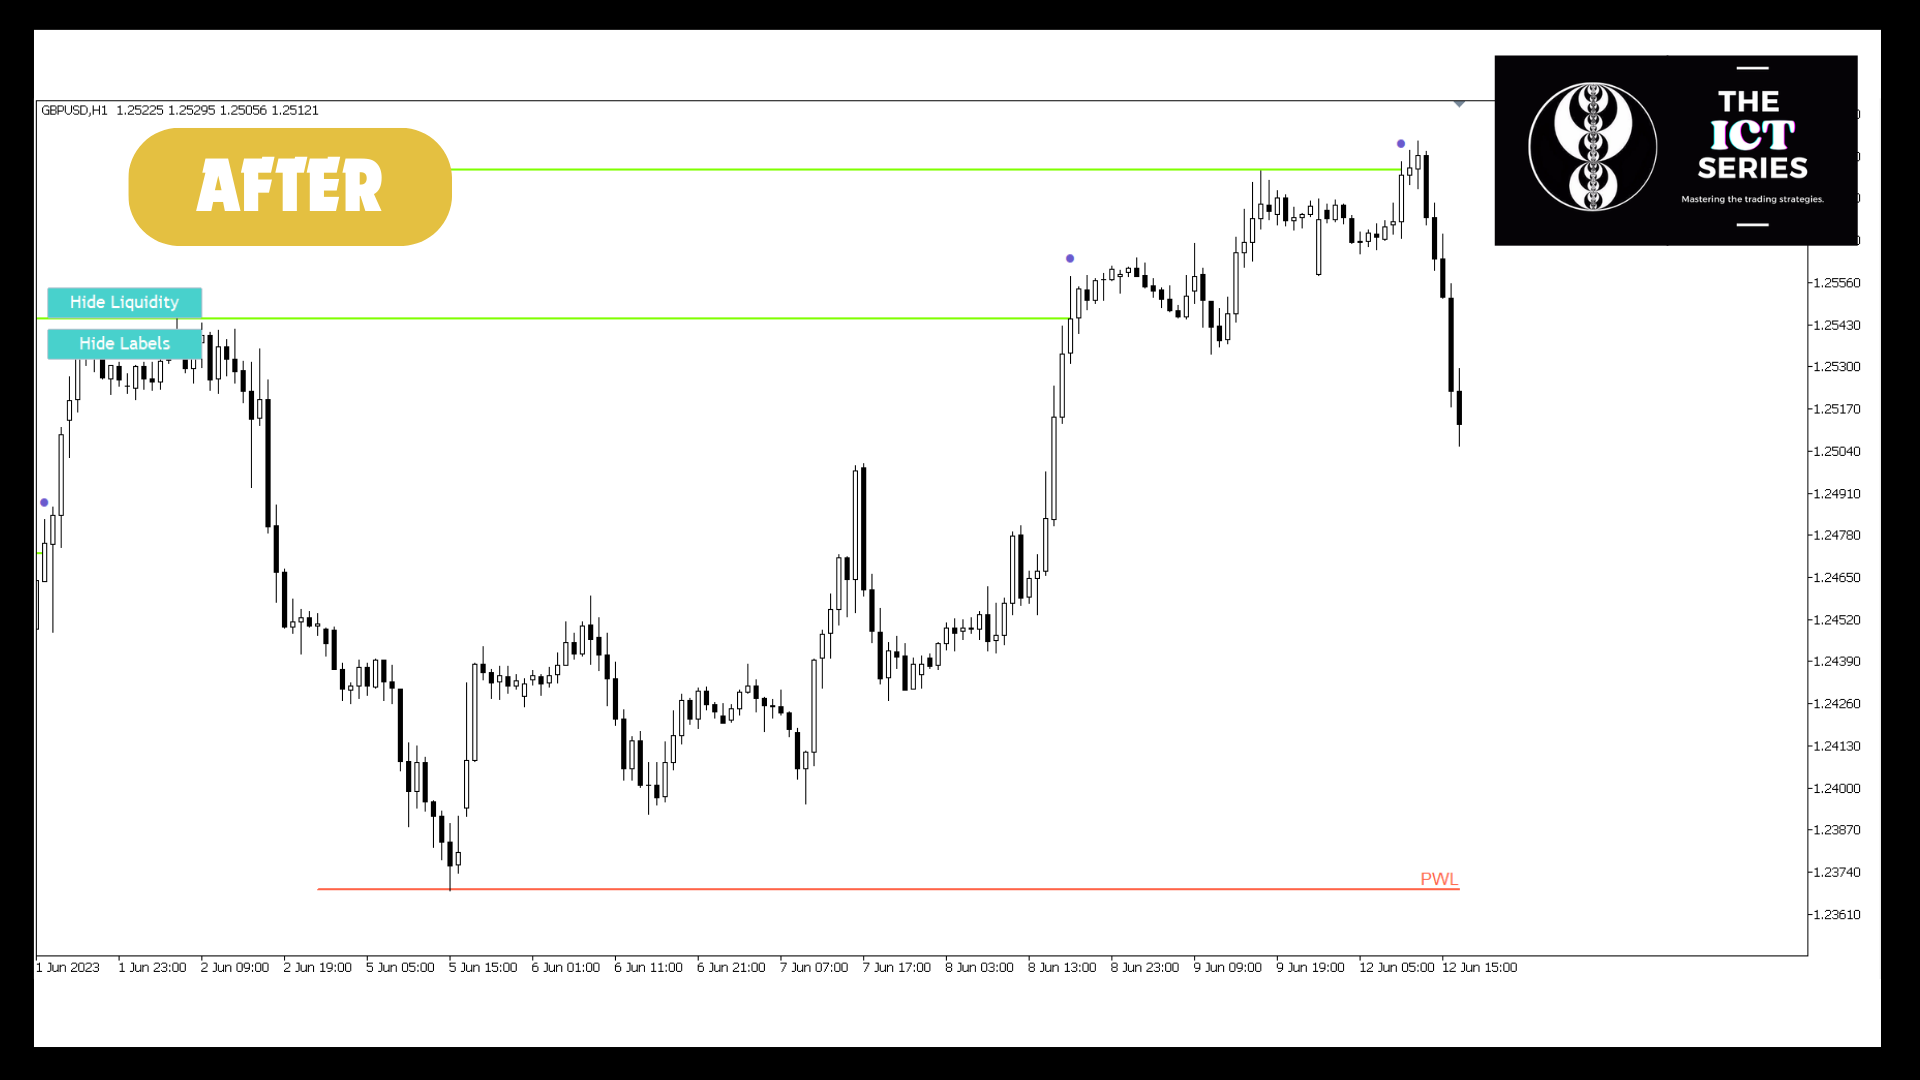
Bu aracın tanımanıza izin verdiği likidite havuzlarından bazıları, seansların en yüksek ve en düşük seviyelerinin yanı sıra önceki günler, haftalar ve aylar seviyeleri gibi zamana dayalı likiditedir. Ek olarak, tepki yaratabilecek en yakın likidite havuzlarının hangileri olduğunu tanıyan ve bunları açıkça tanımlanabilen ve daha güçlü veya daha zayıf bir tepki beklemenize yardımcı olan farklı önem seviyeleriyle kataloglayan gelişmiş bir algoritmaya sahiptir.Ek olarak, hangi seviyedeki önemi görmek istediğinizi filtrelemenize olanak tanıyan bir filtreye sahiptir, bu şekilde göstergeyi ticaret planınıza göre özelleştirmenize olanak tanıyan daha güçlü likidite havuzlarını veya daha zayıf olanları seçebilirsiniz. Bu gösterge ile, likidite avını beklemekten oluşan kaplumbağa çorbası gibi stratejileri takas edebilir, ardından fiyat ve momentumda ters yönde keskin bir dönüş yapabilirsiniz. 


Diğer özellikler 

  • Likidite avı uyarıları, böylece işlem yapmak için en iyi zamanlardan haberdar olursunuz.
  • Temiz bir grafik elde etmek için yalnızca en yakın likidite havuzlarını görüntüleyin. 
  • İşlem yapmak için en olası geri dönüş bölgelerinde noktalar çizin.


Likidite ICT  neden kullanmalı?

Bu araç, ticaretinizi yeni bir seviyeye taşımak için çok önemlidir. Likiditeye dayalı stratejiler, akıllı para ticareti ve Inner Circle Trader (ICT) ve diğer tüccarlar tarafından öğretilen diğer teoriler gibi en ilginç kavramlardan bazılarını takas etmenin yanı sıra.  Yukarıdaki makalede, göstergeyi stratejinizde nasıl kullanacağınıza ve mümkün olan en etkili şekilde nasıl ticaret yapacağınıza dair bir strateji bulacaksınız. Bu gösterge, piyasanın dinamiklerini anlamanıza, hangi fiyatlarda bir hareket olma olasılığının en yüksek olduğunu ve hangi alanların daha az değişken olacağını görmenize olanak tanır. Ayrıca, stop-loss veya take-profit emirlerini stratejik olarak yerleştirmek için seviyeleri belirlemenize yardımcı olacak ve stop avlarına yakalanma riskini azaltacaktır. Ek olarak, kayıpları en aza indirirken kâr potansiyelinizi en üst düzeye çıkararak optimum giriş ve çıkış noktalarını belirleyin.


Bu gösterge, burada bulabileceğiniz ICT SERİSİ koleksiyonunun bir parçasıdır. Daha iyi sonuçlar elde etmek için diğer ürünlerle eş zamanlı olarak kullanın ve ICT SERİSİ'nde görmek istediğiniz herhangi bir fikriniz, konseptiniz veya stratejiniz varsa, lütfen doğrudan mesaj veya yorum yoluyla bize gönderin, geliştirmekten ve sizinle test etmekten veya içgörü, strateji ve destek paylaşan tüccarlar topluluğumuza katılmaktan memnuniyet duyarız.Serinin ana odak noktası Inner Circle Trader kavramları (ICT), Akıllı para kavramları, kurumsal ticaret, Likidite kavramları, Kaplumbağa çorbaları, IPDA, Wyckoff'tur. Topluluğumuza katılın.

Önerilen ürünler
VR Grid Mt5
Vladimir Pastushak
3.43 (7)
VR Izgara göstergesi, kullanıcı tanımlı ayarlarla grafiksel bir ızgara oluşturmak için tasarlanmıştır . Standart ızgaradan farklı olarak, VR Izgarası dairesel seviyeler oluşturmak için kullanılır. Kullanıcının seçimine bağlı olarak tur seviyeleri arasındaki adım isteğe bağlı olabilir. Ek olarak, diğer göstergeler ve yardımcı programlardan farklı olarak VR Grid, zaman dilimi değiştiğinde veya terminal yeniden başlatıldığında bile ızgaranın konumunu korur . Ayarlar, set dosyaları, demo versiyonlar
FREE
Was: $249  Now: $99   Market Profile defines a number of day types that can help the trader to determine market behaviour. A key feature is the Value Area, representing the range of price action where 70% of trading took place. Understanding the Value Area can give traders valuable insight into market direction and establish the higher odds trade. It is an excellent addition to any system you may be using. Inspired by Jim Dalton’s book “Mind Over Markets”, this indicator is designed to suit the
RAD CRITICAL LEVES RAD indicator tracks “Relevant Volume” in real time, identifying accumulation and distribution processes, projecting them in the chart as SUPPORT or RESISTANCE zones. Natural   support   and resistance levels are generated by Volume Accumulation and Distribution processes. As these processes evolve, levels at which the relevant volume in the market place is positioned, become difficult areas to cross upwards or downwards. By using this information, traders can identify very s
BoxChart MT5
Evgeny Shevtsov
5 (7)
The market is unfair if only because 10% of participants manage 90% of funds. An ordinary trader has slim changes to stand against these "vultures". This problem can be solved. You just need to be among these 10%, learn to predict their intentions and move with them. Volume is the only preemptive factor that faultlessly works on any timeframe and symbol. First, the volume appears and is accumulated, and only then the price moves. The price moves from one volume to another. Areas of volume accumu
Adjustable Consecutive Fractals  looks for 2 or more fractals in one direction and sends out a on screen alert, sound alert and push notification, for strong reversal points . Adjustable Consecutive Fractals, shows the fractals on chart along with a color changing text for buy and sell signals when one or more fractals appear on one side of price. Adjustable Consecutive Fractals is based Bill Williams Fractals . The standard Bill Williams fractals are set at a non adjustable 5 bars, BUT withe
Order Book, known also as Market Book, market depth, Level 2, - is a dynamically updated table with current volumes of orders to buy and to sell specific financial instument at price levels near Bid and Ask. MetaTrader 5 provides the means for receiving market book from your broker, but in real time only, without access to its history. The indicator OrderBook Cumulative Indicator accumulates market book data online and visualizes them on the chart. In addition, the indicator can show the market
True Weis Wave
Atila Goncalves Firmino
A version based on David Waves' description in his book 'Trade About to Happen' of his adaptation of the Wyckoff wave chart. The indicator directionally accumulates volume, adding to each brick or candle close, with color indication for up and down. it can be used it with tick or real volume, it also changes color when the accumulated value of the previous wave is exceeded, being the trade signal. Yellow color is used for doji candlestick, it will continue with accumulation without zero the sum
PULLBACK HUNTER What is every trader's cherished dream? To see without delay the places where the reversal will happen. This, of course, is from the category of magic, though... nothing is impossible. But for now I've prepared for you an indicator that marks in real time the end of corrections to the current movement or in short - catches pullbacks.What is the main point? Many people practice rebounds when the price moves in the direction of the open position. And they do them on the formation o
Unlock powerful breakout opportunities The 123 Pattern is one of the most popular, powerful and flexible chart patterns. The pattern is made up of three price points: a bottom, a peak or valley, and a Fibonacci retracement between 38.2% and 71.8%. A pattern is considered valid when the price breaks beyond the last peak or valley, moment at which the indicator plots an arrow, rises an alert, and the trade can be placed. [ Installation Guide | Update Guide | Troubleshooting | FAQ | All Products ]
Smart Delta Volume
Thalles Nascimento De Carvalho
Smart Delta Volume: Dinamik Pazar Koşullarına Uyarlanabilir ve Hassas Araç Smart Delta Volume , sürekli değişen bir piyasa ortamında hassas ve uyarlanabilir analizler sunmak için tasarlanmış gelişmiş bir teknik göstergedir. Bu gösterge, volatiliteye göre otomatik olarak ayarlanan dinamik seviyeleri kullanarak, hacim akışı ile fiyat hareketleri arasındaki etkileşim hakkında daha kapsamlı ve güvenilir bir görüş sağlar. Bu uyarlanabilirlik, özellikle değişken piyasalarda hızlı ve doğru bilgiler
AW Candle Patterns
AW Trading Software Limited
AW Mum Kalıpları göstergesi, güçlü bir mum kalıbı tarayıcı ile birleştirilmiş gelişmiş bir trend göstergesinin birleşimidir. En güvenilir otuz mum kalıbını tanımak ve vurgulamak için kullanışlı bir araçtır. Ek olarak, renkli çubuklara dayalı güncel bir trend analizörüdür.       yeniden boyutlandırılabilen ve konumlandırılabilen eklenti çoklu zaman çerçevesi trend paneli. Trend filtrelemeye bağlı olarak kalıpların görünümünü ayarlamak için benzersiz bir yetenek. Avantajlar: Mum desenlerini kolayc
Market Profile Heat indicator  — is a classic Market Profile implementation that can show the price density over time, outlining the most important price levels, value area, and control value of a given trading session. This indicator can be attached to timeframes between M1 and D1 and will show the Market Profile for daily, weekly, monthly, or even intraday sessions. Lower timeframes offer higher precision. Higher timeframes are recommended for better visibility. It is also possible to use a f
Blahtech Supply Demand MT5
Blahtech Limited
4.54 (13)
Was: $299  Now: $99   Supply Demand uses previous price action to identify potential imbalances between buyers and sellers. The key is to identify the better odds zones, not just the untouched ones. Blahtech Supply Demand indicator delivers functionality previously unavailable on any trading platform. This 4-in-1 indicator not only highlights the higher probability zones using a multi-criteria strength engine, but also combines it with multi-timeframe trend analysis, previously confirmed swings
Gösterge, tarihsel olanlarla karşılaştırılabilecek güncel teklifler oluşturur ve bu temelde bir fiyat hareketi tahmini yapar. Gösterge, istenen tarihe hızlı navigasyon için bir metin alanına sahiptir. Seçenekler: Sembol - göstergenin göstereceği sembolün seçimi; SymbolPeriod - göstergenin veri alacağı dönemin seçimi; GöstergeRenk - gösterge rengi; Ters - doğru tırnakları tersine çevirir, yanlış - orijinal görünüm; Sonraki, tarihi girebileceğiniz ve 'enter' tuşuna basa
This indicator can be considered as a trading system. It offers a different view to see the currency pair: full timeless indicator, can be used for manual trading or for automatized trading with some expert advisor. When the price reaches a threshold a new block is created according to the set mode. The indicator beside the Renko bars, shows also 3 moving averages. Features renko mode median renko custom median renko 3 moving averages wicks datetime indicator for each block custom notificatio
Gioteen Volatility Index (GVI) - your ultimate solution to overcoming market unpredictability and maximizing trading opportunities. This revolutionary indicator helps you in lowering your losing trades due to choppy market movements. The GVI is designed to measure market volatility, providing you with valuable insights to identify the most favorable trading prospects. Its intuitive interface consists of a dynamic red line representing the volatility index, accompanied by blue line that indicate
Delta Aggression Volume PRO is an indicator developed to monitor the strength and continuity of the aggression volume of sell and buy negotiations. Note: This indicator DOES NOT WORK for Brokers and/or Markets WITHOUT the type of aggression (BUY or SELL). Cryptocurrencies and Forex do not provide this type of data, that is, it does not work with them. O Delta Agrression Volume PRO has features that allow you to view beyond the delta volume of the day. Operation Multi symbols  (those who pro
Your Pointer is no ordinary Forex channel. This corridor is built on the basis of the analysis of several candles, starting from the last one, as a result of which the extremes of the studied interval are determined. They are the ones who create the channel lines. Like all channels, it has a middle line as well as a high and low line. This channel is worth watching for its unusual behavior. The use of the Your Pointer indicator allows the trader to react in time to the price going beyond the bo
"Pattern 123" is an indicator-a trading system built on a popular pattern, pattern 123. This is the moment when we expect a reversal on the older trend and enter the continuation of the small trend, its 3rd impulse. The indicator displays signals and markings on an open chart. You can enable/disable graphical constructions in the settings. The indicator has a built-in notification system   (email, mobile terminal, standard terminal alert). "Pattern 123" has a table that displays signals fr
"Hunttern harmonic pattern finder" base on the dynamic zigzag with the notification and prediction mode This version of the indicator identifies 11 harmonic patterns and predicts them in real-time before they are completely formed. It offers the ability to calculate the error rate of Zigzag patterns depending on a risk threshold. It moreover sends out a notification once the pattern is complete. The supported patterns: ABCD BAT ALT BAT BUTTERFLY GARTLEY CRAB DEEP CRAB CYPHER SHARK THREE
This product is designed for the MT5 platform and offers two key features: VWAP (Volume Weighted Average Price) calculation and Volume Profile analysis. Advantages: VWAP Calculation: The product calculates the VWAP, which is a popular indicator used by traders to determine the average price of a security based on its trading volume. It helps identify potential buying or selling opportunities by comparing the current price to the average price weighted by volume. Volume Profile Analysis: The prod
The Market Structures Pro indicator finds and displays 5 (five) patterns of the Smart Money Concepts (SMC) system on the chart, namely: Break Of Structures (BoS)       Change of character (CHoCH) Equal Highs & Lows Premium, Equilibrium and Discount zones with Fibo grid High-high, Low-low, High-low and Low-high extremes Patterns are displayed for two modes - Swing and Internal and are easily distinguished by color on the chart. Internal mode features higher contrast colors, finer lines, and sm
Crash 1000 Scalping Indicator for the Crash 1000 Deriv Synthetic Index. Introduction The Crash 1000 Scalping Indicator is a specialized tool designed for the Crash 1000 index on the Deriv Synthetic market. This indicator is particularly useful for scalping on the M1 timeframe, helping traders to identify precise entry and exit points for buy positions. It is designed to be non-repainting, providing clear signals with audible alerts and push notifications, and is compatible with mobile devices th
Price action is among the most popular trading concepts. A trader who knows how to use price action the right way can often improve his performance and his way of looking at charts significantly. However, there are still a lot of misunderstandings and half-truths circulating that confuse traders and set them up for failure. Using PA Trend Reversal will be possible to identify high probability exhaustion moves of a trend. Features The indicator gives alerts in real-time when the conditions are me
This indicator allows you to enjoy the two most popular products for analyzing request volumes and market deals at a favorable price: Actual Depth of Market Chart Actual Tick Footprint Volume Chart This product combines the power of both indicators and is provided as a single file. The functionality of Actual COMBO Depth of Market AND Tick Volume Chart is fully identical to the original indicators. You will enjoy the power of these two products combined into the single super-indicator! Below is
WAPV Box Effort x Result
Eduardo Da Costa Custodio Santos
MT5 için WA_PV_BOX_EFFORT X SONUÇ WAPV Box Effort x Result Indicator, Paket Göstergeleri grubunun (Wyckoff Academy Wave Market) bir parçasıdır. MT5 için WAPV Box Effort x Result Indicator , fiyat ve hacmi okumanıza yardımcı olur. Okuması, çaba x sonucunun tanımlanmasına yardımcı olmaktan ibarettir. grafik tarafından oluşturulan dalgalarda. Kutu yeşil olduğunda MT5 için WAPV Kutusu Eforu x Sonuç Göstergesi, hacmin talebin lehine olduğu ve kutunun kırmızı olduğu anlamına gelir hacim arzdan yana. K
This z-score indicator shows the correct z-score of an asset, as it uses the normalized price data for calculation, which is the only correct way. Z-score is only applicable for normal distributed data, therefore not the actual price is considered, but the normalised returns, which were assumed to follow a normal distribution. Returns are mean reverting and assumed to follow a normal distribution, therefore z-score calculation of returns is more reliable than z-score on price, as price is NOT m
Thunder Scalper
Mr Fares Mohammad Alabdali
Alış ve Satış Hedefleri Göstergesi       Üç satırdan oluşur: ilk yeşil renk satın alma hedeflerini, ikinci kırmızı renk satış hedeflerini ve üçüncü mavi renk ortalama fiyatı belirtir.       Girmenin iki yolu vardır -       Yöntem 1: Ortalama fiyatın alttan uzun bir mumla kırıldığı ve yeşil bir mumla mavi çizginin üzerinde kaldığında giriş noktası satın alma olarak kabul edilir.       Ortalama fiyat kırmızı bir mumla tepeyi aştığında, satış olarak kabul edilir.       İkinci yöntem: Hedeflere ul
Increase trade accuracy with the time-tested cup and handle patterns The Cup and Handle pattern is a technical price formation that resembles a cup and handle, where the cup is in the shape of a "U" and the handle has a slight downward drift. The right-hand side of the pattern -the handle- is smaller than the left-hand side -cup-, and retraces no more than 50% from the top. It can be both a continuation and a reversal pattern.  [ Installation Guide | Update Guide | Troubleshooting | FAQ | All P
Before installing the HeatMap indicator make sure you are using a broker that gives you access to the Depth of market (DOM) !! This indicator creates a heatmap on your chart allowing you to see the buy or sell limit orders easily and in real time. You have the possibility to change the setting and the colors of the HeatMap in order to adapt to all markets and all charts. Here is an example of a setting you can use with the NASDAQ100 on the AMPGlobal broker :  https://www.youtube.com/watch?v=x0
Bu ürünün alıcıları ayrıca şunları da satın alıyor
TPSpro RFI Levels MT5
Roman Podpora
4.73 (11)
TALİMATLAR         RUS   -        ENG       Bir gösterge ile kullanılması   önerilir       -       TPSpro   TREND PRO -   Sürüm MT4         Ticarette önemli bir unsur, bir ticaret aracını satın alma veya satma kararlarının alındığı bölgeler veya seviyelerdir. Büyük oyuncuların piyasadaki varlıklarını gizleme girişimlerine rağmen, kaçınılmaz olarak izler bırakırlar. Bizim görevimiz bu izleri nasıl tanımlayacağımızı ve doğru şekilde nasıl yorumlayacağımızı öğrenmekti. Ana işlevler:: Satıcılar ve
TPSproTREND PrO MT5
Roman Podpora
4.89 (9)
TPSpro TREND PRO  - is a trend indicator that automatically analyzes the market and provides information about the trend and each of its changes, as well as giving signals for entering trades without redrawing! The indicator uses each candle, analyzing them separately. referring to different impulses - up or down impulse. Exact entry points into transactions for currencies, crypto, metals, stocks, indices!  Version MT4               DETAILED DESCRIPTION               R ecommended to use with an
Öncelikle, bu Ticaret Sistemi'nin Non-Repainting, Non-Redrawing ve Non-Lagging Göstergesi olduğunu vurgulamak önemlidir, bu da hem manuel hem de robot ticareti için ideal hale getirir. Online kurs, kılavuz ve ön ayarları indir. "Smart Trend Trading System MT5", yeni ve deneyimli tüccarlar için özelleştirilmiş kapsamlı bir ticaret çözümüdür. 10'dan fazla premium göstergeyi birleştiriyor ve 7'den fazla sağlam ticaret stratejisi sunuyor, bu da çeşitli piyasa koşulları için esnek bir seçim yapar. Tr
Atomic Analyst MT5
Issam Kassas
4.42 (19)
Öncelikle belirtmek gerekir ki bu Ticaret Göstergesi Yeniden Çizim Yapmaz, Gecikmez ve Gecikme Göstermez, bu da hem manuel hem de robot ticareti için ideal hale getirir. Kullanıcı kılavuzu: ayarlar, girişler ve strateji. Atom Analisti, Piyasada Daha İyi Bir Avantaj Bulmak İçin Fiyatın Gücünü ve Momentumunu Kullanan PA Fiyat Hareketi Göstergesidir. Gürültüleri ve Yanlış Sinyalleri Kaldırmaya ve Ticaret Potansiyelini Artırmaya Yardımcı Olan Gelişmiş Filtrelerle Donatılmıştır. Birden fazla katmanl
Quantum Trend Sniper
Bogdan Ion Puscasu
4.8 (49)
Tanıtım       Kuantum Trend Keskin Nişancı Göstergesi   , trend tersine dönmeleri belirleme ve ticaret yapma şeklinizi değiştiren çığır açan MQL5 Göstergesi! 13 yılı aşkın ticaret tecrübesine sahip deneyimli tüccarlardan oluşan bir ekip tarafından geliştirilmiştir.       Kuantum Trend Keskin Nişancı Göstergesi       trend dönüşlerini son derece yüksek doğrulukla belirlemenin yenilikçi yolu ile ticaret yolculuğunuzu yeni zirvelere taşımak için tasarlanmıştır. ***Kuantum Trend Keskin Nişancı Gö
TrendMaestro5
Stefano Frisetti
note: this indicator is for METATRADER4, if you want the version for METATRADER5 this is the link:  https://www.mql5.com/it/market/product/108106 TRENDMAESTRO ver 2.4 TRENDMAESTRO recognizes a new TREND in the bud, he never makes mistakes. The certainty of identifying a new TREND is priceless. DESCRIPTION TRENDMAESTRO identifies a new TREND in the bud, this indicator examines the volatility, volumes and momentum to identify the moment in which there is an explosion of one or more of these data a
Bu gösterge paneli, seçilen semboller için mevcut en son   harmonik kalıpları   gösterir, böylece zamandan tasarruf edersiniz ve daha verimli olursunuz /   MT4 sürümü . Ücretsiz Gösterge:   Basic Harmonic Pattern Gösterge sütunları Symbol :   seçilen semboller görünecektir Trend:   yükseliş veya düşüş Pattern :   desen türü (gartley, kelebek, yarasa, yengeç, köpekbalığı, cypher veya ABCD) Entry :   giriş fiyatı SL:   zararı durdur fiyatı TP1:   1. kar alma fiyatı TP2:   2. kar alma fiyatı
FX Power MT5 NG
Daniel Stein
5 (5)
Sabah Brifingimiz burada mql5 ve on Telegram! FX Power MT5 NG , uzun zamandır çok popüler olan döviz gücü ölçerimiz FX Power'ın yeni neslidir. Peki bu yeni nesil güç ölçer ne sunuyor? Orijinal FX Power hakkında sevdiğiniz her şey PLUS GOLD/XAU güç analizi Daha da hassas hesaplama sonuçları Ayrı ayrı yapılandırılabilir analiz dönemleri Daha da iyi performans için özelleştirilebilir hesaplama limiti Özel çokluDaha fazlasını görmek isteyenler için örnek ayarlar Her grafikte en sevdiğiniz renkler i
Matrix Arrow Indicator MT5
Juvenille Emperor Limited
5 (12)
Matrix Arrow Indicator MT5 ,   forex ,   emtialar ,   kripto   para birimleri ,   endeksler ,   hisse senetleri   gibi tüm sembollerde/araçlarda kullanılabilen   %100 yeniden boyamayan   çoklu zaman çerçevesi göstergesini izleyen benzersiz bir 10'u 1 arada trenddir.  Matrix Arrow Indicator MT5 , mevcut eğilimi erken aşamalarında belirleyecek ve aşağıdakiler gibi 10'a kadar standart göstergeden bilgi ve veri toplayacaktır: Ortalama Yönlü Hareket Endeksi (ADX) Emtia Kanal Endeksi (CCI) Klasik Hei
Top indicator for MT5   providing accurate signals to enter a trade without repainting! It can be applied to any financial assets:   forex, cryptocurrencies, metals, stocks, indices .  Watch  the video  (6:22) with an example of processing only one signal that paid off the indicator! MT4 version is here It will provide pretty accurate trading signals and tell you when it's best to open a trade and close it. Most traders improve their trading results during the first trading week with the help of
FxaccurateLS
Shiv Raj Kumawat
WHY IS OUR FXACCCURATE LS MT5 THE PROFITABLE ? PROTECT YOUR CAPITAL WITH RISK MANAGEMENT Gives entry, stop and target levels from time to time. It finds Trading opportunities by analyzing what the price is doing during established trends. POWERFUL INDICATOR FOR A RELIABLE STRATEGIES We have made these indicators with a lot of years of hard work. It is made at a very advanced level. Established trends provide dozens of trading opportunities, but most trend indicators completely ignore them!
AT Forex Indicator MT5
Marzena Maria Szmit
5 (3)
The AT Forex Indicator MT5 is a sophisticated trading tool designed to provide traders with a comprehensive analysis of multiple currency pairs. This powerful indicator simplifies the complex nature of the forex market, making it accessible for both novice and experienced traders. AT Forex Indicator uses advanced algorithms to detect trends, patterns and is an essential tool for traders aiming to enhance their forex trading performance. With its robust features, ease of use, and reliable signal
Advanced Supply Demand MT5
Bernhard Schweigert
4.5 (14)
Herhangi bir Acemi veya Uzman Tüccar için En İyi Çözüm! Bu gösterge benzersiz, yüksek kaliteli ve uygun fiyatlı bir ticaret aracıdır çünkü bir dizi tescilli özelliği ve yeni bir formülü bir araya getirdik. Bu güncelleme ile çift zaman dilimi dilimlerini gösterebileceksiniz. Yalnızca daha yüksek bir TF gösteremeyeceksiniz, aynı zamanda TF grafiğini ve ARTIK daha yüksek TF'yi de gösterebileceksiniz: YUVARLAK BÖLGELERİ GÖSTERMEK. Tüm Arz Talebi tüccarları buna bayılacak. :) Önemli Bilgiler Açıkland
TPA True Price Action indicator reveals the true price action of the market makers through 100% non-repainting signals strictly at the close of a candle! TPA shows entries and re-entries, every time the bulls are definitely stronger than the bears and vice versa. Not to confuse with red/green candles. The shift of power gets confirmed at the earliest stage and is ONE exit strategy of several. There are available now two free parts of the TPA User Guide for our customers. The first "The Basics"
XQ Indicator MetaTrader 5
Marzena Maria Szmit
3 (2)
Step into the realm of Forex trading with confidence and precision using XQ, a cutting-edge Forex indicator designed to elevate your trading game to unprecedented heights. Whether you're a seasoned trader or just stepping into the world of currency exchange, XQ Forex Indicator empowers you with the insights and signals needed to make informed trading decisions. The signal conditions are a combination of three indicators, and XQ Forex Indicator only display  medium and long-term trends . The ind
Protect against whipsaws: revolutionize your swing trading approach Special Offer: Purchase now to receive free bonuses worth $135! (Read more for details) Swing Trading is the first indicator designed to detect swings in the direction of the trend and possible reversal swings. It uses the baseline swing trading approach, widely described in trading literature. The indicator studies several price and time vectors to track the aggregate trend direction and detects situations in which the market i
Trade smarter, not harder: Empower your trading with Harmonacci Patterns Special Offer: Purchase now to receive free bonuses worth $165! (Read more for details) This is arguably the most complete harmonic price formation auto-recognition indicator you can find for the MetaTrader Platform. It detects 19 different patterns, takes fibonacci projections as seriously as you do, displays the Potential Reversal Zone (PRZ) and finds suitable stop-loss and take-profit levels. [ Installation Guide | Up
FX Volume MT5
Daniel Stein
4.93 (14)
Sabah Brifingimiz aracılığıyla ayrıntılar ve ekran görüntüleri ile günlük piyasa güncellemenizi alın burada mql5 ve on Telegram ! FX Volume, bir brokerin bakış açısından piyasa duyarlılığı hakkında GERÇEK bir fikir veren İLK ve TEK hacim göstergesidir. COT raporlarından çok daha hızlı bir şekilde, brokerlar gibi kurumsal piyasa katılımcılarının Forex piyasasında nasıl konumlandıklarına dair harika bilgiler sağlar. Bu bilgileri doğrudan grafiğinizde görmek, ticaretiniz için gerçek oyun değiştir
Noize Absorption Index - is the manual trading system that measures the difference of pressure between bears forces and bulls forces. Green line - is a noize free index that showing curent situation. Zero value of index shows totally choppy/flat market.Values above zero level shows how powerfull bullish wave is and values below zero measures bearish forces.Up arrow appears on bearish market when it's ready to reverse, dn arrow appears on weak bullish market, as a result of reverse expectation.
Unlock key market insights with automated support and resistance lines Special Offer: Purchase now to receive free bonuses worth $75! (Read more for details) Tired of plotting support and resistance lines? This is a multi-timeframe indicator that detects and plots supports and resistance lines in the chart with the same precision as a human eye would. As price levels are tested over time and its importance increases, the lines become thicker and darker, making price leves easy to glance and ev
Gold Trend 5
Sergei Linskii
5 (1)
Altın Trend - bu iyi bir hisse senedi teknik göstergesidir. Gösterge algoritması, bir varlığın fiyat hareketini analiz eder ve oynaklığı ve potansiyel giriş bölgelerini yansıtır. En iyi gösterge sinyalleri: - SATIŞ için = kırmızı histogram + kırmızı KISA işaretçi + aynı yönde sarı sinyal oku. - AL için = mavi histogram + mavi UZUN işaretçi + aynı yönde aqua sinyal oku. Göstergenin faydaları: 1. Gösterge yüksek doğrulukta sinyaller üretir. 2. Onaylanmış bir ok sinyali yalnızca trend
Bu gösterge paneli, seçilen semboller için ticaret stratejinize bağlı olarak hem ölçeklendirme hem de uzun vadeli modda grafikteki   Arz ve Talep   bölgelerini keşfeder ve görüntüler. Ek olarak, gösterge tablosunun tarayıcı modu, istediğiniz tüm sembolleri bir bakışta kontrol etmenize ve uygun pozisyonları kaçırmamanıza yardımcı olur /   MT4 sürümü Ücretsiz gösterge:   Basic Supply Demand Özellikler Birden fazla döviz çiftinde   alım satım fırsatlarını görüntülemenize olanak tanıyarak,
The Price Action Finder Multi indicator is an indicator of entry points that searches for and displays Price Action system patterns on dozens of trading instruments and on all standard time frames: (m1, m5, m15, m30, H1, H4, D1, Wk, Mn). The indicator places the found patterns in a table at the bottom of the screen. By clicking on the pattern names in the table, you can move to the chart where this pattern is located. Manual (Be sure to read before purchasing) | Version for MT4 Advantages 1. Pa
Altın ATR MTF - bu iyi bir hisse senedi teknik göstergesidir. ATR (Ortalama Gerçek Aralık) göstergesinin algoritması, varlık fiyatının hareketini analiz eder ve belirtilen zaman diliminin (D1) açılış fiyatının belirli yüzdeleri (%) cinsinden karşılık gelen seviyeleri çizerek oynaklığı yansıtır. Sembol fiyat hareketi yönünün göstergeleri (kırmızı ve/veya mavi D1 H4) ve ok sinyalleri, rahat ve karlı gün içi ticaret ve/veya ölçeklendirme için ek ve temel yardımcılardır. Günlük kazanç Forex semboll
Automated Trendlines MT5
Georgios Kalomoiropoulos
Trend çizgileri, forex ticaretinde en önemli teknik analiz aracıdır. Ne yazık ki, çoğu tüccar onları doğru şekilde çizmez. Otomatik Trend Çizgileri göstergesi, piyasaların trend hareketini görselleştirmenize yardımcı olan ciddi tüccarlar için profesyonel bir araçtır. İki tür Trend Çizgisi, Boğa Trend Çizgisi ve Ayı Trend Çizgisi vardır. Yükseliş trendinde, Forex trend çizgisi, fiyat hareketinin en düşük salınım noktalarından geçer. En az iki "en düşük düşük"ü birleştirmek, bir trend çiz
Order Block Hunter MT5
Noha Mohamed Fathy Younes Badr
5 (1)
Order block hunter indicator is the best indicator for  hunt the order blocks that area where there has been a large concentration of limit orders waiting to be executed Order blocks are identified on a chart by observing previous price action and looking for areas where the price experienced significant movement or sudden changes in direction .This indicator does that for you by using very complicated codes and helps you to take the best areas To buy and sell because it make marks at the best a
MetaForecast M5
Vahidreza Heidar Gholami
5 (2)
MetaForecast, fiyat verilerindeki harmonileri kullanarak herhangi bir piyasanın geleceğini tahmin eder ve görselleştirir. Piyasa her zaman tahmin edilemezken, fiyatlarda bir desen varsa, MetaForecast geleceği mümkün olduğunca doğru bir şekilde tahmin edebilir. Benzer ürünlere göre, MetaForecast piyasa eğilimlerini analiz ederek daha kesin sonuçlar üretebilir. Giriş Parametreleri Past size (Geçmiş boyut) MetaForecast'ın gelecekteki tahminler oluşturmak için kullandığı çubuk sayısını belirtir. M
Golden Spikes Detector Acknowledgement and Dedications:  The name of this indicator was Inspired by an Original; Mr Grant Koopman; a Knowledgeable and experienced Synthetics trader. I dedicate this indicator to Mr Grant.  Overview: The Golden Spikes Premium is a groundbreaking trading indicator meticulously crafted for the Boom and Crash indices on the Deriv market. Tailored to meet the needs of discerning traders, this powerful tool operates exclusively on the one-minute timeframe, providin
Market Overview MT5
Mehran Sepah Mansoor
Piyasa gücü ve duyarlılık göstergemizle alım satım kararlarınızı optimize edin ve artık trende karşı alım satım yapmayın! Doğru ve zamanında bilgiye değer veren ciddi yatırımcılar için titizlikle tasarlanan göstergemiz, 28 ana çifte çok basit bir şekilde kuş bakışı bir görünüm sağlar. Bu araç, döviz çiftlerini popülerlik, yükseliş veya düşüş eğilimi gücü ve alıcı ve satıcıların yüzdesi /   MT5 versiyonuna   göre sıralayabilir.  Özellikler Gerçek Zamanlı Trend Gücü: Her bir döviz çiftind
Boom and Crash Trend Detector is a  Non-Repaint   MT5 trading system usually being sold for 50 0$ . Most people use this for Deriv but can be used to forex too. The boom and crash spike indicator is a spike detecting software, with Multiple features, these features include. Spike Alert ( from 10 to 100-second warning before spike) Continues spike Alert (for double or continuous spikes at a time) supports all Boom/crash Indices M6 time frame works best here . Bigger time frame trend pointer f
Yazarın diğer ürünleri
Power of 3 ICT Series
Juan Pablo Castro Forero
5 (1)
<p><b>The Power of 3 ICT</b> düşük zaman dilimlerinde ticaret yaparken HTF'yi izlemenize yardımcı olacak en iyi araçtır. Bu gösterge, LTF grafiğinizde en fazla 2 farklı HTF mumunu görmenizi sağlar, böylece mevcut fiyat hareketinin daha yüksek zaman dilimlerinde nasıl göründüğünü ve işleminizi daha yüksek zaman dilimi trendine uygun olarak yapıp yapmadığınızı her zaman bilirsiniz.</p> <div class="atten">     <p><a href=" https://www.mql5.com/en/blogs/post/758051 " title=" https://www.mql5.com/e
KillZones ICT Series
Juan Pablo Castro Forero
Kill zones ICT, piyasaları daha iyi bir perspektiften görmenizi sağlayacak güçlü bir göstergedir. Bu gösterge aracı, ticaretin en önemli faktörlerinden biri olan zamanı grafik üzerinde göstermektir. Kolay arayüzü ile daha yüksek volatiliteye sahip zamanların ve daha az aktif saatlere sahip seansların hareketinin ne olduğunu kolayca görebileceksiniz.  Bu göstergeyi BİT / Likidite kavramlarını takas etmek için nasıl kullanabilirim?    Kill Zones ICT ile ne yapabilirsiniz? Piyasalarda ana otur
Silver Bullets Catcher
Juan Pablo Castro Forero
5 (1)
Introducing: The Silver Bullet Pro Trade with Precision, Prosper with Power! Experience next-gen financial tech with the Silver Bullet Pro Trading Robot, inspired by the famed ICT Silver Bullet Strategy. Trade in the markets with an strategy tester over 10 years. Highlights: Optimized Performance : Harness the strength of the ICT Silver Bullet Strategy, known for its razor-sharp precision and unparalleled accuracy. Automated Excellence : Say goodbye to hours of screen time! Silver Bullet Pro ens
Filtrele:
İnceleme yok
İncelemeye yanıt