YK USD Currency Strength Index MT5
- Göstergeler
- Peechanat Chatsermsak
- Sürüm: 1.0
This indicator shows the strength of each currency compared to the US dollar by calculating the rate of change in price over a specified time period.
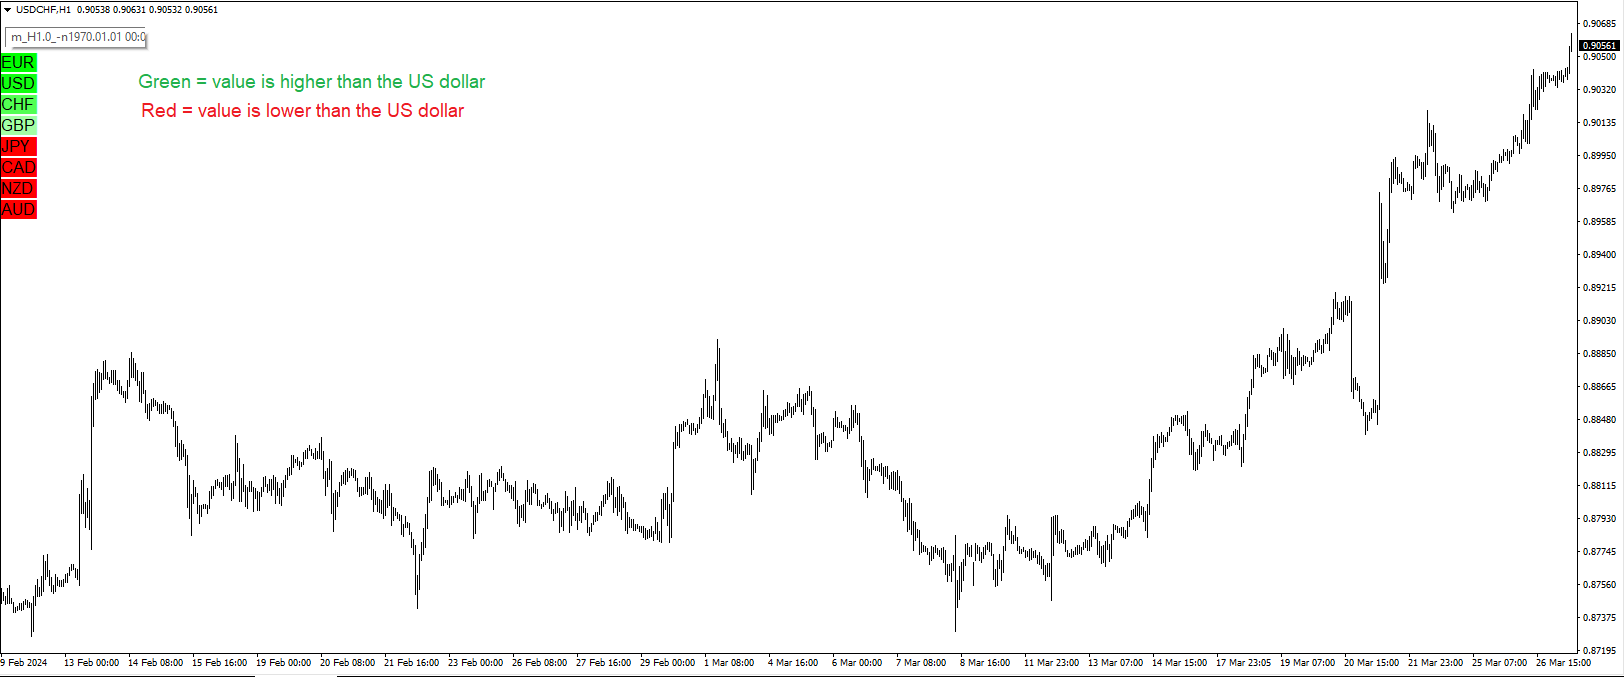
When you open the indicator, you'll see a list of different currencies on the price chart. Each currency will have a numerical value indicating its strength level compared to the US dollar, where:
- If the value is higher than the US dollar, it will be displayed in green, meaning that currency is stronger than the dollar.
- If the value is lower than the US dollar, it will be displayed in red, meaning that currency is weaker than the dollar.
- If the value is equal to the US dollar, it will be displayed in white.
The displayed values will change according to the specified time period, which can be adjusted using the BeforeMin parameter. For example, if set to 60 minutes, it means the calculation will be based on the open and close prices from 60 minutes ago.
Additionally, you can adjust the position, font size, and display format using various other parameters.
In summary, this indicator helps provide an overview of the strength of different currencies compared to the US dollar, which is crucial information that traders can use to make informed decisions when trading currencies.
Indicator นี้ทำหน้าที่แสดงค่าความแข็งแกร่งของแต่ละสกุลเงินเมื่อเทียบกับสกุลเงินดอลลาร์สหรัฐ โดยใช้การคำนวณอัตราการเปลี่ยนแปลงของราคาในช่วงเวลาที่กำหนด
เมื่อเปิด Indicator แล้ว จะเห็นรายการของสกุลเงินต่างๆ บนกราฟราคา แต่ละสกุลเงินจะมีค่าตัวเลขแสดงถึงระดับความแข็งแกร่งเทียบกับดอลลาร์สหรัฐ โดย:
- ถ้าค่าสูงกว่าดอลลาร์สหรัฐ จะแสดงเป็นสีเขียว หมายถึงสกุลเงินนั้นแข็งค่ากว่าดอลลาร์
- ถ้าค่าต่ำกว่าดอลลาร์สหรัฐ จะแสดงเป็นสีแดง หมายถึงสกุลเงินนั้นอ่อนค่ากว่าดอลลาร์
- ถ้าค่าเท่ากับดอลลาร์สหรัฐ จะแสดงเป็นสีขาว
ค่าที่แสดงจะเปลี่ยนแปลงไปตามช่วงเวลาที่กำหนด ซึ่งสามารถปรับได้จากพารามิเตอร์ BeforeMin เช่น ถ้าตั้งเป็น 60 นาที ก็หมายถึงจะคำนวณจากราคาเปิดและปิดย้อนหลัง 60 นาทีก่อนหน้า
นอกจากนี้ ยังสามารถปรับตำแหน่ง ขนาดตัวอักษร และรูปแบบการแสดงผลได้ตามพารามิเตอร์ต่างๆ
โดยสรุปแล้ว Indicator นี้ช่วยให้เห็นภาพรวมของความแข็งแกร่งของสกุลเงินต่างๆ เทียบกับดอลลาร์สหรัฐ ซึ่งเป็นข้อมูลสำคัญที่นักลงทุนสามารถนำไปประกอบการตัดสินใจในการซื้อขายสกุลเงินได้