YouTube'dan Mağaza ile ilgili eğitici videoları izleyin
Bir ticaret robotu veya gösterge nasıl satın alınır?
Uzman Danışmanınızı
sanal sunucuda çalıştırın
sanal sunucuda çalıştırın
Satın almadan önce göstergeyi/ticaret robotunu test edin
Mağazada kazanç sağlamak ister misiniz?
Satış için bir ürün nasıl sunulur?
MetaTrader 5 için Uzman Danışmanlar ve göstergeler - 90

This indicator labels swing highs and swing lows as well as the candle pattern that occurred at that precise point. The indicator can detect the following 6 candle patterns: hammer , inverse hammer , bullish engulfing , hanging man , shooting star and bearish engulfing .
The notations HH, HL, LH, and LL you can see on the labels are defined as follows:
HH : Higher high
HL : Higher low
LH : Lower high
LL : Lower low
Setting
Length: Sensitivity of the swing high/low de
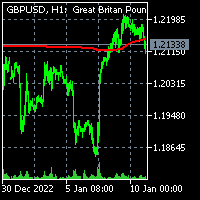
To get access to MT4 version please click here . - This is the exact conversion from TradingView: "Trend Regularity Adaptive Moving Average","TRAMA" By " LuxAlgo ". - This is a light-load processing and non-repaint indicator. - Buffer is available for the main line on chart. - You can message in private chat for further changes you need. Thanks for downloading

Overview: The news bot places a buy and sell trade at the same time before economic news is released, when spreads are low. Minutes before the news, the bot places stop loss orders on both trades and adjusts them based on real-time market movements. As the news approaches, the bot stops adjusting the stop loss orders and allows them to be triggered by the market. Depending on the impact of the news, one stop loss order may be triggered and the corresponding trade closed, while the other trade re

Forex Fighter is an advanced, multicurrency system that trades following symbols: EURJPY, GBPCHF, EURGBP, USDCAD, AUDNZD, USDJPY and AUDCAD. The strategy is based on built in indicators which I developed myself. Forex Fighter follows unique patterns that are repetitive but very often human brain is not capable of catching them. The decision maker here are two Neural Networks which have to agree whether or not a particular trade will be placed. The probability of repeating a pattern has to be ab

Moving Level , Special indicator for hunting trends and scalping! programmed to use it in any temporality, It has the trend volume strategy by marking an arrow if it is long or short accompanied by the colors blue yellow and red when it marks the yellow line with the arrow pointing up and is accompanied by blue lines, it is an uptrend When it marks the down arrow with the yellow line and is accompanied by red lines, it is a downtrend. It is used in the synthetic index markets in all pairs, It is
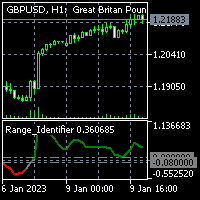
To get access to MT4 version please click here . - This is the exact conversion from TradingView: "Range Identifier" By "Mango2Juice". - All twelve averaging options are available: EMA, DEMA, TEMA, WMA, VWMA, SMA, SMMA, RMA, HMA, LSMA, Kijun, McGinley - This is a light-load processing and non-repaint indicator. - Buffer is available for the main line on chart and not for thresholds. - You can message in private chat for further changes you need.
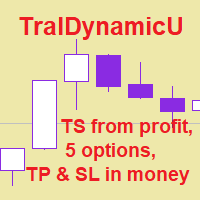
The utility for managing open positions can work with stops (take profit and stop loss) in money, percentages or points. The built-in trailing stop starts working from profit, the size of which can be set in currency or as a percentage. Trailing stop can work in three modes and for five instruments. With the help of the built-in trading simulator, you can check how the utility works in the strategy tester. Benefits setting stop loss and take profit in the deposit currency, as a percentage of the

Sniper rank, It has a gang programmed to hunt down perfect tickets. It has two lines that are used to hunt perfect pivots when the sails of the band come out, They work for all pairs of synthetic indices, perfect for volatility and jumps It also serves for marking forex, it operates in all pairs It is used for scalping and higher temporalities! Perfect Profit!!!!

An Ultimate Tool for quick and efficient market analysis. Unique combination of solid indicators defining market direction for trend tracking and filtration designed for you to stay on the right side of the market.
Market Rider Oscillators gives you access to one of the most used from professional trades indicators on worldwide, which were not build in for MT4 and MT5 terminals . These are unique non-repainting oscillators designed to be used on all time frames for all instruments class

An Ultimate Tool for quick and efficient market analysis. Unique combination of solid indicators defining market direction for trend tracking and filtration designed for you to stay on the right side of the market.
Market Rider Tools gives you access to one of the most used from professional trades indicators on worldwide, which were not build in for MT4 and MT5 terminals . These are unique non-repainting indicators designed to be used on all time frames for all instruments classes: Fo

Critical Trading, Currency Strength This indicator allows for viewing true value changes in the 8 major currencies, this ability has many applications for simple and advanced forex trading. No need to switch to inaccurate 3rd party applications or websites. Trend catching: No need to watch 28 charts, pair up the strongest and weakest performing pairs. Optimize entries: Show the currencies of your current chart and enter on reliable pullbacks for further confluence on your trades. Currency perfo
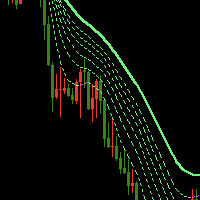
The Waterfall Trend Indicator MT5 uses line regression algorithm, using "Waterfall" in its name is in that it like waterfall when there is a strong down market trend. The indicator draws seven lines, one of which is sold line, others are dash line, the sold line is more stable. Indicator introduction The indicator can effectively filter price noise since it is calculated with line regression. It can be used to analyze market trend and design new expert that is based on trend. When the trend lin

The problem with trading candlestick patterns becomes obvious, after some experience in live markets. Hypothetical branching of candlestick patterns, are not necessary for successful trading. As a Price action trader, my principle is to keep things simple and consistent. My focus is on buying and selling pressure, which is visible in market structure. Trade Management and discipline are my secondary core elements. This indicator detect 4 Simple but Effective Price action Patterns! Yellow = Insi

The EA MuliIndy Swing Trade uses a swing trade system + martingale system + neural network system + indicator strategy (AWESOME OSCILLATOR (AO),STD,ATR) working together to find the best profit and low drawdown for trading. using historical data statistics probability. Let's give the weight of each indicator, which gives good results when the graph fluctuates up and down. without looking at trends alone For EURUSD M15 best default setting EA, it can be used Optimization Backtest to trade other

The EA Trend Pivot Point uses pivot values to choose a buy or sell trade and uses two indicators, STD and ATR, to measure market volatility and choose if market volatility is high not to trade. If the market volatility is less, then trading is allowed. Use pivot point calculations alone for probabilistic weighting of 10 AI pivot values. Based on a 20 year retrospective data backtest Resulting in the weight of this pivot value, for default it is for trading EURUSD Timeframe M15 which user can fin

The EA MultiIndy Hybrid Trend used to a trading system that combines 11 indicators 1. BOLLINGER BAND 2.RSI 3.MA 4.AO 5.MACD 6.CCI 7.MOMENTUM 8.FRACTAL 9.PARABOLIC SAR 10.STD 11.ATR and then AI to find the probability of each indicator as its weight value. Common use of martingale Then backtest twenty years to become this automated trading system. EA can send alerts through the program line, can adjust the risk. or turn off the martingale according to user requirements or can trade any currency

The EA AI Trend Price Action uses a trading strategy of Price Action and AI combined with Martingale The results of the backtest data 2003-2023. Using 100% reliable tick data, choose safe trades with very low risk even with martingale. But limiting the risk, not too high which can be set by the user himself as well. Requirements Supported currency pairs: EURUSD Timeframe: M30 The minimum deposit is $200 for a 1:400 leverage

Swing Trade MA is auto trading Use a system of MA Fast crossover with MA Slow and in the AI(neural network) to measure the probability weights of 10 MA lines and using the Martingale system. Backtest tick data 100 % from 2003-2023 by default setting trading EURUSD Timeframe M15. Requirements Supported currency pairs: EURUSD Timeframe: M15 The minimum deposit is $5 00 for a 1:400 leverage EXPERT DESCRIPTION Variable Description Stop Loss Stop Lost Take Profit Take Profi

Stochastic Strategy Revealer This EA uses Stochastic Oscillator to generate strategies for almost all markets and trade them using this EA. How will this EA help you? We all know trading is hard, and creating a strategy is even harder, so this EA will let us sit back and let the strategies reveal themselves to us and select the ones we like. this ea was made to get rid of wondering and headaches and you will only search for good markets. Positions Sizing This EA uses the basic position sizing m
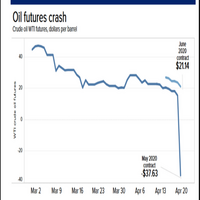
TEST VE KULLANMADAN ÖNCE EA'YI OPTİMİZE EDİN.
Ham Petrol Vadeli İşlemleri, Ocak 2022 - Aralık 2022 arasındaki 1 saatlik zaman dilimlerindeki gerçek vadeli işlem piyasası verileriyle oluşturulmuştur. Geriye dönük test ve analiz için bu tarihleri test edin. Gerektiğinde optimize edin.
Gerçek vadeli işlem piyasasından işlem yapın veya herhangi bir Petrol türevinin alım satımını yapıyorsanız, kullandığınız verilere ve komisyoncuya nasıl uyduğunu görmek için parametreleri test edin. Vadeli işlem

The Trend Snatcher is a multi-timeframe indicator that detects swings on the price market chart. Important levels, such as Supply and Demand levels, Trendline touches, reversal patterns, and others, can also be added as confluence when making trading decisions.
The indicator employs two lines that aim for the highest selling and lowest buying levels. When the two lines cross, a signal is generated.
All trading instruments are compatible, including currency pairs, synthetic indices, metals
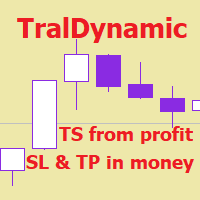
The utility for managing open positions can work with stops (take profit and stop loss) in money, percentages or points. The built-in trailing stop starts working from profit, the size of which can be set in currency or as a percentage. With the help of the built-in trading simulator, you can check how the utility works in the strategy tester. Benefits setting stop loss and take profit in the deposit currency, as a percentage of the account balance or by points; adding stop loss and take profit

Sniper2 , It has points of lines, with colors that are showing you an entrance, that work as support and resistance! green dotted lines green shows entry for sale, the red dotted lines show a buy entry, pay attention to the supports that work as a break to catch long candles in a longer period of time. works for forex all pairs works for synthetic indices all pairs ! indicator on sale!
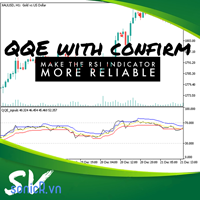
New QQE with confirm The relative strength index (RSI) is a technical indicator of momentum that measures the speed and change of price on a scale of 0 to 100, typically over the past 14 periods. Cause RSI measures the speed and change of price, trader normally use this indicator in two way: + Buy when oversold, sell when overbougth. + buy or sell when identifying divergence from rsi with price. In two way, it wrong when rsi in overbouth (for example) for long time or divergence. Even price ju

Multipound Scalper MT5 is a multicurrency Expert Advisor that works with a customizable trading time filter, Moving Averages and Bollinger Bands Indicators to determine the market entry and exit points. ONLY 7 out of 10 copies left going at 62$ . NEXT PRICE : 98$ . SETUP The following is an overview of the settings used in this Expert Advisor: EA Comment = Comment of the order placed by the EA (Multipound Scalper). Fixed Lot size = 0.1 Use Risk = true (true means risk % will be used and false m
What is Double Top and Bottom Double top and bottom patterns are chart patterns that occur when the underlying investment moves in a similar pattern to the letter "W" (double bottom) or "M" (double top). Double top and bottom analysis is used in technical analysis to explain movements in a security or other investment, and can be used as part of a trading strategy to exploit recurring patterns. you can fin MT4 version hier
Indicator shows you 2 Level target and stop loss level. Stoploss level
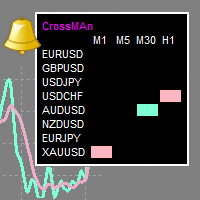
"CrossMAn" is a table indicator that gives signals about the intersection of two moving averages, on selected instruments and time periods.
The intersection of moving averages is one of the most popular signals on the stock exchange.
The signal is displayed as colored rectangles in the table. Thus, you can assess at a glance which tool should be paid attention to.
(Crossman does not add moving averages to the chart.)
The indicator table can be dragged with the mouse.
The size of the table

The diamond top and bottom are reversal patterns. It represents a rally to a new high with a drop to a support level followed by a rally to make a new high and a quick decline, breaking the support level to make a higher low. The bounce from the higher low is then followed by a rally, but making a lower high instead. Once this behavior is identified, prices then break the trend line connecting the first and second lows and start to decline further. You can find MT4 version hier
Indicator show

This z-score indicator shows the correct z-score of an asset, as it uses the normalized price data for calculation, which is the only correct way. Z-score is only applicable for normal distributed data, therefore not the actual price is considered, but the normalised returns, which were assumed to follow a normal distribution. Returns are mean reverting and assumed to follow a normal distribution, therefore z-score calculation of returns is more reliable than z-score on price, as price is NOT m
Trend Following Strategy Generator The following Expert Advisor helps to generate robust trend-following strategies using price action and a few parameters. the story behind the expert Advisor is to unfold market behavior for an instrument and choose how we can trade it best. After finding your favorite strategy you can save the parameters and start trading the strategy in no time. There is no limit to how many strategies you can generate. How will this EA help you? We all know trading is hard,
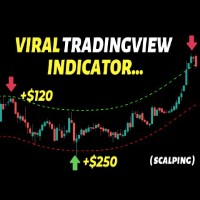
This indicator builds upon the previously posted Nadaraya-Watson Estimator. Here we have created an envelope indicator based on kernel smoothing with integrated alerts from crosses between the price and envelope extremities. Unlike the Nadaraya-Watson Estimator, this indicator follows a contrarian methodology. Settings
Window Size: Determines the number of recent price observations to be used to fit the Nadaraya-Watson Estimator.
Bandwidth: Controls the degree of smoothness of the envelop

Build your own model to predict averages of turning points of the Triple Moving Average Oscillator. It is simple. Rate me with stars. Just load the indicator Triple Moving Average Oscillator in you platform and choose the period. Scroll through to observe the averages of the highs and lows over a period of time. Add the levels for a buy and a sell on the Triple Machine and this will show the average of highs and lows to look for buys and sell. You can load multiple copies with multiple levels.
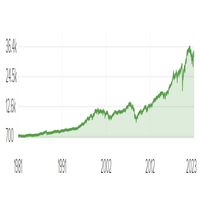
EA optimize edilebilir ve Ocak 2022'den itibaren optimize edilmiştir.
Dow Jones Lot Trader, makine öğrenimi ile yapılmıştır ve Dow Jones vadeli işlemlerini sabit lotlar kullanarak 1 saatlik grafiklerde alıp satar. EA, mikro Dow Jones'taki gerçek vadeli işlem verileri üzerine yapıldı.
Gerçek vadeli işlem verileriyle uyumlu olup olmadığını görmek için Dow Jones'un türevlerini alıp almadığınızı test etmeniz gerekebilir. sl ve tp, ortalama gerçek aralığa dayalıdır.
EA'daki mantık, en yüksek v

Fibonacci retracement levels—stemming from the Fibonacci sequence—are horizontal lines that indicate where support and resistance are likely to occur. Each level is associated with a percentage. The percentage is how much of a prior move the price has retraced. The Fibonacci retracement levels are 23.6%, 38.2%, 61.8%, and 78.6%. While not officially a Fibonacci ratio, 50% is also used. The indicator is useful because it can be drawn between any two significant price points, such as

Percentile of Historical Volatility and Correlation Coefficient shows if the asset is cheap or expensive based on the volatility. It is used to determine a good entry point. It has two indicators built in: Historical Volatility is ranked percentile wise and its correlation to price action which gives an indication of the direction of a possible future move. Together the both indicators can give good entries and direction. Historical Volatility is a statistical measure of the dispersion of retu

BU EA İYİLEŞTİRİLEBİLİR GİRİŞLERE SAHİPTİR.
Nice Little Bot, 1 saatlik grafiklerde GBP/USD ticareti yapıyor. Mantık için Keltner kanallarını, Bollinger bantlarını ve LWMA'yı kullanarak işlem yapar. Makine öğrenimi ile oluşturuldu ve hoş bir küçük robot.
Bulursanız optimize edilebilecek veya değiştirilebilecek girdiler vardır. Para yönetimi, bakiyenin ölçeklendirilmiş %'sini kullanır. Bakiye yüzdesi ve maksimum lotlar vardır. Geri test başlangıcında deneyin
2013'ten

EMA BASEd ON EMA, ICHIMOKU-Kejun-sen line and MACD input group "RSI Setting" input int Inp_RSI_ma_period = 7; // RSI: averaging period input ENUM_APPLIED_PRICE Inp_RSI_applied_price = PRICE_WEIGHTED; // RSI: type of price input double Inp_RSI_LevelUP = 60; // RSI Fast and Slow: Level UP input double Inp_RSI_LevelDOWN = 40; // RSI Fast and Slow: Level DOWN input string

This indicator shows OutsideBars (OB) and InsideBars(IB) in the chart in candle form.
The colors of the candles can be set individually. Also different colors for bearish and bullish IBs or OBs are possible.
In addition, the color of the wicks or Outlines can also be set.
OutsideBars and InsideBars often show good zones for support or resistance. See the Screenshot for some examples.

İkili Ticaret Paneli, MT4/MT5 platformunda ikili opsiyon ticareti yapmak için çok kullanışlı bir araçtır. Artık eklentileri MT4/MT5 dışında kurmaya gerek yok. Bu, doğrudan MT4/MT5 grafiği üzerinde basit ve kullanışlı bir paneldir. İkili Ticaret Paneli, ikili opsiyon ticareti yapmak için MT4/MT5 platformunu kullanan tüccarlar için faydalı bir araçtır. Bu, tüccarların harici eklentiler kurmaya veya birden çok ekran ve menüde gezinmeye gerek kalmadan doğrudan MT4/MT5 tablosundan ikili opsiyon işle

The indicator ‘Probability Range Bands’ gives a prediction of the amount, how much the asset is moving from its current price. The range bands give probabilities, that the candle close will not exceed this certain price level. It is also called the expected move for the current candle close. This Indicator is based on statistical methods, probabilities and volatility. Asset price is assumed to follow a log-normal distribution. Therefore, log returns are used in this indicator to determine the
Pack Dragon , Indicator 3/1, Dragon signal It has the strategy of an oscillator programmed to grab supports and resistances to take advantage of every candle in the market, and it gives you to take your time and a simple analysis it is simple where you mark the green dots at the bottom gives you input for long And when it does not mark anything, it is giving you a short warning! works for all seasons for forex markets and synthetic indices !

Pack Dragon, Indicator 2/3 Legend Moving It has the barrier pass strategy as well seen in the photo, where there is a dot on the yellow line, when there is a downtrend, there are red dots when it falls giving perfect entries in short, the same when the market is bullish, it marks another navy blue line, where it gives perfect entries over the green dots for long , It is available for all seasons and for markets of Forex and synthetic indices !

Pack Dragon. indicator 3/3 Dragon machine, has the perfected support and resistance strategy, indicates the floors and ceilings with the naked eye can be seen, giving signal to each circle pink giving entry to the rise and the green circle gives entry to the low wing, where the support of the green and red lines helps. Works for synthetic indices and forex all pairs, ideal for operating crash and boom. !
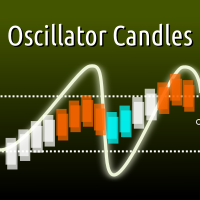
With this indicator you can colorize the candles on your chart based on the output of any oscillator indicator. Supporting both built-in and custom indicators, with the ability to set up to 5 custom parameters, custom color scheme, and upper/lower threshold values. Most built-in indicators in MT5 will be found under "Examples\\" path. For example, to use default RSI indicator, set your indicator path to "Examples\\RSI" in the inputs dialog. Input01-05 sets the custom parameters of your indicator

Package Yacht indicator 2/3 Oscillator yacht, has the strategy of breakouts with the oscillator in the levels, 1.05, 0.50, 0.00, 050 and 1.05 are 5 levels where the volume no longer gives in the period of 1.05 on the lower side, the red candle begins to form, rising ay gives long signal, where it verifies it with 3 yellow, green and red dots, the same is for short when it breaks the green level, and breaks the line changing color starts entry works for forex markets and synthetic indices all tem

Package Yacht indicator 3/3 Fibo Yacht, has the fibonacci strategy but better hunting the rebounds / pivots. As seen in the photo, setbacks can be calculated at any time, works very well for synthetic indices, and forex too! It is designed for volatility and jump pairs. also works on crash and boom! the indicator is placed and it is already operated! Wolrd inversor.

I developed this vwap with more settings in order to be customized as much as possible. VWAP is a really strong indicator for your trading. It can be used to check if the market is in balance or ranged, and also you can use the levels as support/resistence/target. In the pictures you can see the main settings, and you can select the use of real volume from the broker.
Hope you will find it useful. Many thanks in advance.

Black Card Pack indicator 5/1 point black It has the strategy of professional bollingers where each arrow gives you a different entry signal. It is used to operate in m1 and in d1 It is used for scalping and intraday, modified for forex markets ! suitable for all pairs modified for synthetic index markets suitable for all pairs! Ideal for volatility and jumps!

Black Card Pack Indicator 5/2 Macd Divergence Black It has the strategy of the cross of emas and the different lines as well seen in the photo! works for all seasons works for forex markets and synthetic index markets ideal for volatility 75, volatility 100, volatility 25 and volatility 50 pairs for all jumpers! for forex works on all pairs! eur/usd , usd/jpy , eur/aud etc !

Black Card Pack indicator 5/3 Green power It has the high and low breakout strategy giving the signal with the red or green dot the red dot for short and the green dot for long , perfect for forex markets and synthetic index markets, works for all seasons It is used for scalping and intraday! Ideal for Crash and boom markets!! Volatilitys y jumps !! Micro y macro en forex !

Pack Black Card, Indicator 5/4 Channel black, It is an indicator that has the strategy of grabbing pivots on an already programmed channel. as seen in the photo is perfect for scalping taking it in timeframes of m30, m15, m5 and m1 to grab profit rebounds. Although it works for all temporalities, it is designed to make short films, works for forex markets and synthetic indices all the pairs are able to operate!

Black Card Pack indicators. Bars Black indicator 5/5 of the pack It has a strategy of breaking bars as the indicator is called, It is very easy to use, although you can see it in the photo when you break the ema bars down to get into position up is the same! It works for all temporalities, it is used to hunt big trends and scalp suitable for forex and synthetic indices works on all pairs of both!
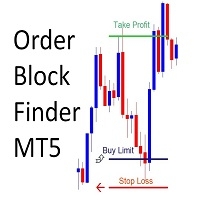
!! FLASH SALE !! Over 80% off !! For ONE week only. Now only $47 - normally $297! >>> Ends on 30 June 2023 - Don't miss it!
Sends Alerts – On MT5 To Your Phone To Your Email
Does not repaint .
Works on any Forex pair, any timeframe.
10 Activations allowed so you are free from limitations >> MT4 Version Here Spreads from 0.1pip RAW/ECN Accounts, click here . Check out my Waka Esque EA signal here: >> High Risk Settings or Medium Risk Settings .
What Is An Order Bl

Long & Short Based on Cointegration Statistical and Quantitative Long-Short (Pair Trading) approach for long and short positions. Your CPU will always be safe and stable when using Multiple Linear Regression if you have a reliable indicator. Based on the results of this indicator, you can execute a long and short or a long and long/short and short trade between two separate assets. It can show you a Highly informative dashboard based on Cointegration Search you determine, with all statistical d

The volatility scanner indicator is a tool that helps traders identify and analyze volatility in all the market timeframes for the current chart. This way you can find potentially profitable trades on every timeframe for the current symbol.
What It Does? Scan all timeframes to find a volatility contraction. Color the button yellow if there is a volatility squeeze at that timeframe. Clicking on the button instantly changes timeframe.
How To Use It? Just put it on the chart and click on the y

Better Period Separators For MetaTrader 5 The built-in period separators feature doesn’t allow users to specify the time period, so you can use this indicator to create more customizable period separators. On intraday charts, you could place period separators at a specific time, you could also place extra period separators at a specific time on Monday to mark the start of a week. On higher timeframe charts, this indicator works the same as the built-in period separators, On the daily chart, per

Fibo Ruby indicator 5/5 pack ruby fibo ruby has the strategy of a programmed fibonacci to capture the bullish trend as bass player ideal for grabbing rebounds at the points of 23.6, 38.2, 50.0 and 61.8 It adapts to any temporality, be it for scalping or intraday. works for forex markets, all pairs It is used for synthetic index markets, all pairs great for boom and crash!

Channel Zone indicator 4 of the ruby pack channel zone has the strategy where the channel channel breaks for the green color gives a short signal where it breaks for the red channel gives a long signal, It is very simple and easy to use. ideal for holding long tendencies as seen in the photo ideal for intraday works for forex markets all pairs for synthetic index markets all pairs! and for all time periods.

Trend Ruby, indicator 3 of the ruby pack. trend ruby has the strategy of breaking the structure or trend line How well do the lines mark and gives you the signal of breaking or following the trend? and bounce! works for any temporality, It is used for scalping and also intraday It works for the forex markets all the pairs, also for synthetic indices all pairs ideal for volatility and jumps! also crash and boom!

Macd Ruby , ruby pack flag 2 It has the strategy of the crossing of moving averages, where is the first cross for the rise or for the downside, get into position It serves to catch long trends also in other temporalities, and to scalp at low times, works for forex markets all pairs It works for the synthetic indices markets all pairs! works great on volatility and jumps!

ZigZag Ruby , Indicator 1 of 5 The ruby zigzag consists of a pivot strategy where he finishes giving a signal, the next pivot is easily grabbed, as seen in the photo It is used to hunt long trends in h1, h4 and d1 timeframes, ideal for scalping, works for forex markets, all pairs! works for synthetic index markets! all pairs ideal for volatilitys , jumps , crash y boom
RSI Bot, send alert to mobile, buy when RSI<=20, send alert sell when RSI>=80 you can set parameter RSI in setting Inp_RSI_ma_period = 14; // RSI: averaging period Inp_RSI_applied_price= PRICE_WEIGHTED; // RSI: type of price Inp_RSI_LevelUP = 60; // RSI Fast and Slow: Level UP Inp_RSI_LevelDOWN = 40; // RSI Fast and Slow: Level DOWN Inp_RSI_stringUP ="Signal Sell";// RSI Fast and Slow: Level UP label Inp_RSI_stringDOWN ="Si

Ticks Candles Chart indicator build equi-volume candles and designed for Oracle Strategy The Period in ticks is set directly on the chart Tick chart opens in a separate window Recommended to use tick periods from 50 and above Works on real time only
Input Parameters Ticks_In_Bar - default period in ticks Counting_Bars - how many tick bars of history to build Custom_Symbol_Suffix - additional suffix for symbols

Dragon Bolling. is an indicator programmed as enhanced bollinger bands It has an up, medium and down, to grab long cut and short, special for scalping works in all seasons in the forex markets and synthetic indices, in forex all the pairs in synthetic indices all pairs, but also designed to operate volatility and jumps! in m1 . m5 and m15, scalping to sign in h1 and h4 for lengths!
Market Price It has the indicator where it marks the current price where it is used to better visualize the price and according to the lime color, gray. magenta . where the lime marks the current price, gray brand without price change magenta marks the price ruling. works for all seasons for Forex and synthetic indices. All forex pairs and all synthetic index pairs.

Ice Up. It is an indicator where it fulfills the professional function of a zigzag together with support and resistance. Perfect for grabbing long and short trends. In the new version of Ice, it improves the pivots to %100. works for all seasons It works for forex and synthetic indices, and if the broker also has crypto. works for all forex pairs and synthetic indices.

What Is the Relative Vigor Index? The Relative Vigor Index (RVI) is a momentum indicator used in technical analysis that measures the strength of a trend by comparing a security's closing price to its trading range while smoothing the results using a simple moving average (SMA). The RVI's usefulness is based on the observed tendency for prices to close higher than they open during uptrends, and to close lower than they open in downtrends. KEY TAKEAWAYS The Relative Vigor Index (RVI) is a

The parabolic SAR indicator, developed by J. Welles Wilder Jr., is used by traders to determine trend direction and potential reversals in price. The technical indicator uses a trailing stop and reverse method called "SAR," or stop and reverse, to identify suitable exit and entry points. The parabolic SAR indicator appears on a chart as a series of dots, either above or below an asset's price, depending on the direction the price is moving. A dot is placed below the price when it is trending u
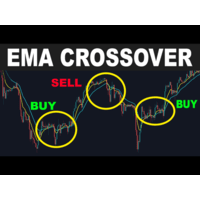
Moving Averages Expert EA is a type of automated trading strategy that utilizes two different moving averages to generate buy and sell signals. The moving averages are based on historical price data, and they are used to identify trends and determine the direction of the market. This EA by default generates buy signals when the fast moving average crosses above the slow moving average , indicating that the market is trending upwards. Conversely, sell signals are generated when the fast moving av

Winner Oscillator. As it is called, it is an oscillator that consists of a heikin ashi candlestick strategy + an oscillator programmed to grab perfect rebounds as it looks good in the photo It is used for scalping and intraday. It works for all seasons! and also for all forex pairs and synthetic indices It works very well also in volatility, jumps, crash and boom!
MetaTrader Mağaza, geliştiricilerin ticaret uygulamalarını satabilecekleri basit ve kullanışlı bir sitedir.
Ürününüzü yayınlamanıza yardımcı olacağız ve size Mağaza için ürününüzün açıklamasını nasıl hazırlayacağınızı anlatacağız. Mağazadaki tüm uygulamalar şifreleme korumalıdır ve yalnızca alıcının bilgisayarında çalıştırılabilir. İllegal kopyalama yapılamaz.
Ticaret fırsatlarını kaçırıyorsunuz:
- Ücretsiz ticaret uygulamaları
- İşlem kopyalama için 8.000'den fazla sinyal
- Finansal piyasaları keşfetmek için ekonomik haberler
Kayıt
Giriş yap
Gizlilik ve Veri Koruma Politikasını ve MQL5.com Kullanım Şartlarını kabul edersiniz
Hesabınız yoksa, lütfen kaydolun
MQL5.com web sitesine giriş yapmak için çerezlerin kullanımına izin vermelisiniz.
Lütfen tarayıcınızda gerekli ayarı etkinleştirin, aksi takdirde giriş yapamazsınız.