YouTube'dan Mağaza ile ilgili eğitici videoları izleyin
Bir ticaret robotu veya gösterge nasıl satın alınır?
Uzman Danışmanınızı
sanal sunucuda çalıştırın
sanal sunucuda çalıştırın
Satın almadan önce göstergeyi/ticaret robotunu test edin
Mağazada kazanç sağlamak ister misiniz?
Satış için bir ürün nasıl sunulur?
MetaTrader 5 için Uzman Danışmanlar ve göstergeler - 51

This indicator will mirror the assets in use in another metatrader, being able to choose the timeframe and a template. This is the Metatrader 5 Client, it needs the Metatrader 4 or 5 Server versions: Metatrader 4 Mirror Chart Server: https://www.mql5.com/en/market/product/88644
Metatrader 5 Mirror Chart Server: https://www.mql5.com/en/market/product/88652 Details of how it works in the video.
FREE

Indicador que cria um painel para acompanhamento to total de posições abertas no ativo do gráfivo.
São apresentados os dados: Ativo do gráfico Total de posições de venda em aberto Quantidade do volume de posições de venda em aberto Total de posições de compra em aberto Quantidade do volume de posições de compra em aberto.
Painel simples mas eficiente para o equilíbrio das ordens
FREE

Smart Copy is an Easy-to-Use EA that supports Multi Copying Metatrader4 and Metatrader5 and Local/Remote Copying. (Remote Version is coming soon)
This is Free Version and can be used on Demo accounts only. Use the Full Version for real trading.
Specifications :
Real Time, Multi Terminal - Multi Account - MT4/MT5 trade copying Copy from netting to hedge and hedge to netting is supported.
Fast and instant copy
All settings are input visually. Easy modifying symbol
FREE

Este indicador imprime 2 médias com distância de 1 ATR (Average True Range) da média principal. As demais médias móveis só são mostradas se estiverem fora desse intervalo. Parâmetros: mediaprincipal = Média que será criado o intervalo, não será mostrada. mediasec1, mediasec2, mediasec3 = médias secundárias. periodatr: periodos do ATR Este indicador faz parte do Trade System MarketStrengthRadar
FREE

This powerful tool is designed to help traders identify key reversal patterns in their charts, including the hammer and star bar formations. With this indicator, you can quickly and easily spot these patterns as they form, allowing you to make well-informed trades and potentially increase your profits. The Hammer Start indicator is customizable, allowing you to set your own parameters for identifying patterns and alerts. Whether you're a seasoned trader or just starting out, the Hammer and Star

Binance Future ( Binance Vadeli ) da listelenen sembolleri Metatrader5 piyasa gözlemine ekler. Ücretsiz bu dosya ile tüm liste saliseler içinde listeleyebilirsiniz. Demo hesabınıza kolayca kurabilirsiniz Binance Future Tick için yüklenmesi gereken ilk dosyadır ve ücretsiz sunulmaktadır. Araçlar menüsü / Seçenekler / Uzman Danışmanlar / Listelenen URL'ler için WebRequest kullan seçeneğini seçmeniz gerekli
Metatrader'a eklemek için videoları izleyebilirsiniz.
FREE

This is a Price Projection for Current Candle from Time Frame M15 To Weekly, It's shows Market Trends Teji (Bullish) Or Mandi (Berries). It's Show Teji High & Low for Bullish Market and Mandi High & Low for Berries Market. We can Plan Our Trade in Well Advance for our Current Open Trade. It's Generate New Data for Every New Candle. You are requested to Please Test it with demo Ac before Use in Real Trade. Please Save it to your Mql\Indicator folder and attache to your chart. if any quay Please
FREE
The Tick Flow Meter, also known as Tick Density Meter or Tick Counter, is an innovative indicator designed to provide deep insights into market dynamics down to the second.
It is a cutting-edge indicator crafted to measure the intensity and frequency of ticks within specific time intervals. By focusing on tick flow, this indicator offers traders a unique perspective on market liquidity, momentum, and volatility, empowering them to make informed trading decisions.
Key Features: Granular Tim
FREE

The art of Forex is a new complex Expert Advisor that continuously trades in both directions. A series of orders will be opened to get the best average price until the take profit is hit. It is optimal for making profits in an unpredictable market. A loss coverage system is integrated to allow the recovery of orders that are too distant from the current price. The best results are on EUR/USD H1 but you can use it on any forex pair and timeframe . Live results : https://myx.gg/mql5 Share

Это специальная утилита, для подключения внешнего индикатора к торговой панели . Она позволяет получать данные из буфера индикатора и рисует стрелочные объекты для передачи их в торговую панель. Входные параметры
Number of call buffer - номер индикатора для покупки Number of sell buffer -номер индикатора для продажи Indicator window - окно индикатора Indicator position in list - позиция индикатора в списке Default value of indicator - значения по умолчанию для индикатора Show information - пока
FREE

Wolf Countdown helps you not to waste the right amount of time, it gives you back the time remaining until the candle closes.
How to use: Download and install the Wolf Countdown Indicator on your MetaTrader 5. Apply the indicator to your favorite chart.
this works on any timeframe...
Thanks to this indicator you will never miss the right moment to enter your trades.
FREE

This indicator can help you clearly identify trend changes in both bullish and bearish markets. The indicator compares the closing price of the last candle with the closing price of the candle "X" periods ago (input parameter). In an uptrend, an initial number '1' is plotted if a candle closes higher than the closing of a candle "X" periods ago. In a downtrend, an initial number '1' is plotted if a candle closes below the closing of a candle "X" periods ago. Subsequent numbers are plotted when e
FREE

Spread Indicator MT5 - NS Finanças. (http://www.nsfinancas.com.br) Auxiliary tool to give Spread visibility to all types of currency pairs and timeframes. The labels are well positioned in the upper right corner of the chart so as not to disturb the visualization during the trade, however it is also possible to drag the indicator to the best place on your screen. In addition to the current spread, this indicator also monitors the minimum, maximum and average spread of the selected currency pair
FREE

OrderBook Utilities is a script, which performs several service operations on order book hob-files, created by OrderBook Recorder . The script processes a file for work symbol of the current chart. The file date is selected by means of the input parameter CustomDate (if it's filled in) or by the point where the script is dropped on the chart. Depending from the operation, useful information is written into the log, and optionally new file is created. The operation is selected by the input parame
FREE

The indicator automatically plots significant trend lines and displays buy and sell signals. Signals are generated for reflection and breakdown from support and resistance lines. When a signal appears, the indicator displays it as an arrow of the specified color and also sends the message type specified in the input parameters. In the indicator settings, you can set the signal type, the maximum distance to the trend line, the type of notifications, as well as the settings for lines and ar

Daily Range Breakout EA is a breakout strategy with buys when close of current bar is lowest in past N bars and price of next bar is greater than close of previous bar. Condition for sell trades are the opposite. The idea is based on Larry Williams Smash Day strategy. I trade this strategy live and it works in multiple markets. It works best in Daily timeframe. Not Martingale/Grid Strategy. Real result with stop loss. You can reproduce the result for Gold using the default parameters. IMPORTANT!

Dashboard, TP line and Profit/Loss labels are set to false by default for speeding up the optimization. Switch them to True before you start. There are many strategies inside this EA as follows: - Entry based on indicator signal "as shown on the trend indicator " - Opposite to trade entry with opposite martingale - Entries based on " support and resistance indicator ". - Normal martingale - Normal martingale with distance multiplier - Normal martingale with volatility index - Opposite martingal

C300 SYNTHETIC INDICATOR 1MIN CHART Update V2 No repaint
*The indicator will not give a sell sign if the market conditions are not in place. *With all 3 strategy criteria in place the strategy based indicator signals 1-3 trades per day. *The drawdown can range to very high you need to place your own target profit and stop loss according to your risk management system . *The indicator is designed for only C300 and the 1min chart .
NB :Note this strategy based indicator will be free only f

This indicator can be used to study the repeating daily volatility structure, and also find deviations from the historical means. Black line tells the average volatility of current hour from last 30 days. Blue bands tell the confidence interval (2 times standard deviation). Red line tells the current volatility, ATR.
Inputs: - days: the number of days where to calculate the average volatility - atrp: the ATR period used to measure volatility
FREE

A "simple design" trading panel, which is characterized by small byte size, low CPU usage, simple steps, and quick operation, 1 to 2 clicks to complete a functional operation,
saving time and increasing efficiency . The panel is easy to use, and it is not complicated to set parameters, which is in line with traders' habits. At the same time, its compact-
design, clear at a glance, and comprehensive functions are a powerful tool for manual trading! Key features of the panel:
Click "Bid/Ask

This indicator, It can be applied to any financial assets: forex, cryptocurrencies, metals, stocks, indices . And This indicator base on Golden cross with custom length signal
Settings
FastSignalLength : Length of Fast Signal SlowSignalLength : Length of Slow Signal TimeFrame : Choose time frame to calculate ShowDeadCrossOnly : Show Dead Cross Channel Only ShowSignalMedianOnly : Show signal median line only when ShowDeadCrossOnly set to false alertOn : Send alert alertsOnCurrent : Alert

Hello Gold Seeker , We have a new strategy for finding opportunities in the gold market . This strategy has two system options: non-martingale or martingale . This strategy already includes a stop loss to minimize losses .
Notes for traders: Backtest from the beginning of 2023 until yesterday (08/07/2024) before this EA is released. Backtests have been conducted using "every tick-with real tick" and "random delay". The timeframe used is M5, but you are free to use any timeframe as we have loc

We at Minions Labs always like to defy the stablished systems and beliefs trying new things and new ways of seeing and interpreting the Market Data. And all starts with the following question...
WHAT IF...
You give more relevance and focus on the Wicks/Shadows on the candlesticks? And Why? In volatile markets wicks play an important role on determining who is winning the the fight between Bulls and Bears , and more than that, Higher and lower wicks can present you with a good status of the cu
FREE
Master Engulfing is designed with a moving average indicator to see trends, RSI and CCI to see momentum, and engulfing candles for entry points. Master Engulfing is a very accurate expert advisor for gold and all pair currencies. This EA has a lot of tools for entry position, you can make grid/ averaging or single entry, it's your choice.
Requirements :
Currency pair: XAUUSD/GOLD and ALL PAIR CURRENCIES Timeframe: M5 Minimum deposit currencies : $250 ($500 recommended) Minimum deposit gold/

Easy & Customizable.
Simple & Easy to close all trades and pending orders automatically at a specific time each day. Just drag this EA into any chart, any currency. It will be automatic close all opening positions and pending orders.
Input Parameters
1. Close All Opened Positions If = True : EA will close opening orders at your time, days setting. If = False : EA will not close opening orders. 2. Delete Pending Orders If = True : EA will delete pending orders at your time, days

SeasonalEA is an Expert Advisor for MetaTrader 5 that allows a trader to buy (or sell) symbols with timing rules. For example, the trader can add rules to buy on Monday at 10:00 am and sell on Tuesday at 5:00 pm. This software is useful for traders that: study seasonal patterns on Forex and CFD study intraday seasonals rules study timing trading rules This EA accepts up to 6 symbols rules (but if a trader wants to trade only one pair, they can do it simply by setting other lots to zero).
Input
FREE

It is the simplest indicator in existence. It has only one function: report the seconds elapsed since the last minute end in a very convenient way, with a label that can be moved in the chart, so that the trader does not have to take his eye off the forming candle. It is used on M1, but also on larger intervals, for those interested in opening/closing positions at the best time. Sometimes an intense movement in the last 10" of the minute gives indications of future trend, and can be used for sc
FREE

This is a regression tree indicator for MT4/MT5.
This indicator classificate nodes on the time period so that the deviation becomes smaller,
and displays regression line and channel for each node.
It's free!
Attached CartDemo.ex4 and CartDemo.ex5 is a Demo version and has the following limitations:
Method is RandomForest only
Maximum number of bars is 200
Maximum number of trees is 2
Maximum tree depth is 2
Calculated waste lines are shown
Not display correlation coefficients
Fu
FREE

The idea behind this indicator is to find all currency pairs that are over-bought or over-sold according to the RSI indicator at one go.
The RSI uses the default period of 14 (this can be changed in the settings) and scans all symbols to find the RSI level you will have specified. Once currency pairs that meet the specification are found, the indicator will open those charts for you incase those charts aren't open and proceed to write the full list of currencies on the experts tab.
FREE

To download MT4 version please click here . Metatrader users are limited to few moving average types. Therefor I decided to create a package consisting of all MAs I knew. This package suggests 12 different types: { SMA, EMA, DEMA, TEMA, WMA, VWMA, SMMA(RMA), HullMA, LSMA, ALMA, SSMA, TMA } You can configure them via input tab. This is a non-repaint indicator with light load. To implement them I referred to standard libraries of pine script.
FREE

Tick Database — export of tick database from MT5 terminal to MT4. The utility provides access to the tick database in real time. This is necessary to generate synthetic charts in the MT4 terminal, which initially does not provide for loading a tick database. For example, you can organize permanent access to the tick database for the " Seconds Chart " utility, which create seconds charts in the MT4 terminal. If the opening time of the last candle in the terminals is different, then you need to sp
FREE

Indicador MAPS Indicador é um oscilador que faz o plot da Curva de Retorno de uma regressão de segundo grau para os preços de fechamento do ativo do gráfico. A Curva de Retorno é a linha central do indicador MAPS e representa a região de equilíbrio do preço entre vendedores e compradores. Os plots do indicador são: Linha central - C0 - cor da mesma varia de acordo com a tendência do mercado, sendo verde para tendência de alta e vermelho para baixa; Linhas superiores: S1, S2, S3 e S4, sendo que a
FREE

** All Symbols x All Time frames scan just by pressing scanner button ** *** Contact me to send you instruction and add you in "Divergence group" for sharing or seeing experiences with other users. Introduction MACD divergence is a main technique used to determine trend reversing when it’s time to sell or buy because prices are likely to drop or pick in the charts. The MACD Divergence indicator can help you locate the top and bottom of the market. This indicator finds Regular divergence for pul

Pivots Points are significant levels traders can use to determine directional movement, support and resistance. Pivot Points use the prior period's high, low and close to formulate future support and resistance. In this regard, Pivot Points are predictive and leading indicators. Pivot Points were originally used by floor traders to set key levels. Floor traders are the original day traders. They deal in a very fast moving environment with a short-term focus. At the beginning of the trading day,

Simply deletes all objects from a chart, at once.
Q: Shouldn't I remove the indicator(s) from the chart instead, if I want to get rid of those objects? A: Absolutely. There are rare cases though, when you might end up with residual objects that don't programatically get removed from your chart, due to bugs or some other reason.
Q: Why use this script, when I can press Ctrl+B, list all objects, then manually select and delete each one? A: To save time, really. Maybe you have too many unwanted
FREE

--- StudentK Sync Chart --- 1. Move charts at the same time 2. Cross check among different Symbols and Timeframes 3. Plan your own trading strategies
=== Simple (Free) Version ===
1. Allow USDJPY only
2. Support M5 and M15
3. * Contact StudentK for unlocking all timeframes *
--- Context --- StudentK is not indicated as a master or K Sir for knowledgeable person who claims for winning all the time. (But lots of traders should know the fact that it is rarely truth, especially in fluctuat
FREE
Descrição do Indicador ATR (Average True Range) O indicador Average True Range (ATR) mede a volatilidade do mercado, calculando o tamanho médio das últimas barras, não considerando os gaps diários como o indicador nativo do MT5. Ajuste suas saídas com base na volatilidade. Principais Características: Ajuda a determinar níveis adequados de Stop Loss e Take Profit, baseados na volatilidade do ativo Configurável: multiplicador para stop loss e take profit
FREE

Harmonic patterns are characteristic series of price movements with respect to Fibonacci levels, which statistically precede price reversals. This indicator searches for harmonic patterns. It is capable of recognising 26 classical and non-classical harmonic patterns : Classical Gartley Butterfly Alternate Butterfly Bat Alternate Bat Crab Deep Crab Three Drives Non-classical Shark Alternate Shark Cypher 5-0 Anti Gartley Anti Butterfly Anti Alternate Butterfly Anti Bat Anti Alternate Bat Anti Crab

Simple alternate MACD version like the one used in tradingview. Two lines (MACD & signal line) and a histogram. This MACD version can be used in many different ways. Potential trades are the crossing of the MACD & signal line, the crossing of the MACD through the 0-line of the histogram, the MACD being under the 0-line of the histogram or the movement of the histogram itself. A combination of these potential signals on different timeframes can be very precise, but always needs additional confirm
FREE

Indicators are professional data statistics, position orders, historical order analysis->>>>>> <This version is in Chinese -> English version please move>
Necessary for traders: tools and indicators Waves automatically calculate indicators, channel trend trading Perfect trend-wave automatic calculation channel calculation , MT4 Perfect trend-wave automatic calculation channel calculation , MT5 Local Trading copying Easy And Fast Copy , MT4 Easy And Fast Copy , MT5 Local Trading copying For DE
FREE

This is Gekko's indicator of quotations and variations. It summarizes quotations and variations of the current symbol in different timeframes as well as other correlated symbols. Keep track of all this information on your chart while you are negotiating for decision making support. Input Parameters General Settings: configure which quotations and variations you want to keep track for current day, week, month or year as well as M1, M5, M15, M30, H1 and H4 charts; Symbols Configuration: add up to
FREE

The RFOC Symbol Background was created to display the name of the asset and the current timeframe in the background of the chart.
Displaying the name of the asset at the bottom of the chart is often used by traders who are designing the screen for spectators, making it easier to identify the asset and the timeframe during a class, for example.
It is available for the user to select the font size (small, medium or large) and select the color for better viewing according to the background colo
FREE

Q市价做空,W市价做多,E市价全部平仓。 持仓最大数量为1,即:禁止加仓。 ea的输入为手数,止损和最大滑点,不支持设置止盈。 专为短线吃一个小波段设计。 无论下单还是止损都会有提示声。 Q W E sell buy close
The Q key is short, the W key is long, and the E key is closed. The maximum number of positions is 1, i.e., it is forbidden to add positions. The EA's inputs are lots, stop loss and maximum slippage, and take profit is not supported. Designed for short-term swing trader. Play sound whenever position open or stoploss.
FREE

Universal Webhook is utility to send MT5 ORDER and TRANSACTION event
Compatible with any Webhook Server
Features:
Basic Auth Support Custom Authorization header support Custom Header Support Automatically Sends Webhook on OnTradeTransaction event. Automatically bring Trade Account information (configurable)
Specially made because of request from WebhookPrinter.com users, but feel free to use.
Sample Webhook Payload: { "event": " TRADE_TRANSACTION_ORDER_ADD ", "account": [ {
FREE

Title : Ultimate Oscillator - Multi-Timeframe Momentum Indicator Description : Overview : The Ultimate Oscillator is a powerful and versatile technical analysis tool developed by renowned trader Larry Williams. This indicator is specially designed to capture market momentum across three different timeframes, providing a comprehensive view of the market's dynamics. Unlike traditional oscillators, which are confined to a single timeframe, the Ultimate Oscillator integrates short-term, medium-term,
FREE

50% off. Original price: $60 Ichimoku Assistant is a multi-timeframe panel and alert system that scans all timeframes for multiple rules related to different ichimoku strategies. The Ichimoku indicator has 5 different lines, including Tenkan-sen, Kijun-sen, Senku Span A, Senku Span B and Chikou Span. This scanner checks the status of these lines compared to each other and gives alerts based on your selected rules. If you are using ichimoku kinko hyo in your trading strategy, this scanner and it

KDJ Index 4 交易实用必备工具指标 波浪自动计算指标,通道趋势交易 完美的趋势-波浪自动计算通道计算 , MT4版本 完美的趋势-波浪自动计算通道计算 , MT5版本 本地跟单复制交易 Easy And Fast Copy , MT4版本 Easy And Fast Copy , MT5版本 本地跟单复制交易 模拟试用 Easy And Fast Copy , MT4 模拟账号运行 Easy And Fast Copy , MT5 模拟账号运行 "Cooperative QQ:556024 " "Cooperation wechat:556024" "Cooperative email:556024@qq.com" 强烈推荐趋势指标, 波浪的标准自动计算 和 波浪的标准自动计算MT5版本
KDJ指标又叫 随机指标 ,是一种相当新颖、实用的技术分析指标,它起先用于期货市场的分析,后被广泛用于股市的中短期趋势分析,是期货和股票市场上最常用的技术分析工具。 随机指标KDJ一般是用于股票分析的统计体系,根据统计学原理,通过一个特定的周期(常为9日、9周等

The Commitments of Traders Ratio Indicator is one of these things you never thought about it before you really see the magic behind it. The indicator shows the Ratio of long/short positions released by the CFTC once a week.
If you have a look on the Sreenshot you can see two (three) zones of interest. Important note: MAs are not available in version 1.0. Zone 1: The Switches (Red -> Green, Green -> Red) Zone 2: MA cross Zone 3: If you combine this with the COX indicator an additional zone will
FREE

Calculates pivot levels. It paints the histogram depending on the location of prices relative to these levels.
Parameter values: style - select the type of display (Histogram, Line, Arrow) price - price, has little effect on the final look, but this can be customized timeframe - select a timeframe for calculating levels. color over pivot line - color of everything above the pivot level color under pivot line - color of everything below the pivot level pivot line intersection color - the color
FREE

M ulti Cross Alert! on your smartphone. Use multiple indicators to get a crossover signal on chart as well as on MetaTrader app. You can use all crossovers at the same time but it is not recommended cause your chart will look messy. Instead use combination of two indicators which will be better. IMP NOTE:- More indicators will be added in future updates. Any suggestions regarding indicators are welcome! Indicators List: 1. MA (Cross) 2. RSI (OB/OS) 3. MACD Lines (Main Line & Signal Line Cross)
FREE

Trading panel for manual trading. Has a fairly wide functionality. Allows you to automatically calculate the order size, open both market and pending orders. It has a wide range of options for closing orders, it is possible to partially close orders, close orders after reaching a certain profit or loss, separately close profitable and unprofitable, buy and sell, as well as pending orders. The panel also contains a simple implementation of a grid of pending orders, reverse and lock functions, tr
FREE

Indicador Regressão Linear – Par de Ativos - INTRADAY Indicador é um oscilador que faz o plot do Resíduo resultado da regressão linear entre os dois ativos inseridos como input do indicador, representado pela fórmula: Y = aX + b + R Onde Y é o valor do ativo dependente, X é o valor do ativo independente, a é a inclinação da reta entre os dois ativos, b é a intersecção da reta e R é o resíduo. O resíduo representa a quantidade da variabilidade que Y que o modelo ajustado não consegue explicar. E
FREE

エントリー前に確認できるチェックリストを作成しました。 以下のコードを参照してMT5用に作成しました。
Strategy Checklist - indicator for MetaTrader 4 https://www.mql5.com/en/code/18877
機能: チェックリスト20個まで入力できます。 表示位置 (左上 、 右上 、 左下 、 右下) の 指定 が可能 になります。 フォントサイズ の 変更が可能 になります。 チェックリストの幅を変更できます。 ドラッグ&ドロップでチェックリストを移動できます。
インストール方法: ファイル->データフォルダーを開く->MQL5フォルダー->Indicatorsフォルダー 配下にex5ファイルを置いてMT5を再起動してください。 チェックリストはマニュアルで入力が必要になります。入力後 保存しておいてください。 テンプレートで保存しておくと容易にチャートに適用できます。
FREE

TickChart Indicator plots tick line on the main window of MetaTrader.
In the Lite version, the number of ticks is limited to 20 and the alert function described below is omitted. The tick-line shows the most detailed, fastest and real-time activities of the market, which are usually hidden in bars or candles longer than 1 minute. Usually, several new tick-line segments appear while a bar of M1 time frame is completed. After the release of an important economic indicator, the number of ticks pe
FREE

This is a tool to estimate your probability of bankruptcy. features. estimate a probability of bankruptcy (Nauzer J. Balsara) from your trade history usually, it is small print and never interfere with trades alert in large prints and color when it exceed the alert level you can set parameters(i.e. winning ratio) fixed and simulate freely *1: this value is for reference only and is not guaranteed to occur.
FREE
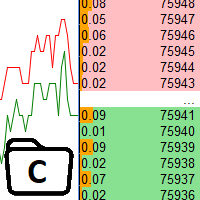
The utility is designed to control the update rate of the order book (or several) in the strategy tester. Management is carried out by a library, which is available here https://www.mql5.com/en/market/product/81400 Interface description: S/P Start and pause playback --- Decrease the speed by one step +++ Increase speed by one step R Updating the character list <0> Slider, moving left/right change the playback speed, after releasing the mouse it is restored to its original state. The
FREE

*Used by MeditionSeed EA. Meditation is a practice in which an individual uses a technique – such as mindfulness, or focusing the mind on a particular object, thought, or activity – to train attention and awareness, and achieve a mentally clear and emotionally calm and stable state.[1][2][3][4][web 1][web 2] Plant a Meditation Seed to have wonderful future.
FREE

The ShowSessions indicator for MT5 shows up to two, self-selected, time intervals, for a free choosen number of days past and a few future days. Weekends are marked with an additional red vertical line. The indicator makes manuel backtesting of strategies more easily, but you can use ist for daily trading as well. Please note that the server time does not always correspond to the actual time.
FREE

The Ultimate Trend and Reversals Detector The Ultimate Trend and Reversals Detector is a powerful tool designed to identify potential trend reversal zones in the financial markets. Here are the key features: Objective : Detect trend directions and reversals. Signal Colors : Green : Indicates a potential bullish trend reversal. Red : Signals a potential bearish trend reversal. Non-Repainting : The indicator’s signals are not redrawn, providing reliable information. Suitable for All Styles : Scal

MMD'nin Zaman Sonu çubuğu, seçilen üç aralıkta kalan saniye sayısını gösteren basit bir göstergedir. MMD metodolojisine göre yönlü bir fiyat hareketinin meydana geldiği an önemlidir. Bu gösterge, Forex ve Vadeli İşlem ticaretinde bu ilişkiyi daha etkin bir şekilde kullanmanızı sağlar.
İşlevsellik açıklaması:
Zaman Çerçevesi 1 Periyodu - ilk zaman aralığını tanımlama Zaman Çerçevesi 1 Renk - ilk zaman aralığı için rengi belirleme Zaman Çerçevesi 1 Periyodu - ikinci zaman aralığını tanımlar Z
FREE
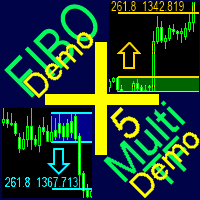
A ready-made multitimeframe trading system based on automatic plotting and tracking of Fibonacci levels for buying and selling any symbol. Demo version - calculation of the last 390 bars is not performed.
Advantages Determines the trend direction based on a complex of 14 indicators ( Cx ), extremums of ZigZag ( Z ), RSI ( R ), Impulse ( I ) Displaying the values of 14 indicators comprising the trend direction ( Cx ) Plotting horizontal levels, support and resistance lines, channels View the pl
FREE

Fractals Direction ST Patterns MT5 is a modification of Bill Williams' Fractals indicator, which allows you to specify any number of bars for finding a fractal. In the settings, it is also possible to set the number of points for determining the trend direction. The upward direction is determined if the last upper fractal is higher than the penultimate upper fractal. The downward direction is determined if the last lower fractal is lower than the penultimate lower fractal. This simple indicator
FREE
"AV Preview MT5" is an Expert Advisor designed to make it easier to view my MT5 demo indicators. Some of them need trades, which is why this EA carries out a few trades based on simple logic.
These indicators can be turned on or off:
- "AV Trade History MT5" (requires trades)
- "AV Grid MT5"
- "AV Monitor MT5" (requires trades)
- "AV Stop Hunter MT5"
- "AV SuperTrend MT5"
- "AV Donchian Channel MT5"
- "AV Forecast MT5"
Instructions:
- Download the desired demo indicators (a
FREE

Moving Average ******************* Moving Average для платформы секундных графиков Micro . ********************* Секундный график на порядок увеличит точность ваших входов и выходов. Секундный период , в привычном формате, позволит увидеть то, что ранее было скрыто. Бесплатные индикаторы, дополнят визуальную картину, что, в совокупности выведет вашу торговлю на новый уровень. Идеально подходит как скальперам, так и трейдерам торгующим внутри дня. Индикатор Moving Average для платформы Micr
FREE

Convenient information line on the chart.
Displays the cost of the point depending on the selected volume (selection in the settings) Displays a swap of short and long trades depending on the selected volume. Shows a triple swap and indicates the day of the week on which it is charged Displays the current spread for the current instrument Displays the remaining time until the next bar on the current timeframe. In the settings you can choose the color, font size, placement and volume.
FREE

Risk Optimizer is the absolute solution for applying risk management on your account. Bad risk management is the main reason that causes traders to lose money. Risk Optimizer calculates and suggests the correct lot size for each position according to your personal, customized risk profile. You can give directly your preferred risk as percentage (%) for each position or you can trust our algorithms to calculate and optimize according to your risk category selection. But it is not only that! Selec
FREE

!! FLASH SALE !! Over 80% off !! For ONE week only. Now only $47 - normally $297! >>> Ends on 30 June 2023 - Don't miss it!
Buy and Sell Arrows when price is about to retrace. It Also Sends Alerts – On MT5 To Your Phone To Your Email
Does not repaint.
Works ony any pair, any timeframe.
10 Activations allowed so you are free from limitations
See an example of alerts from today (23 May 2020) using this and 2 other indicators here .
MT4 Version here . Spreads from 0.1p

It is Test product Lorem ipsum dolor sit amet, consectetur adipiscing elit, sed do eiusmod tempor incididunt ut labore et dolore magna aliqua. Ut enim ad minim veniam, quis nostrud exercitation ullamco laboris nisi ut aliquip ex ea commodo consequat. Duis aute irure dolor in reprehenderit in voluptate velit esse cillum dolore eu fugiat nulla pariatur. Excepteur sint occaecat cupidatat non proident, sunt in culpa qui officia deserunt mollit anim id est laborum. Faucibus scelerisque eleifend donec
FREE

Utility for show on charts the visual informations about:
- a vertical line at start of each bar of selected timeframe
- a vertical line at start of each day
- a vertical line at start of each week
- vertical lines at start / end of trading sessions selected
- bid / ask prices, spread, money value for each point (of 1 standard lot) and last tick time recived"
You can enable / disable each information and set the color for each line
FREE

Tam otomatik çoklu para birimi uzmanı. Konumların ortalaması alınır. Ticaret sistemlerinin oluşturulmasında istikrar ve sürdürülebilirliğe yeni ve benzersiz bir yaklaşım. Ayar gerektirmez ve karmaşık eylemler gerektirmez. Uzmanı eurusd h1 programına ayarlamanız ve gerekirse para yönetimi rejiminizi değiştirmeniz yeterlidir. İstikrar, karlılık ve kullanım kolaylığı bu ticaret robotunun temel ilkeleridir. Riskten korunma imkanı olan bir hesap türü kullandığınızdan emin olun. 100'den itibaren kaldı
MetaTrader platformunun uygulama mağazası olan MetaTrader Mağazadan bir ticaret robotunun nasıl satın alınacağını öğrenin.
MQL5.community ödeme sistemi, PayPal, banka kartları ve popüler ödeme sistemleri aracılığıyla yapılan işlemleri destekler. Daha iyi bir müşteri deneyimi için satın almadan önce ticaret robotunu test etmenizi şiddetle tavsiye ederiz.
Ticaret fırsatlarını kaçırıyorsunuz:
- Ücretsiz ticaret uygulamaları
- İşlem kopyalama için 8.000'den fazla sinyal
- Finansal piyasaları keşfetmek için ekonomik haberler
Kayıt
Giriş yap
Gizlilik ve Veri Koruma Politikasını ve MQL5.com Kullanım Şartlarını kabul edersiniz
Hesabınız yoksa, lütfen kaydolun
MQL5.com web sitesine giriş yapmak için çerezlerin kullanımına izin vermelisiniz.
Lütfen tarayıcınızda gerekli ayarı etkinleştirin, aksi takdirde giriş yapamazsınız.