İş tamamlandı
İş Gereklilikleri
I have an indicator on the MQL5 Marketplace that draws market imbalances on the chart in either a red (short imbalance)or blue line (long imbalance). Every timeframe has different market imbalances and they are distinctive to that timeframe because of the way the candles are formed and which ATR values are calculated by the indicator. What I was needing done, if possible, is the option to show current higher timeframe imbalances on a lower timeframe? I only need the option to show 1 hour, 4 hour,and daily
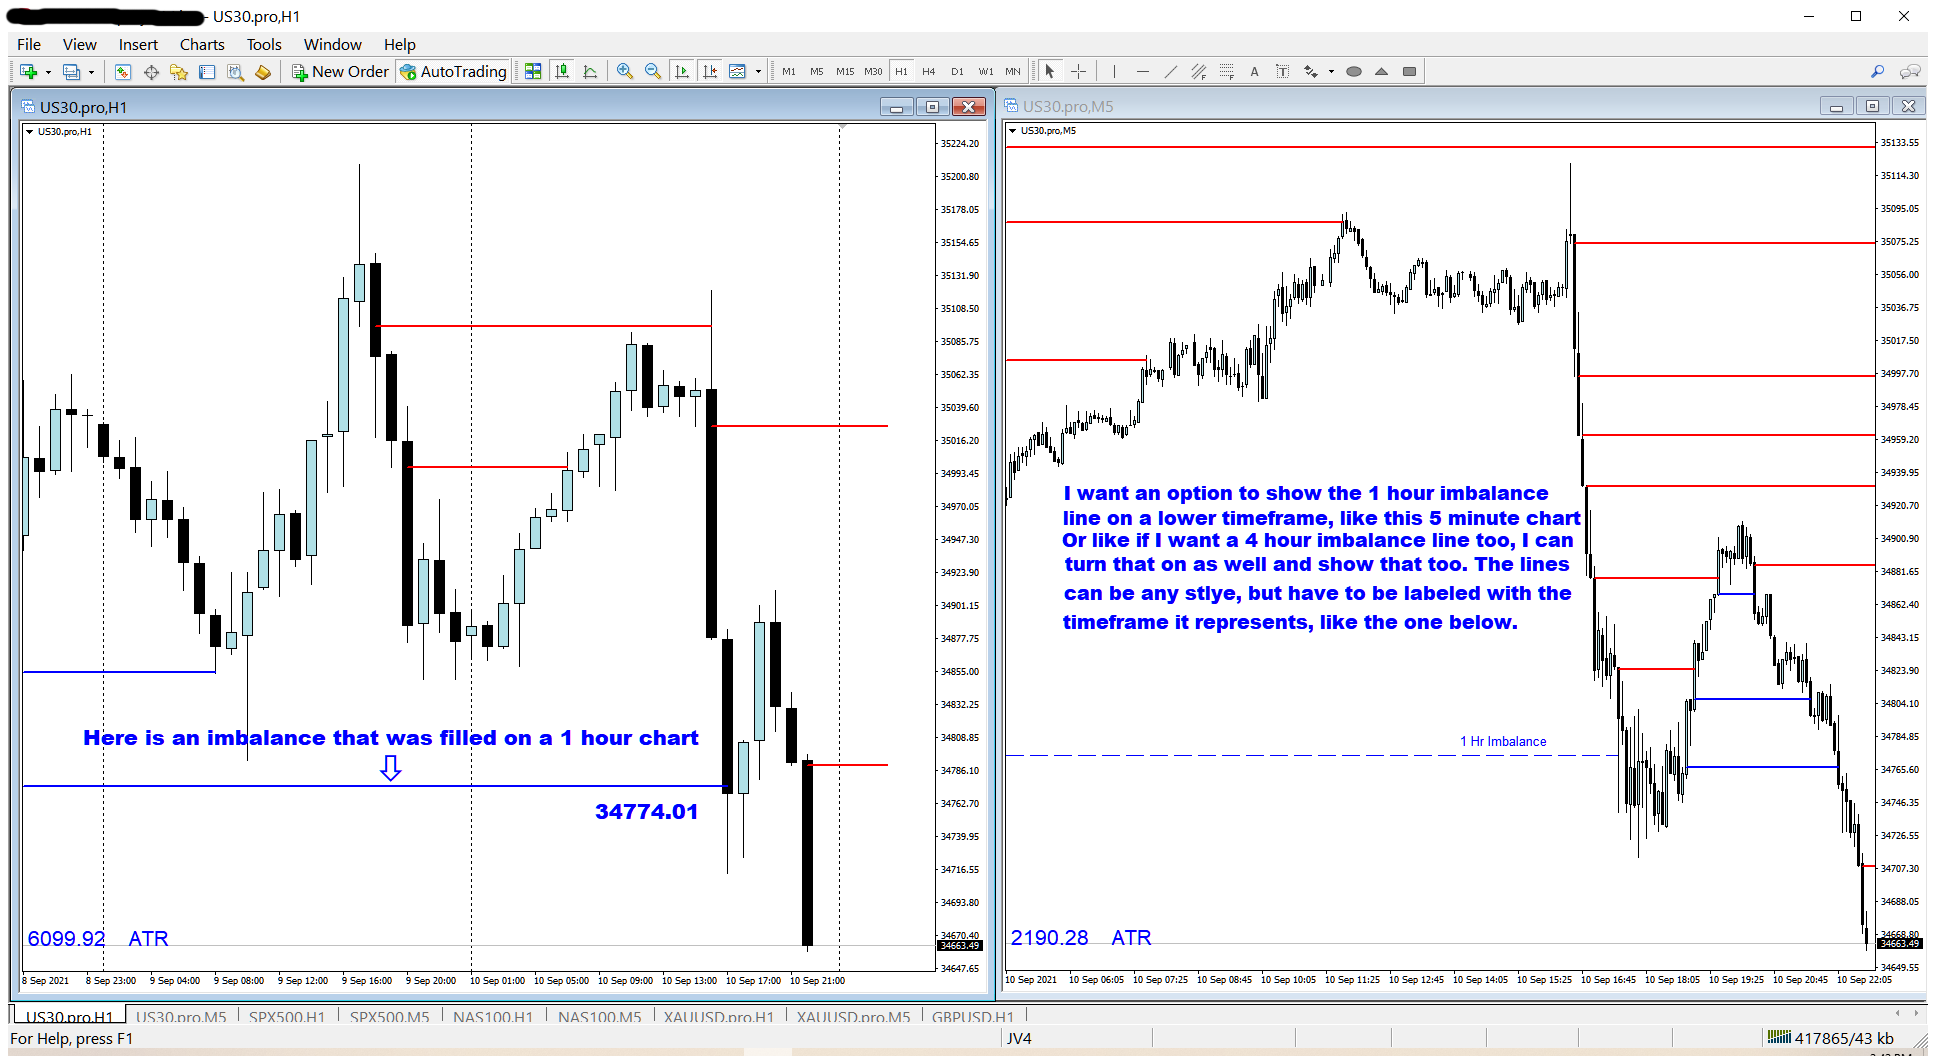
Here is an example below. Say I want to show the market imbalances from a 1 hour timeframe on a 5 minute chart? On the US30 today, a market imbalance was filled on the 1 hour chart on the left @34774.01 (Blue line). When going to a 5 minute chart, that 1 hour market imbalance line is not drawn. I've drawn a dotted line on the 5 minute chart which would've shown me where that higher timeframe market imbalance is.
I would like to add options in the inputs to turn on or off those higher timeframe imbalance lines. The lines are defaulted in the form of a dotted line, labeled with the timeframe it represents (ie: 1 hour, 4 hour, etc.). I can have the option to turn on whatever timeframe I choose and pick whatever line style I want. When showing those lines on the lower timeframe, the lines can extend, but when price touches the line it must terminate at that candle, similar to the original indicators normal functionality. I only would like 30 Minute and up timeframes to be added. Mainly because I trade on the 15 minute and lower timeframes in my daily trading. Also , I was wondering how difficult is this to convert to MT5?