Fan sayfamıza katılın
Öyleyse bir link gönderin -
başkalarının da faydalanmasını sağlayın
- Görüntülemeler:
- 644
- Derecelendirme:
- Yayınlandı:
- 2024.09.22 12:01
-
 Ticaret fırsatlarını kaçırıyorsunuz:
- Ücretsiz ticaret uygulamaları
- İşlem kopyalama için 8.000'den fazla sinyal
- Finansal piyasaları keşfetmek için ekonomik haberler
Kayıt Giriş yapGizlilik ve Veri Koruma Politikasını ve MQL5.com Kullanım Şartlarını kabul edersiniz
Hesabınız yoksa, lütfen kaydolun -
 Bu koda dayalı bir robota veya göstergeye mi ihtiyacınız var? Freelance üzerinden sipariş edin
Freelance'e git
Bu koda dayalı bir robota veya göstergeye mi ihtiyacınız var? Freelance üzerinden sipariş edin
Freelance'e git
Indicator Description: PTB.mq5
- Overview:
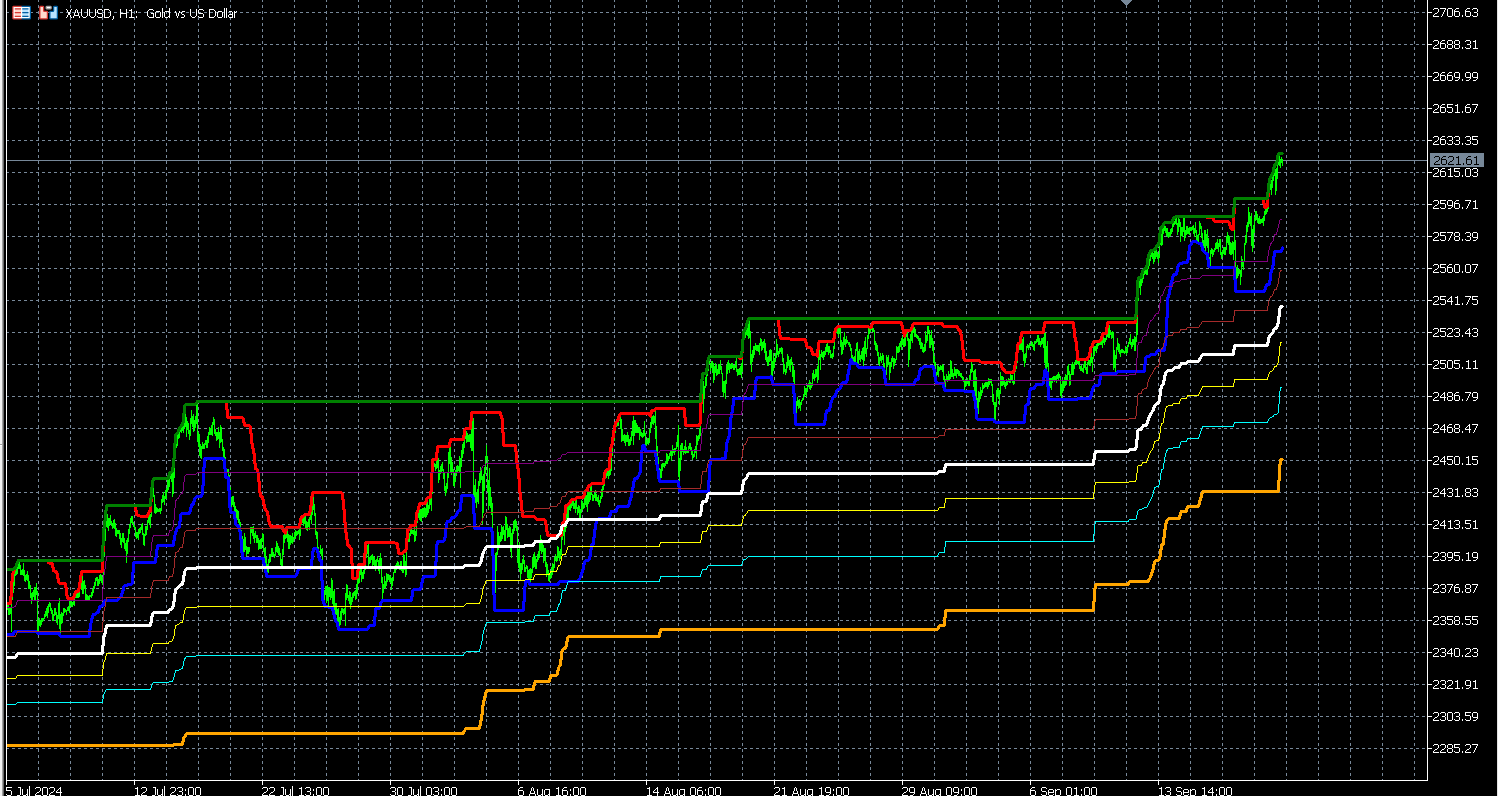
- Features:
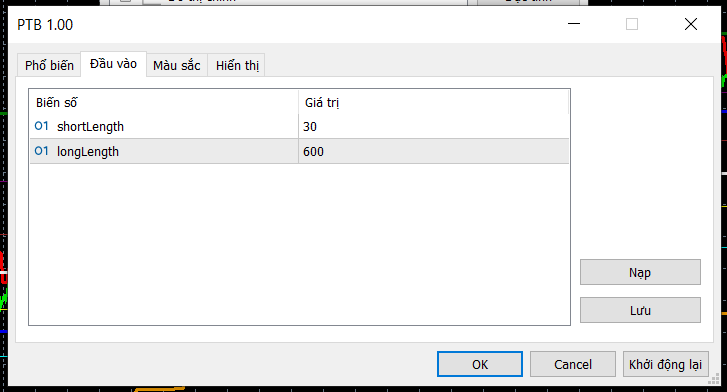
- Input Parameters:
- Visual Representation:
- Calculation Logic:
 Code To Check And Delete Chart Objects For MT5
- The script scans through the current chart for any available chart objects, - Counts and delete them accordingly - And log the the names of the objects on the chart respectively.
 ChartObjectsCopyPaste
Copy and paste selected graphical objects between charts via Windows clipboard as text. Use Ctrl+Q on a source chart, then Ctrl+J on a target chart.
 Logging V2 for both MQL4 and MQL5
The CDebugLogger class is a flexible and comprehensive logging utility designed for use in MQL4/5 environments. It allows developers to log messages at various levels of importance (INFO, WARNING, ERROR, DEBUG) with options to include timestamps, function signatures, file names, and line numbers in the log entries. The class supports logging to both the console and files, with the ability to save logs in a common folder and in CSV format. Additionally, it offers functionality to silence logs based on specific keywords, ensuring that sensitive information is not logged. This class is ideal for developers looking to implement robust logging mechanisms in their MQL4/5 applications, with customizable features that cater to a wide range of debugging and monitoring needs.
Position Risk Calculation Tool
An indicator that dynamically calculates risk (in percentages and money) based on the lot size and stop loss