• Обзор
  • Отзывы (10)
  • Обсуждение (44)
  • Что нового

Trend Reversal MT4

5

** All Symbols x All Timeframes scan just by pressing scanner button **

*** Contact me to send you instruction and add you in "Trend Reversal group" for sharing or seeing experiences with other users.

Introduction:

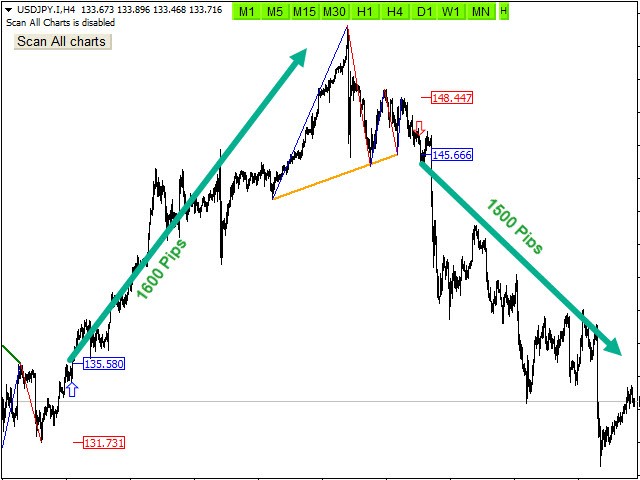
Trendlines are the most famous technical analysis in trading. Trend lines continually form on the charts of markets across all the different timeframes providing huge opportunities for traders to jump in and profit on the action. In the other hand, The trend line reversal strategy has high win rate on the price action in the market that let You catch the big fish at the edge of the waterfall.

The Trend Reversal indicator Scans All charts just by pressing one click. It has stop loss,  take profits and entry point levels with using Fibonacci levels and candlestick checking to find the best entry and exit points of trading. It finds signals immediately with alarm and notification for easy trading. It is included powerful Three Drives or 5W pattern based on RTM concepts.

Main Features:

  • Detect the best and most common successful point of reversal trend
  • Easy-to-use and user-friendly indicator
  • NO repaint
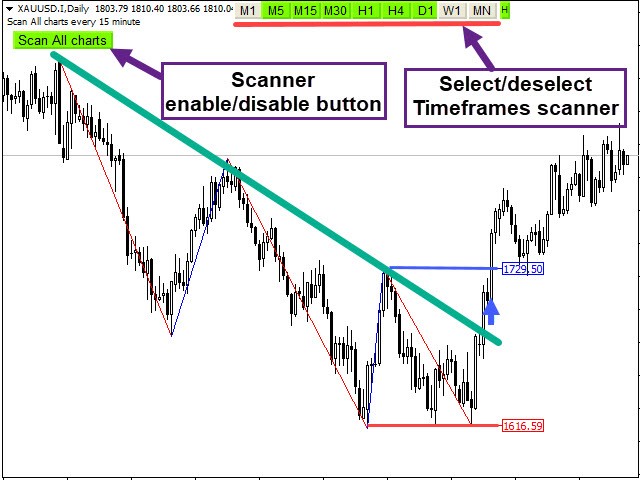
  • Scan All charts button ( Forex, Crypto, Indices and commodities )
  • Select and deselect time frames button for scan (M1,M5,M15,M30,H1,H4,D1,W1,MN)
  • It displays and pushes notification stop-loss, entry-point and take-profit levels
  • Real Statistics Dashboard
  • Candlestick check for the best entry point
  • Use Fibonacci levels
  • Sending the alert and push notification
  • Alert enable/disable base on your setting time
  • Adjust the pattern setting
  • Risk to Reward : at least 1:2

Input Parameters :

=========Scanner============

  • Scan All Charts – Enable
  • Scan the number of candles – Amount of history bars to evaluate
  • Re-scan Timer – Re-scan all charts in all time frames after passing time
=======Display/style Options============
  • Display Options – Display or do not  SL, Entry and TP levels
  • Statistics dashboard - Display or do not display Statistics dashboard
  • Stop Loss levels and Breakout Style - Set the Fonts and colors of patterns

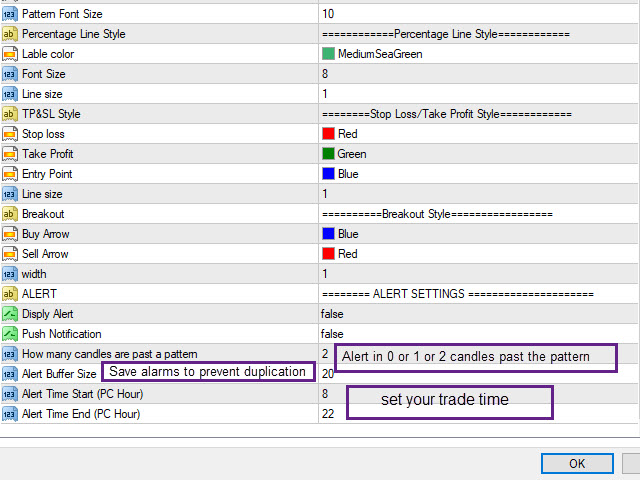
    ========ALERT SETTINGS ==========

    • Display Alert or Push Notification – Enable or disable Alert or Push Notification
    • How many candles are past a pattern – Maximum Number of candles Passed from a pattern to allow alert
    • Alert Buffer Size – Maximum save alert to prevent duplicate alerts
    • Alert start/end time  – Determine trading hours based on the computer clock to activate and deactivate the alarm
    Отзывы 10
    JAM T
    944
    JAM T 2024.07.19 21:40 
     

    Another good indicator and the notifications ... it's perfect!

    Nguyen Do Anh Quang
    211
    Nguyen Do Anh Quang 2024.05.25 08:50 
     

    I have purchased many products from him. I looked for a good entry every time I entered a trade. I am applying checking multi-timeframe strategy for better results

    asahi0808
    170
    asahi0808 2024.01.07 05:44 
     

    I am satisfied with this products and his quick resoponse!!

    Рекомендуем также
    This Indicator will notified you when market going to trend reversal, build with candlestick pattern strategy  --> Sell Reversal Notification will flag with the Yellow arrow --> Buy Reversal Notification will flag with the Pink arrow After Flag Appear, the market usually reverse but carefully you must performs double check because weakness of this indicator when market in the middle of the trend
    This indicator shows in a subwindow the trend in M1, M5, H1, D1 timeframes based on MA, MACD, Stochastic This way you could see in once in different timeframes what happening.  This is my first free indicator. Please follow I will put here some more. Thank you for you attention.  . . . . . lfknglkslksnlgslgnsflgjrpoesv ,msv lkrjpfjésmdg sd.npo4wsmdglknsp4jwpkeégmfs.lkmp Thank you
    FREE
    The Rise of Sky walker   is a trend indicator is a powerful indicator for any par and any timeframe. It doesn't requires any additional indicators for the trading setup.The indicator gives clear signals about opening and closing trades.This Indicator is a unique, high quality and affordable trading tool.  Can be used in combination with other indicators Perfect For New Traders And Expert Traders Low risk entries. Never repaints signal. Never backpaints signal. Never recalculates signal. Great F
    Ichimotor
    Vijaya Kumar Hegde
    5 (1)
    Трендовый пользовательский индикатор Ichimotor сочетает в себе Ichimoku Cloud и Alligator Особенности Тренд-следящий индикатор Не перерисовывается Нет ложных сигналов Работает на всех таймфреймах Применим для работы с Форекс-парами, индексами и акциями Входные параметры Show Indicator after Testing : отображать индикатор после тестирования, True/False Sound an alert : использовать звуковые сигналы, True/False Send an email : отправлять уведомления по электронной почте, True/False Send a noti
    ** All Symbols x All Timeframes scan just by pressing scanner button ** *** Contact me  to send you instruction and add you in "RSI scanner group" for sharing or seeing experiences with other users. Introduction RSI divergence is a main technique used to determine trend reversing when it’s time to sell or buy because prices are likely to drop or pick in the charts. The RSI Divergence indicator can help you locate the top and bottom of the market. This indicator finds Regular divergence for pu
    Would you like to learn a technical system refined by centuries of use, but virtually unknown here? A system so versatile that it can be fused with any other indicator/technical tool? A system as pleasurable to use as it is powerful? If so, this indicator which scans candlestick charting techniques is for you. You should find it valuable no matter what your background in technical analysis. This trading system has been designed after years of hard work and back testing. Indicator will find stro
    MAD - Moving Average Distance The MAD Indicator uses ATR and the distance to a moving average to determine if price has the potential for mean reversion.  Works on all time frames and pairs. It will only check for the condition at the beginning of a new candle so it doesn't repaint.  A signal will include an arrow on the chart, alert popup and cell phone notification. Settings: ATR_Multiplier: Multiplier of ATR for the calculation. (Recommended: 5) MA_Period: Moving Average Period to use (EMA
    This indicator is designed for trend trading and it helps in determining the best entry points. To identify the points, it is necessary to follow the signal line. Once the line crosses the zero level upwards - buy, and when it crosses downwards - sell. In addition to the signal line, the indicator also displays the so-called market "mood" in real time in the form of a histogram. The indicator works on all timeframes and with all instruments. The indicator operation required the Moving Average in
    Система анализа индикаторов ZhiBiJuJi использует мощный внутренний цикл для вызова собственных внешних индикаторов, а затем вызывает анализ до и после цикла. Расчет данных этой системы анализа индикатора очень сложен (вызов до и после цикла), поэтому гистерезис сигнала уменьшается, и достигается точность предварительного прогноза. Этот индикатор может использоваться во всех циклах на МТ4 и наиболее подходит для 15 минут, 30 минут, 1 часа, 4 часов. Купить:        Когда появляется линия пурпурный
    FIBO DASHBOARD This dashboard lists down multi currency Fibonacci level  whenever price hit the level. It draws a Fibonacci Retracement based on daily time frame. It draws arrows, sends pop-up alert  and phone notification whenever price crosses Fibonacci levels. This tool is useful for users who trade with Fibonacci. INPUT ON Alert: set to true will pop-up alert whenever arrow appears. ON Push: set to true will send phone notification whenever arrow appears. ON Email:set to true will send email
    This indicator draws the prior Highs and Lows for multiple timeframes, and can display potential Take Profit and Stop Loss levels. In Rob Smith's # The Strat   terms,   these are potential entry points, or alternatively potential targets for open positions. I like to use them in both ways. On a lower timeframe, say 5 minutes to get a good entry on a daily or weekly level, and then as a potential target. Very small stops required giving an excellent risk/reward ratio. Please watch the DEMO video
    Индикатор ищет один из наиболее эффективных свечных паттернов разворота - Three Line Strike (прорыв трех линий). По словам автора бестселлера и свечного гуру Томаса Булковски, паттерн приносит прибыль в 65-84% случаев . Индикатор сканирует до 30 инструментов (форекс, индексы и товары) на 8 таймфреймах. Вы можете получать алерты в самом терминале или по электронной почте при обнаружении паттерна Three Line Strike. Внимание: Чем крупнее таймфрейм, тем надежнее сигналы. Сигнал срабатывает, если све
    Ultra Arrows Scalper Pro   Ultra Arrows Scalper pro  индикатор для эффективнoй торговли бинарными опционами  -----------полное отсутствие перерисовки-----------...……... Cтрелка формируэтся на текущей свечи и указывает направление следующей свечи и возможного направления тренда в дальнейшем. Входить в сделку стоит на следующей свече. его преимущества:  точность сигналов. полное отсутствие перерисовки.  Вы сможете выбрать абсолютно любой инструмент. индикатор обеспечит множество прибыльных и точны
    TrendScanner XTra scans market trends from Multi Symbols and Multi Timeframes with extra additional Entry Point Signals arrow on the current chart. Features: -Entry Point SIgnals :  This is additional feature in the indicator. No repaint arrows. The Trading system in the single indicator. MTF Trend informations and Entry Signals. In order to make it easier for trader to get trading moments from a single chart and  deciding entry time.  -Changeable Panel Display :  Change the value of Max.Symbo
    This indicator shows Linear Regression Line and it's channels which calculated with fibo numbers. You can use this indicator in different timeframes on your chosen timeframe chart. You only need to attach this indicator on the chart twice or more with a different colors to do this.  There are 6 input parameters; period      : you can choose regression timeframe independent of chart timeframe. linewidth : width of line on the chart. bars back regression begin : calculated regression bar count. LR
    Some informations on the chart with the single attachment. RangeBorder Buy Sell (RBBS) Non Repaint Indicator will provide trend line, buy sell arrows,reversal arrows, range channel, order exit area,high average price line and low average price line.All arrows and lines don't repaint and not lagging. Once candle closed it won't  repaint. Reading Indicator: 1. Small Stars , Indicates oversold and overbought with certain logic and price may reverse when this small star triggers. Useful to identif
    Marker Bands
    Ramon Sobrevals Arce
    4 (1)
    Этот индикатор состоит из двух разных алгоритмов, чтобы получать прибыль от всех быстрых движений, возникающих во время шума на рынке. Прежде всего, он строит нормализованные полосы тренда, чтобы отфильтровать возможные сделки. Нормализованные полосы тренда вычисляются с использованием эксклюзивного математического алгоритма, чтобы иметь как правильный тренд, так и быструю адаптируемость к изменению тренда. С помощью этих полос вы можете узнать, когда вы находитесь внутри тренда, а когда -
    What you get upon purchase: -Lifetime support for the use of the system - Easy to use, clean user friendly interface with no single settings required - Arrow Signals showing where to buy and sell -Visual Arrows, Sound Alert, Email and sms alert functionalities - Customizable colors and sizes -Lifetime Updates - Both Trend and breakout signals -Appropriate signals for both Entry levels, Take profit levels and stop loss   Preferred timeframe is 15 MINUTES ACCURATE SIGNALS WITH SIMPLE AND USER
    Индикатор тренда Global Trend , показывает сигналы для входа. Отображает как точки входа, так и сам тренд. Показывает статистически рассчитанные моменты для входа в рынок стрелками. При использовании индикатора можно оптимально распредилить коеффициент риска. Настройки: Использует все один параметр для настроек. Подбирая параметр необходимо визуально подобие так чтоб насоответствующем графике была отмальная проекция экстремумов. Параметры: Length - количеств баров для рассчета индикатор
    Ma Multi
    Dmitriy Susloparov
    5 (3)
    Это полностью мультифреймовый вариант стандартного индикатора " скользящая средняя ", комфортно и без ограничений работающий для любой комбинации таймфреймов. Индикатор позволяет быстро и без хлопот увидеть графики с различных таймфреймов одновременно. Вы можете создать любой набор интервалов, и свободно переключаться в старшую или младшую сторону. При этом выбранные Вами графики всегда будут отображаться в правильном масштабе времени. Взаимодействие краткосрочных и долгосрочных трендов будет оч
    Trend Power
    Pavel Zamoshnikov
    4.43 (7)
    Очень мощный инструмент, анализирующий направление и силу тренда 8-ми основных мировых валют: EUR, GBP, AUD, NZD, CAD, CHF, JPY, USD – как в реальном времени, так и на исторических данных. Индикатор дает звуковой сигнал и сообщение при смене тренда. Сигналы не перерисовываются. Сила тренда рассчитывается по всем парам, в которые входят эти валюты (всего 28 пар) может принимать значения от 0 до 6 на бычьем тренде, и от 0 до -6 на медвежьем тренде. Таким образом, вы никогда не пропустите хорошее д
    Интеллектуальный алгоритм индикатора  Variator  с точностью генерирует входные сигналы и уровни выхода. Если среднее значение цены синее, вам следует искать точки входа для открытия длинных позиций, когда рынок не перекуплен, а если среднее значение цены красное, вам следует искать точки входа для открытия коротких позиций, когда рынок не перепродан. Правила могут быть сведены к следующим. Следует покупать во время восходящего тренда, когда цена достигает среднего значения или перепроданности, и
    Dynamic SR Trend Channel Dynamic SR Trend Channel is a simple indicator for trend detection as well as resistance/support levels on the current timeframe. It shows you areas where to expect possible change in trend direction and trend continuation. It works with any trading system (both price action and other trading system that use indicators) and is also very good for renko charting system as well. In an uptrend, the red line (main line) serves as the support and the blue line serves as the
    «Trend reversal ml4» – это уникальный индикатор, разработанный для определения моментов разворота цены в первое время. Это уже готовая торговая система для Metatrader4. Индикатор не перерисовывает свои значения! На основе продвинутых алгоритмов и технического анализа этот индикатор дает вам сигналы о возможных точках входа и выхода на рынок, помогая вам принимать обоснованные решения. Преимущества индикатора: высокая точность сигналов. Индикатор сам показывает трейдеру, правильно ли он настро
    MT5 версия -  https://www.mql5.com/ru/market/product/70171 В отличие от других индикаторов подобного типа, данная версия обладает: Возможностью отображения данных из более мелких таймфреймов на текущем графике. Например, отображение данных из M1 периода на графике H1. Расчет значений по формуле Гаусса (формула нормального распределения). Гибкой системой настроек. Настройки: basePeriod - базовый период. indicatorMode  - режим отображения. Задает величину каждого интервала: by4h (4 часа), by6h (6
    "Сражения между быками и медведями продолжают влиять на поведение цены задолго после их окончания. Следы этих сражений могут использоваться в техническом анализе для управления рисками и поиска торговых возможностей. Используйте "трендовое зеркало" ("trend mirror") для изучения областей волатильности и влияния предыдущего движения цены на текущий тренд, когда цена разворачивается и пересекает данные уровни." - Investopedia.com RSI Mirrors and Reflections – надежный индикатор, применяющий многочи
    Индикатор показывает зоны перекупленности и перепроданности. Зоны можно регулировать уровнями, задать в настройках. Настройки: Period_I - период усреднения для вычисления индикатора; Applied_Price - используемая цена; Percent_Coefficient - процентный коэффициент; Count_Bars - количество баров для отображения индикатора; Overbought_level - уровень зоны перекупленности; Oversold_level - уровень зоны перепроданности; Overbought_color - цвет зоны перекупленности; Oversold_color - цвет зоны перепрода
    buy sell star indicator has a different algoritms then up down v6 and buy sell histogram indicators. so that i put this a another indicator on market. it is no repaint and all pairs and all time frame indicator. it need minimum 500 bars on charts. when  the white  x sign on the red histogram that is sell signals. when the white x sign on the blue  histogram that is sell signals. this indicator does not guarantie the win.price can make mowement on direction opposite the signals. this is multi tim
    Trend surfer is indicator based on volume calculation in combination with algorithm that recognize trend changes . For aditional filtering, user can choose from 3 different oscillators, or can use their combination. Basic idea of indicator is to give signal when current volume is above value defined as Volume MA period*Volume MA multiplier, and trend change algorithm detects start of new trend wave. When all conditions are met and new trend wave is detected, indicator plot arrow on chart. Arrows
    Closing Average Это совершенно новый индикатор в техническом анализе он основан исключительно на математическом рассчёте о сигналах в ходить в сделку на buy стоит тогда когда цена пересекла линию индикатора с низу в верх и он находится под ценой входить в сделку на sell стоит когда цена находится под линией индикатора Это авторская разработка он не исаользует в своем анализе ни каких индикоторов технического анализа
    С этим продуктом покупают
    Gann Made Easy - это профессиональная, но при этом очень простая в применении Форекс система, основанная на лучших принципах торговли по методам господина У.Д. Ганна. Индикатор дает точные BUY/SELL сигналы, включающие в себя уровни Stop Loss и Take Profit. Пожалуйста, напишите мне после покупки! Я поделюсь своими рекомендациями по использованию индикатора. Также вас ждет отличный бонусный индикатор в подарок! Вероятно вы уже не раз слышали о торговли по методам Ганна. Как правило теория Ганна от
    Прежде всего стоит подчеркнуть, что этот торговый индикатор не перерисовывается, не перерисовывает и не отставает, что делает его идеальным как для ручной, так и для роботизированной торговли. Руководство пользователя: настройки, вводы и стратегия. Атомный аналитик - это индикатор ценового действия PA, который использует силу и импульс цены, чтобы найти лучший край на рынке. Оборудованный расширенными фильтрами, которые помогают убирать шумы и ложные сигналы, и повышают торговый потенциал. Испо
    Enigmera
    Ivan Stefanov
    5 (3)
    ЭНИГМЕРА: ядро рынка https://www.enigmera.com Введение Этот индикатор и торговая система представляют собой удивительный подход к финансовым рынкам. ENIGMERA использует фрактальные циклы для точного расчета уровней поддержки и сопротивления. Он показывает подлинную фазу накопления и дает направление и цели.  Система, которая работает независимо от того, находимся ли мы в тренде или в коррекции.  Как она работает? ENIGMERA состоит из трех линий: линии поддержки/сопротивления, линии цели и ли
    Trend Punch
    Mohamed Hassan
    4.95 (19)
    This indicator is unstoppable when combined with our other indicator called  Support & Resistance . After purchase, send us a message and you will get it   for  FREE as a BONUS! Introducing Trend Punch , the revolutionary forex trend indicator that will transform the way you trade! Trend Punch is uniquely designed to provide precise buy and sell arrows during strong market trends, making your trading decisions clearer and more confident. Whether you're trading major currency pairs or exotic sym
    Trend Screener
    STE S.S.COMPANY
    4.8 (87)
    Индикатор тренда, революционное уникальное решение для торговли и фильтрации тренда со всеми важными функциями тренда, встроенными в один инструмент! Это 100% неперерисовывающийся мультитаймфреймный и мультивалютный индикатор, который можно использовать на всех инструментах/инструментах: форекс, товары, криптовалюты, индексы, акции. ПРЕДЛОЖЕНИЕ ОГРАНИЧЕННОГО ВРЕМЕНИ: Индикатор скринера поддержки и сопротивления доступен всего за 50$ и бессрочно. (Изначальная цена 250$) (предложение продлено) Tre
    Инновационный индикатор, использующий эксклюзивный алгоритм для быстрого и точного определения тренда. Индикатор автоматически рассчитывает время открытия и закрытия позиций, а также подробную статистику работы индикатора на заданном отрезке истории, что позволяет выбрать наилучший торговый инструмент для торговли. Вы также можете подключить свои пользовательские стрелочные индикаторы к Scalper Inside Pro для проверки и расчета их статистики и прибыльности. Scalper Inside PRO (версии 6.5 и выше)
    INSTRUCTIONS     RUS   -    ENG                    Рекомендуем использовать с индикатором -   TPSpro  TREND PRO -  Version MT5 Важным ключевым элементом в трейдинге являются зоны или уровни, от которых принимаются решения о покупке или продаже торгового инструмента. Несмотря на попытки крупных игроков скрыть свое присутствие на рынке, они неизбежно оставляют следы. Наша задача заключалась в том, чтобы научиться находить эти следы и правильно их интерпретировать. Основные функции: Отображения ак
    Dynamic Forex28 Navigator — инструмент для торговли на рынке Форекс нового поколения. В НАСТОЯЩЕЕ ВРЕМЯ СКИДКА 49%. Dynamic Forex28 Navigator — это эволюция наших популярных индикаторов, объединяющая мощь трех в одном: Advanced Currency Strength28 Indicator (695 отзывов) + Advanced Currency IMPULSE with ALERT (520 отзывов) + CS28 Combo Signals (бонус). Подробности об индикаторе https://www.mql5.com/en/blogs/post/758844 Что предлагает индикатор Strength нового поколения?  Все, что вам нрав
    TPSproTREND PrO
    Roman Podpora
    4.79 (19)
    TPSpro TREND PRO   —  трендовый индикатор, который автоматически анализирует рынок и предоставляет информацию о тренде и каждой его смене а также дающий сигналы для входа в сделки без перерисовки! Индикатор использует каждую свечу, анализируя их отдельно. относя к разным импульсам – импульс вверх или вниз. Точные точки входа в сделки  для  валют, крипты, металлов, акций, индексов! Version MT5           ПОЛНОЕ ОПИСАНИЕ ИНДИКАТОРА           Рекомендуем использовать с  индикатором -  RFI LEVELS
    Получайте ежедневную информацию о рынке с подробностями и скриншотами через наш утренний брифинг здесь, на mql5 , и в Telegram ! FX Power MT4 NG - это новое поколение нашего популярного измерителя силы валют FX Power. Что же предлагает этот измеритель силы нового поколения? Все, что вы любили в оригинальном FX Power ПЛЮС Анализ силы GOLD/XAU Еще более точные результаты расчетов Индивидуально настраиваемые периоды анализа Настраиваемый предел расчета для еще более высокой производительности Спец
    В настоящее время скидка 20%! Лучшее решение для новичка или трейдера-эксперта! Эта приборная панель работает на 28 валютных парах. Он основан на 2 наших основных индикаторах (Advanced Currency Strength 28 и Advanced Currency Impulse). Он дает отличный обзор всего рынка Forex. Он показывает значения Advanced Currency Strength, скорость движения валюты и сигналы для 28 пар Forex на всех (9) таймфреймах. Представьте, как улучшится ваша торговля, когда вы сможете наблюдать за всем рынком с пом
    MetaBands M4
    Vahidreza Heidar Gholami
    5 (2)
    MetaBands использует мощные и уникальные алгоритмы для построения каналов и обнаружения тенденций, чтобы предоставлять трейдерам потенциальные точки для входа и выхода из сделок. Это индикатор канала плюс мощный индикатор тенденций. Он включает различные типы каналов, которые могут быть объединены для создания новых каналов, просто используя параметры ввода. MetaBands использует все типы оповещений, чтобы уведомлять пользователей о событиях на рынке. Особенности Поддерживает большинство алгоритм
    TrendMaestro
    Stefano Frisetti
    5 (3)
    note: this indicator is for METATRADER4, if you want the version for METATRADER5 this is the link:  https://www.mql5.com/it/market/product/108106 TRENDMAESTRO ver 2.4 TRENDMAESTRO recognizes a new TREND in the bud, he never makes mistakes. The certainty of identifying a new TREND is priceless. DESCRIPTION TRENDMAESTRO identifies a new TREND in the bud, this indicator examines the volatility, volumes and momentum to identify the moment in which there is an explosion of one or more of these data a
    Прежде всего стоит подчеркнуть, что этот Торговый Инструмент является Неперерисовывающимся Нерепейнтинговым Индикатором, что делает его идеальным для профессиональной торговли. Онлайн-курс, руководство пользователя и демонстрация. Индикатор Концепций Умного Действия Цены - очень мощный инструмент как для новичков, так и для опытных трейдеров. Он объединяет более 20 полезных индикаторов в одном, комбинируя передовые торговые идеи, такие как анализ Inner Circle Trader и стратегии торговли конц
    Scalper Vault — это профессиональная торговая система, которая дает вам все необходимое для успешного скальпинга. Этот индикатор представляет собой полную торговую систему, которую могут использовать трейдеры форекс и бинарных опционов. Рекомендуемый тайм фрейм М5. Система дает точные стрелочные сигналы в направлении тренда. Она также предоставляет вам сигналы выхода и рассчитывает рыночные уровни Ганна. Индикатор дает все типы оповещений, включая PUSH-уведомления. Пожалуйста, напишите мне после
    СЕЙЧАС СКИДКА 31% !!! Лучшее решение для новичка или трейдера-эксперта! Этот индикатор является уникальным, высококачественным и доступным торговым инструментом, поскольку мы включили в него ряд собственных функций и секретную формулу. Всего на ОДНОМ графике он выдает алерты по всем 28 валютным парам. Представьте, как улучшится ваша торговля, ведь вы сможете точно определить точку запуска нового тренда или возможность скальпирования! Построенный на новых базовых алгоритмах, он позволяет е
    Matrix Arrow Indicator MT4
    Juvenille Emperor Limited
    5 (3)
    Индикатор Matrix Arrow MT4 — это уникальный индикатор тренда 10 в 1, следующий за 100% неперерисовывающимся индикатором с несколькими таймфреймами, который можно использовать на всех символах/инструментах: форекс, товары, криптовалюты, индексы, акции.  Индикатор Matrix Arrow MT4 будет определять текущую тенденцию на ранних этапах, собирая информацию и данные от до 10 стандартных индикаторов, а именно: Индекс среднего направленного движения (ADX) Индекс товарного канала (CCI) Классические свечи
    Ultimate Gold Advisor для MetaTrader 4 – Ваш передовой инструмент для гарантированного успеха! Ultimate Gold Advisor – это не просто индикатор: это технологическая жемчужина , которая революционизирует ваш подход к торговле на MetaTrader 4. Разработанный для удовлетворения потребностей самых требовательных трейдеров, этот передовой индикатор сочетает в себе хирургическую точность, сложный анализ и мощные функции, чтобы дать вам непревзойденное конкурентное преимущество на рынках. Идеально подход
    Currency Strength Wizard — очень мощный индикатор, предоставляющий вам комплексное решение для успешной торговли. Индикатор рассчитывает силу той или иной форекс-пары, используя данные всех валют на нескольких тайм фреймах. Эти данные представлены в виде простых в использовании индексов валют и линий силы валют, которые вы можете использовать, чтобы увидеть силу той или иной валюты. Все, что вам нужно, это прикрепить индикатор к графику, на котором вы хотите торговать, и индикатор покажет вам ре
    FX Volume
    Daniel Stein
    4.58 (33)
    Получайте ежедневную информацию о рынке с подробностями и скриншотами в нашем утреннем брифинге здесь, на mql5 , и в Telegram ! FX Volume - это ПЕРВЫЙ и ЕДИНСТВЕННЫЙ индикатор объема, который дает РЕАЛЬНОЕ представление о настроении рынка с точки зрения брокера. Он дает потрясающее представление о том, как институциональные участники рынка, такие как брокеры, позиционируют себя на рынке Forex, гораздо быстрее, чем отчеты COT. Видеть эту информацию прямо на своем графике - это настоящий геймчей
    Топовый индикатор МТ4, дающий сигналы для входа в сделки без перерисовки! Идеальные точки входа в сделки   для  валют, крипты, металлов, акций, индексов !  Смотрите  видео  (6:22) с примером отработки всего одного сигнала, окупившего индикатор. Версия индикатора для MT5 Преимущества индикатора Сигналы на вход без перерисовки Если сигнал появился, он никуда НЕ исчезает! В отличие от индикаторов с перерисовкой, которые ведут к потере депозита, потому что могут показать сигнал, а потом убрать его.
    Представляем       Quantum Breakout PRO   , новаторский индикатор MQL5, который меняет ваш способ торговли в зонах прорыва! Разработанная командой опытных трейдеров с опытом торговли более 13 лет,   Quantum Breakout PRO   предназначена для того, чтобы вывести ваше торговое путешествие на новые высоты благодаря своей инновационной и динамичной стратегии зон прорыва. Quantum Breakout Indicator покажет вам сигнальные стрелки на зонах прорыва с 5 целевыми зонами прибыли и предложением стоп-лос
    В НАСТОЯЩЕЕ ВРЕМЯ СКИДКА 26% Лучшее решение для новичка или трейдера-эксперта! Этот индикатор является уникальным, высококачественным и доступным торговым инструментом, поскольку мы включили в него ряд собственных функций и новую формулу. С помощью всего лишь ОДНОГО графика вы можете определить силу валюты для 28 пар Форекс! Представьте, как улучшится ваша торговля, потому что вы сможете точно определить точку запуска нового тренда или возможность скальпирования? Руководство пользователя:
    PowerBall Signals — это индикатор сигналов BUY/SELL, основанный на идее использования зон поддержки/сопротивления. Индикатор обнаруживает специальные модели разворота на основе зон поддержки/сопротивления и отображает эти сигналы на вашем графике. Основная идея индикатора заключается в использовании анализа MTF (Multi Time Frame) и предоставлении сигналов на основе уровней вашего текущего и следующего более старшего таймфрейма. Этот метод позволяет прогнозировать возможные развороты цен на любом
    Оставьте комментарий после покупки, чтобы получить 4 высококачественных индикатора в качестве бонуса. Индикатор Chart Patterns All-in-One помогает трейдерам визуализировать различные графические модели, которые широко используются в техническом анализе. Он помогает определить возможное поведение рынка, но не гарантирует прибыльность. Рекомендуется протестировать индикатор в демо-режиме перед покупкой. Текущая акция : Скидка 50% на индикатор "Chart Patterns All in One". Включенные модели : Модель
    Индикатор Supply Demand использует предыдущее ценовое действие для выявления потенциального дисбаланса между покупателями и продавцами. Ключевым является определение зон с лучшими возможностями, а не просто вероятностей. Индикатор Blahtech Supply Demand обеспечивает функционал, не доступный ни в одной платформе. Этот индикатор 4 в 1 не только выделяет зоны с более высокой вероятностью на основе механизма оценки силы по множественным критериям, но также комбинирует его с мульти-таймфреймовым анал
    Trend Pulse
    Mohamed Hassan
    5 (4)
    Please contact me after purchase to immediately get your PDF strategy + documentation for Trend Pulse !  Introducing Trend Pulse , a unique and robust indicator capable of detecting bullish, bearish, and even ranging trends! Trend Pulse uses a special algorithm to filter out market noise with real precision. If the current symbol is moving sideways, Trend Pulse will send you a ranging signal, letting you know that it's not a good time to enter a trade. This excellent system makes Trend Pulse
    Advanced Supply Demand
    Bernhard Schweigert
    4.91 (294)
    Этот индикатор является уникальным, качественным и доступным инструментом для торговли, включающим в себя наши собственные разработки и новую формулу. В обновленной версии появилась возможность отображать зоны двух таймфреймов. Это означает, что вам будут доступны зоны не только на старшем ТФ, а сразу с двух таймфреймов - таймфрейма графика и старшего: отображение вложенных зон. Обновление обязательно понравится всем трейдерам, торгующим по зонам спроса и предложения. Важная информация Для мак
    Automated Trendlines
    Georgios Kalomoiropoulos
    5 (16)
    Линии тренда являются наиболее важным инструментом технического анализа в торговле на рынке Форекс. К сожалению, большинство трейдеров рисуют их неправильно. Индикатор Automated Trendlines — это профессиональный инструмент для серьезных трейдеров, который поможет вам визуализировать трендовое движение рынков. Есть два типа линий тренда: бычьи линии тренда и медвежьи линии тренда. В восходящем тренде линия тренда Форекс проводится через самые низкие точки колебания ценового движения. Сое
    Order Block Hunter
    Noha Mohamed Fathy Younes Badr
    5 (6)
    Order block hunter indicator is the best indicator for  hunt the order blocks that area where there has been a large concentration of limit orders waiting to be executed Order blocks are identified on a chart by observing previous price action and looking for areas where the price experienced significant movement or sudden changes in direction .This indicator does that for you by using very complicated codes and helps you to take the best areas To buy and sell because it make marks at the best a
    Другие продукты этого автора
    ** All Symbols x All Timeframes scan just by pressing scanner button ** *** Contact me  to send you instruction and add you in "123 scanner group" for sharing or seeing experiences with other users. After 17 years of experience in the markets and programming, Winner indicator is ready. I would like to share with you! Introduction The 123 Pattern Scanner indicator with a special enhanced algorithm is a very repetitive common pattern finder with a high success rate . Interestingly, this Winner in
    Market Structure
    Reza Aghajanpour
    4.85 (26)
    ** All Symbols x All Timeframes scan just by pressing scanner button ** *** Contact me  to send you instruction and add you in "Market Structure group" for sharing or seeing experiences with other users. Introduction: Market structure is important for both new and professional traders since it can influence the liquidity and price action of a market (Breakout and Retest). It’s also one of the most commonly used techniques to understand trends, identify potential reversal points, and get a feel f
    **  All Symbols  x  All Timeframes  scan just by pressing scanner button ** *** Contact me  to send you instruction and add you in "Wolfe Wave Scanner group" for sharing or seeing experiences with other users. Introduction: A Wolfe Wave is created with five-wave patterns in price. It shows supply and demand and a fight towards a balance price. T hese waves of price actions can help traders identify the boundaries of   the trend . Also  It helps forecast how the price will move in the near futu
    ** All Symbols x All Timeframes scan just by pressing scanner button ** *** Contact me  to send you instruction and add you in "ABCD scanner group" for sharing or seeing experiences with other users. Introduction This indicator scans AB=CD retracement patterns in all charts. The ABCD is the basic foundation for all harmonic patterns and highly repetitive with a high success rate . The ABCD Scanner indicator is a scanner reversal ABCD pattern that helps you identify when the price is about to ch
    ** All Symbols x All Timeframes scan just by pressing scanner button ** After 17 years of experience in the markets and programming, Winner indicator is ready. I would like to share with you! *** Contact me  to send you instruction  and add you in "123 scanner group" for sharing or seeing experiences with other users. Introduction The 123 Pattern Scanner indicator with a special enhanced algorithm is a very repetitive common pattern finder with a high success rate . Interestingly, this Winner in
    Contact me  to send you instruction and add you in group. QM (Quasimodo) Pattern is based on Read The Market(RTM) concepts. The purpose of this model is to face the big players of the market (financial institutions and banks), As you know in financial markets, big traders try to fool small traders, but RTM prevent traders from getting trapped. This style is formed in terms of price candles and presented according to market supply and demand areas and no price oscillator is used in it. RTM con
    **   All Symbols   x   All Timeframes   scan just by pressing scanner button ** *** Contact me  to send you instruction and add you in "Trend Reversal group" for sharing or seeing experiences with other users. Introduction: Trendlines are the most famous technical analysis in trading . Trendlines continually form on the charts of markets across all the different timeframes providing huge opportunities for traders to jump in and profit on the action. In the other hand,  The trendline reversal str
    **   All Symbols   x   All Timeframes   scan just by pressing scanner button ** *** Contact me  to send you instruction and add you in "Market Structure group" for sharing or seeing experiences with other users. Introduction: Market structure is important for both new and professional traders since it can influence the liquidity and price action of a market. It’s also one of the most commonly used techniques to understand trends, identify potential reversal points, and get a feel for current mar
    **   All Symbols   x   All Timeframes   scan just by pressing scanner button ** *** Contact me  to send you instruction and add you in "M W Scanner group" for sharing or seeing experiences with other users. Introduction: Double Top(M) and Double Bottom(W) is a very repetitive common type of price reversal patterns. Double Top resembles M pattern and indicates bearish reversal whereas Double Bottom resembles W pattern and indicates a bullish reversal that they have  high win  rate. The M W Scanne
    M W Scanner
    Reza Aghajanpour
    5 (8)
    **   All Symbols   x   All Timeframes   scan just by pressing scanner button ** *** Contact me  to send you instruction and add you in "M W Scanner group" for sharing or seeing experiences with other users. Introduction: Double Top(M) and Double Bottom(W) is a very repetitive common type of price reversal patterns. Double Top resembles M pattern and indicates bearish reversal whereas Double Bottom resembles W pattern and indicates a bullish reversal that they have  high win  rate. The M W Scanne
    ** All Symbols x All Time frames scan just by pressing scanner button ** *** Contact me  to send you instruction and add you in "Harmonic Scanner group" for sharing or seeing experiences with other users. Introduction Harmonic Patterns are best used to predict turning point. Harmonic Patterns give you high win rate and high opportunities for trade in during one day. This indicator detects the best and successful patterns base on Harmonic Trading books . The Harmonic Patterns Scanner Scans All ch
    **   All Symbols   x   All Timeframes   scan just by pressing scanner button ** *** Contact me  to send you instruction and add you in "Head & Shoulders Scanner group" for sharing or seeing experiences with other users. Introduction: Head and Shoulders   Pattern  is a very repetitive common type of price reversal patterns. The pattern appears on all time frames and can be used by all types of traders and investors.   The  Head and Shoulders  Scanner indicator  Scans All charts just by pressing o
    **   All Symbols   x   All Time frames   scan just by pressing scanner button ** *** Contact me  to send you instruction and add you in "Swing scanner group" for sharing or seeing experiences with other users. Introduction: Swing Scanner   is the indicator designed to detect swings in the direction of the trend and possible reversal swings. The indicator studies several price and time vectors to track the aggregate trend direction and detects situations in which the market is oversold or overbou
    ** All Symbols x All Timeframes scan just by pressing scanner button ** *** Contact me  to send you instruction and add you in "ABCD scanner group" for sharing or seeing experiences with other users. Introduction This indicator scans AB=CD retracement patterns in all charts. The ABCD is the basic foundation for all harmonic patterns and highly repetitive with a high success rate . The ABCD Scanner indicator is a scanner reversal ABCD pattern that helps you identify when the price is about to cha
    **  All Symbols  x  All Timeframes  scan just by pressing scanner button ** *** Contact me  to send you instruction and add you in "Wolfe Wave Scanner group" for sharing or seeing experiences with other users. Introduction: A Wolfe Wave is created with five-wave patterns in price. It shows supply and demand and a fight towards a balance price. T hese waves of price actions can help traders identify the boundaries of   the trend . Also  It helps forecast how the price will move in the near future
    **   All Symbols   x   All Timeframes   scan just by pressing scanner button ** *** Contact me  to send you instruction and add you in "Channel Scanner group" for sharing or seeing experiences with other users. Introduction: The Channel pattern is described as the area located between two trend lines. This area is used for a measure of a trading range. In this case, the upper trend line connects price highs while the lower trend line connects price lows. Also when it comes to breakout points, it
    ** All Symbols x All Time frames scan just by pressing scanner button ** *** Contact me  to send you instruction and add you in "Order Block group" for sharing or seeing experiences with other users. Introduction: The central banks and financial institutions mainly drive the market, Order block is considered a market behavior that indicates accumulation of orders from banks and institutions, then the market tends to make a sharp move(Imbalance) on either side once the order block is completed. O
    Contact me  to send you instruction and add you in group. QM (Quasimodo) Pattern is based on Read The Market(RTM) concepts. The purpose of this model is to face the big players of the market (financial institutions and banks), As you know in financial markets, big traders try to fool small traders, but RTM prevent traders from getting trapped. This style is formed in terms of price candles and presented according to market supply and demand areas and no price oscillator is used in it. RTM con
    AI Next Level
    Reza Aghajanpour
    5 (1)
    The next generation G P T AI model quickly gained significant attention with its broad range of capabilities and versatility, We used its expertise in assisting prediction prices in formulating and applying improved trading strategies. Our AI core is capable of extracting data insights from financial news, Sentiment Analysis , specific formula, Oscillators and indicators status and other unstructured data sources. This information can then be used in conjunction with other datasets to make our
    Swing Scanner
    Reza Aghajanpour
    4.6 (20)
    ** All Symbols x All Time frames scan just by pressing scanner button ** *** Contact me  to send you instruction and add you in "Swing scanner group" for sharing or seeing experiences with other users. Introduction: Swing Scanner is the indicator designed to detect swings in the direction of the trend and possible reversal swings. The indicator studies several price and time vectors to track the aggregate trend direction and detects situations in which the market is oversold or overbought and r
    ** All Symbols x All Timeframes scan just by pressing scanner button ** ***Contact me to send you instruction and add you in "RSI scanner group" for sharing or seeing experiences with other users. Introduction RSI divergence is a main technique used to determine trend reversing when it’s time to sell or buy because prices are likely to drop or pick in the charts. The RSI Divergence indicator can help you locate the top and bottom of the market. This indicator finds Regular divergence for pullba
    ** All Symbols x All Timeframes scan just by pressing scanner button ** *** Contact me  to send you instruction and add you in "All Divergences scanner group" for sharing or seeing experiences with other users. Introduction Divergence is a main technique used to determine trend reversing when it’s time to sell or buy because prices are likely to drop or pick in the charts. All Divergence indicator can help you locate the top and bottom of the market. This indicator finds Regular divergences for
    ** All Symbols x All Time frames scan just by pressing scanner button ** *** Contact me  to send you instruction and add you in "Harmonic Scanner group" for sharing or seeing experiences with other users. Introduction Harmonic Patterns are best used to predict turning point. Harmonic Patterns give you high win rate and high opportunities for trade in during one day. This indicator detects the best and successful patterns based on Harmonic Trading concepts . The   Harmonic Patterns   Scanner   Sc
    ** All Symbols x All Timeframes scan just by pressing scanner button ** *** Contact me  to send you instruction and add you in "RSI scanner group" for sharing or seeing experiences with other users. Introduction RSI divergence is a main technique used to determine trend reversing when it’s time to sell or buy because prices are likely to drop or pick in the charts. The RSI Divergence indicator can help you locate the top and bottom of the market. This indicator finds Regular divergence for pu
    Introduction RSI divergence is a main technique used to determine trend reversing when it’s time to sell or buy because prices are likely to drop or pick in the charts. The RSI Divergence indicator can help you locate the top and bottom of the market. This indicator finds Regular divergence for pullback the market and also finds hidden RSI Divergence to show continuing trend. This indicator shows divergence on the RSI that is a strong hint for an excellent entry point and finds immediately with
    FREE
    Market Heartbeat in your hand! Introduction The Market Heartbeat indicator with a special enhanced algorithm (volume, money flow, cycle of market and a secret value) is a very repetitive trend finder with a high success rate . Interestingly, this Winner indicator indicates that the trend has changed its direction or the end of a trend retracement or even appears at the range market. The Market Heartbeat can use in scalping trading or trend trading. It finds immediately with alarm, notification a
    EA Gold Avatar
    Reza Aghajanpour
    5 (4)
    Gold Avatar is a Fully Automated for Trading XAUUSD/Gold. It will be 300$, only the first 4 sales are 199$. ** New Update = Version 3 ** Live signal monitoring: myfxbook.com/portfolio/gold-avatar/10941196 Contact me immediately after the purchase to send you instruction and add you in group. Default Settings for XAUUSD M15 FEATURES: Easy-to-use, just add EA on chart without any setting. News Filter and Auto GMT Time are  supported XAUUSD - M15 Sets are provided  Limited number of Buyers
    **   All Symbols   x   All Timeframes   scan just by pressing scanner button ** *** Contact me  to send you instruction and add you in "Head & Shoulders Scanner group" for sharing or seeing experiences with other users. Introduction: Head and Shoulders   Pattern  is a very repetitive common type of price reversal patterns.   The pattern appears on all time frames and can be used by all types of traders and investors.   The  Head and Shoulders  Scanner indicator  Scans All charts just by pressing
    ** All Symbols x All Time frames scan just by pressing scanner button ** *** Contact me  to send you instruction and add you in "Divergence group" for sharing or seeing experiences with other users. Introduction MACD divergence is a main technique used to determine trend reversing when it’s time to sell or buy because prices are likely to drop or pick in the charts. The MACD Divergence indicator can help you locate the top and bottom of the market. This indicator finds Regular divergence for pul
    ** All Symbols x All Time frames scan just by pressing scanner button ** *** Contact me  to send you instruction and add you in "Divergence group" for sharing or seeing experiences with other users. Introduction MACD divergence is a main technique used to determine trend reversing when it’s time to sell or buy because prices are likely to drop or pick in the charts. The MACD Divergence indicator can help you locate the top and bottom of the market. This indicator finds Regular divergence for pul
    Фильтр:
    JAM T
    944
    JAM T 2024.07.19 21:40 
     

    Another good indicator and the notifications ... it's perfect!

    91639307
    125
    91639307 2024.07.03 16:25 
     

    Пользователь не оставил комментарий к оценке

    Nguyen Do Anh Quang
    211
    Nguyen Do Anh Quang 2024.05.25 08:50 
     

    I have purchased many products from him. I looked for a good entry every time I entered a trade. I am applying checking multi-timeframe strategy for better results

    asahi0808
    170
    asahi0808 2024.01.07 05:44 
     

    I am satisfied with this products and his quick resoponse!!

    machasky
    184
    machasky 2023.11.04 18:35 
     

    Пользователь не оставил комментарий к оценке

    MarcoEA
    138
    MarcoEA 2023.08.05 16:42 
     

    I recently purchased the indicator and I must say it is quite impressive. The reliability its have improved my decisions. However, I encountered a small issue with the version I received, which is 1.2. I would greatly appreciate it if the developer could provide me with the updated version, 1.3. I believe the new features and enhancements in the latest version would further enhance my trading experience. Overall, I highly recommend this indicator, but I kindly request the updated version to fully utilize its potential. Thank you.

    Chiedozie
    140
    Chiedozie 2023.03.25 14:51 
     

    Пользователь не оставил комментарий к оценке

    Junichi Isono
    753
    Junichi Isono 2023.02.26 08:36 
     

    Пользователь не оставил комментарий к оценке

    salemtrading5
    647
    salemtrading5 2023.02.01 21:05 
     

    Been using this indicator in combination with another indicator I purchased from him. I like the results so far.

    fxgeezer
    136
    fxgeezer 2023.01.09 23:25 
     

    Пользователь не оставил комментарий к оценке

    Reza Aghajanpour
    86180
    Ответ разработчика Reza Aghajanpour 2024.05.23 12:13
    Thank you for your warm feedback.🌹⛱️🏖️🥇
    Enjoy your trading.⭐⭐⭐⭐⭐
    Ответ на отзыв
    Версия 1.6 2024.09.26
    - Added TP levels in push notification
    Версия 1.5 2024.05.10
    - added TP levels
    Версия 1.4 2024.05.08
    - Added symbol for scan in input setting
    - Fixed buffer issue
    - Removed extra print messages
    - Added Statistic Dashboard
    Версия 1.3 2023.08.05
    - Improved Tester Strategy
    Версия 1.2 2023.02.05
    - Added new option : Select Time Frames for scan in input setting
    Версия 1.1 2023.02.01
    - Added email notification