• Обзор
  • Отзывы
  • Обсуждение

Bayes Quantum Signals

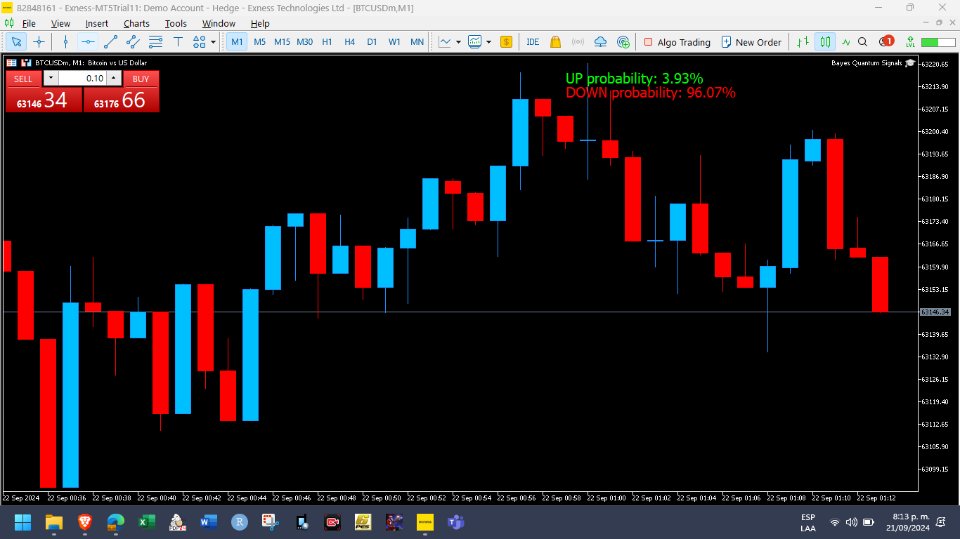
This is a system that allows you to instantly calculate future predictions about the movement of a listed asset, to better inform your buying or selling decisions and reduce the risk of your operations.  Bayes Quantum Signal can be used in algorithmic trading mode as an Expert Advisor, or also in a complementary way to support your own trading strategy. In this case, the system will display the bullish or bearish probabilities on your Metatrader 5 screen.

How does Bayes Quantum Signal work?

This algorithm is mainly based on a dynamic application of Bayes' theorem, concepts of differential calculus and financial econometrics.

The system steps are as follows:

1. A historical database is taken, whose extension and temporality are defined by the same operator.

2. From this base, the system calculates the bullish and bearish prior probabilities, and weights them based on their standard deviation measured dynamically through an eGARCH model. The basic idea is that larger and more skewed returns will have a larger impact on the calculation of posterior probabilities.

3. At all times the system calculates the real-time return of the candle that is forming and weights it with the previously calculated standard deviation. This is where the system applies Bayes' Theorem to constantly update the conditional probability calculation. In natural language, this can be expressed as "given that return x is occurring right now, what is the probability that the price will go up or down?"

It is important to highlight that both the previous and posterior probabilities are updated in real time, that is,  Bayes Quantum Signal always takes the last n candles for its calculations. This is the key point of the system, and it allows us to offer added value to our clients. Of course, a human cannot do this calculation in real time, or at least his/her margin of error will be much higher.

4. If the posterior probabilities are equal or exceed the inputs given by the user, then a buy or sell order will be activated as appropriate. The system allows you to modify the lot of both bying and selling operations before execution, as well as the take profit and stop loss of said orders (measured in points). Furthermore, these probabilities can be seen on the operator's screen, the color and font of which can be customized.

Input parameters: 

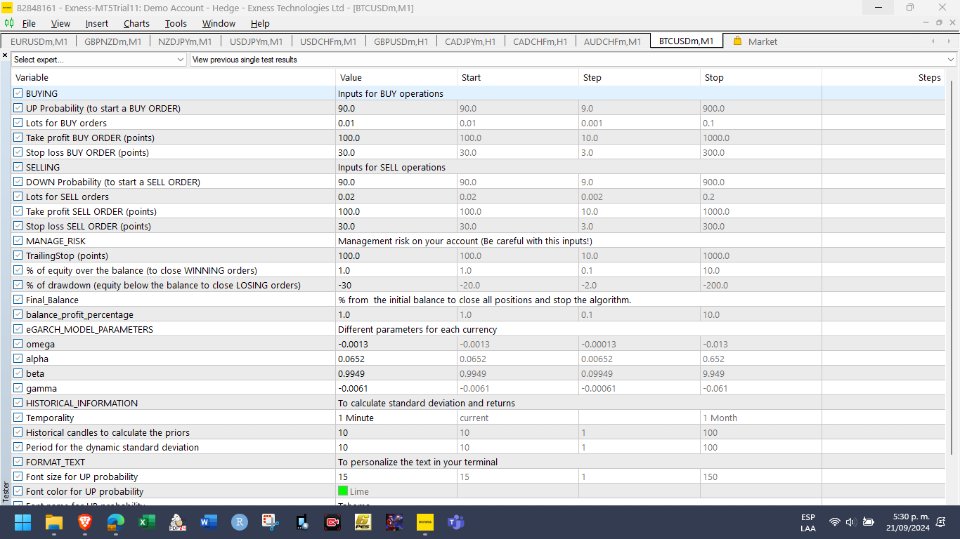
For a better visualization, the EA will display a dialog box separated by the following sections, in which the user must define the following inputs for each type of order: 

Buying operations

  • UP Probability (to start a BUY ORDER): Minimum probability value for which the user wants to start a buy order. It is defined as a number from 0 to 100. For example, to enter when the algorithm calculates an 80% UP probability, you enter the number 80 as input (without percentage notation).
  • Lots for BUY orders: Number of lots for each buy order. It is a fixed amount.
  • Take profit BUY ORDER (points): Fixed level of take profit for each buy order. It is defined in points.  
  • Stop loss BUY ORDER (points): Fixed stop loss level for each buy order. It is defined in points. 

Selling operations

  • DOWN Probability (to start a SELL ORDER): Minimum probability value for which the user wants to start a sale order.  It is defined as a number from 0 to 100. For example, to enter a sale order when the algorithm calculates an 80% down probability, you enter the number 80 as input (without percentage notation).
  • Lots for SELL orders: Number of lots for each sale order. It is a fixed amount.
  • Take profit SELL ORDER (points): Fixed take profit level for each sale order. It is defined in points.  
  • Stop loss SELL ORDER (points): Fixed stop loss level for each sale order. It is defined in points.  

Risk management in your account:

Important note:  Bayes Quantum Signal applies take profit and stop loss on some orders, which can be linked to the TrailingStop (points) input, where the user can define the points to apply trailing stops to previously defined levels. 

In those orders that are created without take profit or stop loss, the algorithm manages its profits and losses with the 3 points defined below: 

  • % of equity over the balance (to close WINNING orders): Define the percentage of equity above the balance at which all WINNING orders will be closed.
  • % of drawdown (equity below the balance to close LOSING orders): Define the percentage of equity below the balance at which all LOSING orders will be closed.
  • Balance_profit_percentage: Define the final percentage you expect to obtain on your balance and at which all WINNING and LOSING orders will be closed.

eGARCH Model Specification:

At this point it is important to highlight that each financial asset will have its own parameters. It is recommended to study the fundamentals of the eGARCH model or access reliable sources to obtain these parameters. You can also run your own regressions in some statistical software for this purpose.

  • omega: Long-term volatility
  • alpha: Impact of lagged volatility on current volatility
  • beta: Persistence of volatility over time
  • gamma: Asymmetry or leverage on volatility

Parameters for historical information

  • Temporality: Drop-down list in which the user can choose a temporality from one minute to one month.
  • Historical candles to calculate the priors: Number of candles that the user considers for the model to calculate the prior probabilities. These are related to the previously chosen temporality. For example, if the user chooses a time frame of 1 minute, and in this input defines 10, the model will take prior information from the previous 10 minutes. 
  • Period for the dynamic standard deviation: Number of candles that the user considers for the model to calculate the standard deviation through the eGARCH model.

Inputs to format the text

The user can give the desired format to the text displayed on the screen, like this: 

  • Font size for UP probability: Font size for the bullish probability text.
  • Font color for UP probability: Font color for the bullish probability text.
  • Font name for UP probability: Font name for the bullish probability text.
  • Font size for DOWN probability: Font size for the bearish probability text.
  • Font color for DOWN probability: Font color for bearish probability text
  • Font name for DOWN probability: Font name for the bearish probability text.

Final recommendations:

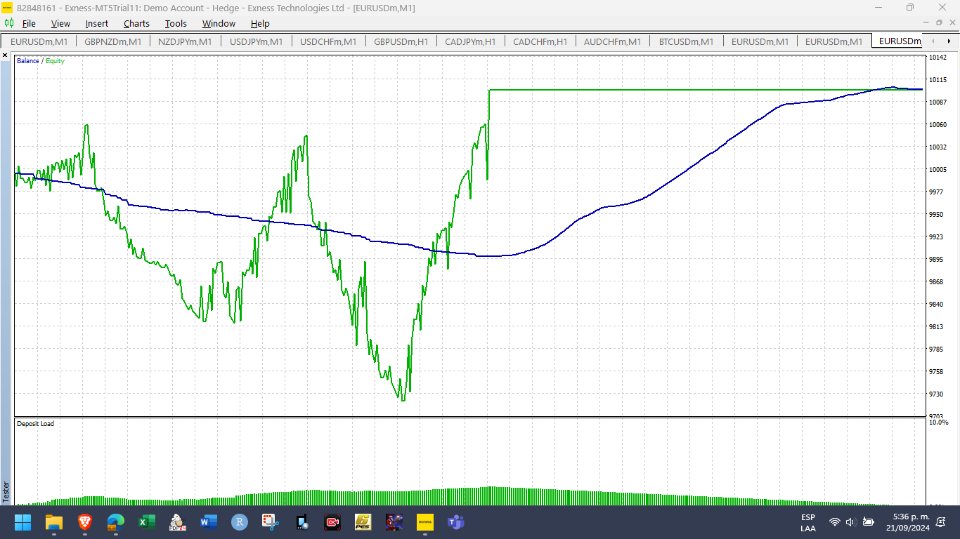
1. According to the tests carried out, this system is designed to open positions from 1 minute and on. It is important that you test the system to adjust it according to your own needs and investment objectives.

2. Please watch the full video in which I explain how the system works.

Thank you for your time.

Рекомендуем также
Market Profile 3 ForexArby com
Hussien Abdeltwab Hussien Ryad
3.83 (12)
Market Profile 3 MetaTrader 5 indicator  version 4.70— is a classic Market Profile implementation that can show the price density over time, outlining the most important price levels, value area, and control value of a given trading session. This indicator can be attached to timeframes between M1 and D1 and will show the Market Profile for daily, weekly, monthly, or even intraday sessions. Lower timeframes offer higher precision. Higher timeframes are recommended for better visibility. It is als
FREE
Renko Plus
Eadvisors Software Inc.
With Renko Plus you can use the features in the Indicator functionality, just add it to the Metatrader5 chart.             The Renko chart is a type of chart, developed by the Japanese, that is constructed using price movement rather than standardized prices and time intervals like most charts. It is believed to be named after the Japanese word for bricks, "renga", as the graphic looks like a series of bricks.             A new brick is created when the price moves a specified p
Renko Chart
Marcin Konieczny
3.63 (8)
Индикатор Renko Chart позволяет отображать графики "ренко" в окне индикатора. Тип графиков "ренко" показывает лишь движения цены, большие заданного (box size). Он помогает устранить шум и сосредоточиться на основных трендах. При построении графика время не учитывается, используются лишь ценовые движения. По этой причине графики "Ренко" не похожи на графики цены. Индикатор работает в 2 режимах: CLOSE - при построении графика "ренко" используются только цены Close; HIGH_LOW - при построении граф
FREE
Ловец трендов: Стратегия Ловец трендов с индикатором оповещения - это универсальный инструмент технического анализа, который помогает трейдерам определять рыночные тренды и потенциальные точки входа и выхода. Он представляет собой динамичную стратегию Ловец трендов, адаптирующуюся к рыночным условиям для четкого визуального представления направления тренда. Трейдеры могут настраивать параметры в соответствии со своими предпочтениями и уровнем риска. Индикатор помогает в идентификации тренда,
FREE
Индикатор строит текущие котировки, которые можно сравнить с историческими и на этом основании сделать прогноз ценового движения. Индикатор имеет текстовое поле для быстрой навигации к нужной дате. Параметры : Symbol - выбор символа, который будет отображать индикатор; SymbolPeriod - выбор периода, с которого индикатор будет брать данные; IndicatorColor - цвет индикатора; Inverse - true переворачивает котировки, false - исходный вид; Далее идут настройки текстового поля, в которое можн
This indicator uses a mathematical calculation algorithm . This algorithm calculates the remainder between the updated model and the actual values and produces the possible progress of the graph on the graph. It is not a super prophet in trading, but it is very good for the trader when entering the market and to analyze it before entering. Applicable for all currencies. Данный индикатор использует алгоритм математических вычислений . Данный алгоритм вычисляет остаток между обновленной моделью и
Introduction This indicator detects volume spread patterns for buy and sell opportunity. The patterns include demand and supply patterns. You might use each pattern for trading. However, these patterns are best used to detect the demand zone (=accumulation area) and supply zone (=distribution area). Demand pattern indicates generally potential buying opportunity. Supply pattern indicates generally potential selling opportunity. These are the underlying patterns rather than direct price action. T
FREE
Lorentzian AI
Michael Prescott Burney
Lorentzian A.I Indicator System Revolutionize your trading strategy with the Lorentzian A.I Indicator System, an advanced tool designed for traders who demand precision and adaptability. Whether you're trading Crypto, Indices, Forex, or Stocks, this state-of-the-art indicator uses cutting-edge technology to keep you ahead of the market. Key Features: Advanced Lorentzian Classification (LC): Utilize sophisticated LC algorithms to generate precise buy and sell signals, ensuring you make informed
FREE
Индикатор определяет и отображает на графике паттерн М. Гартли "Бабочка". Выделение паттерна производится по вершинам индикатора ZigZag (включен в ресурсы, не требует допопнительной установки). В момент распознавания паттерна выводится сообщение во всплывающем окне, отправляются оповещения на мобильное устройство и электронный почтовый ящик. Схема паттерна и параметры волн приведены на скриншоте. Параметры, заданные в индикаторе по умолчанию, являются демонстрационными для увеличения количества
This indicator calculates fibonacci levels via moving averages trend and draw these lines. You can change fast and slow Moving Averages settings for customization. Inputs: Fast MA Time Period :  64 Fast MA Shift: 0 Fast MA Method: Smoothed Fast MA Apply To: Median Price Slow MA Time Period: 32 Slow MA Shift: 0 Slow MA Method: Smoothed Slow MA Apply To: Median Price ZigZag: False ZigZag Color: Red ZigZag Type: DashDot ZigZag Width: VeryThin Fibo Settings TrendFibonacci: True FiboTrendColor: Blac
FREE
Please backtest with the exact balance of your live account before applying to real money. ==> If account balance is too low it may not trade at all! For MT4 version please contact via private message. martingale version is available here . Strategy description - Detect trend based on EMA18-EMA50-SMA200 alignment in three time frames: M15, H1, H4 - Trade in trend direction and exit when above alignment is broken. - The bot is tuned to trade XAUUSD(Gold). - The bot output is break even in rangi
FREE
What is this indicator? This indicator is the MACD (Moving Average Convergence/Divergence) supporting Virtual Trading mode of  Knots Compositor . When the mode is turned on, the indicator will be recalculated based on the displayed candlesticks. When the mode is turned off, the indicator will be recalculated based on the original chart candlesticks. Types of the applied price - Close - Open - High - Low - Median Price (HL/2) - Typical Price (HLC/3) - Weighted Price (HLCC/4) KC-Indicators
FREE
Order Book, известный также как Market Book, глубина рынка, стакан цен, Level 2, - это предоставляемая брокером динамически обновляемая таблица с данными по текущим объемам торговых заявок на покупку и продажу для различных уровней цен вблизи Bid и Ask конкретного финансового инструмента. MetaTrader 5 предоставляет возможность трансляции стакана цен , но только в реальном времени. Данный индикатор OrderBook Cumulative Indicator позволяет аккумулировать данные стакана онлайн и визуализировать их
Advanced 4xZeovo MT5 Indicator (MetaTrader 5)   Product Description  4xZeovo is a powerful trading indicator system monitoring 24/7 financial markets. Metatrader5 tool designed to find the best buying/selling opportunities and notifies the user.    Making life easy for traders in helping with the two most difficult decisions with the use of advanced innovate trading indicators aiming to encourage users to hold the winning positions and take profit at the best times.    Equipped with a unique tra
This is a multi-symbol and multi-timeframe table-based indicator designed for a candlestick patterns detection with 46 patterns for META TRADER 5. Each formation has own image for easier recognition. Here you find most popular formations such as "Engulfing", "Hammer", "Three Line Strike", "Piercing" or Doji - like candles. Check my full list of patterns on my screenshots below. Also you can not only switch all bearish or bullish patterns from input, but also select formation for a specified symb
Этот индикатор определяет наиболее популярные гармонические паттерны, которые предсказывают точки разворота рынка. Эти гармонические паттерны представляют собой ценовые формации, которые постоянно повторяются на рынке Форекс и указывают на возможные будущие движения цены /   Бесплатная версия MT4 Кроме того, данный индикатор имеет встроенный сигнал входа в рынок, а также различные тейк-профиты и стоп-лоссы. Следует отметить, что хотя индикатор гармонических паттернов может сам по себе давать
FREE
What is this indicator? This indicator is the RSI (Relative Strength Index) supporting Virtual Trading mode of  Knots Compositor . When the mode is turned on, the indicator will be recalculated based on the displayed candlesticks. When the mode is turned off, the indicator will be recalculated based on the original chart candlesticks. Types of the applied price - Close - Open - High - Low - Median Price (HL/2) - Typical Price (HLC/3) - Weighted Price (HLCC/4) KC-Indicators -   KC-MA   (M
FREE
Gino Renko
Stephane, Andr Valette
1 (1)
Another renko-based indicator. It returns different usable values ​​for an EA, and is directly displayed on the main chart. Its setting is very simple: The size of the renko The number of bars taken into account The falling color The color on the rise Returned values: Buffer 0 : Value of the middle Buffer 1 : Value of the Top Buffer 2 : Value of the Bottom Buffer 3 : Direction of renko (0.0 for top ; 1.0 for bottom) Buffer 4 : Ratio of the renko, for example, if it is twice, 3 times, ro more of
Important Lines
Terence Gronowski
4.85 (20)
Индикатор отображает линии пивот, уровни максимума, минимума и закрытия предыдущего дня, а также минимум и максимум предыдущего часа. Нужно просто установить этот индикатор на график, чтобы отобразить все эти важные линии, нет необходимости настраивать множество отдельных индикаторов. Почему важны определенные линии Максимум и минимум предыдущего дня : эти уровни используются для торговли на дневном графике. Очень часто, если цена становится выше или ниже минимума/максимума предыдущего дня, пр
FREE
This is a buyer and seller aggression indicator that analyzes the shape of each candle and project this data in a histogram form. There are 4 histograms in one. On the front we have two: Upper - Buyer force. Lower - Seller force. At the background we also have two histogram, both with same color. They measure the combined strenght of buyers and sellers. This histograms can be turned off in Input Parameters. It is also possible to have the real or tick volume to help on this force measurement. IN
FREE
Donchian Pro
Paulo Henrique Faquineli Garcia
5 (2)
The Donchian Channel Channels are among the most popular tools of technical analysis, as they visually convey to the analyst the limits within which most price movement tends to occur. Channel users know that valuable information can be obtained at any time, whether prices are in the central region of a band or close to one of the border lines. One of the best known techniques to explore these concepts is Bollinger Bands. However, John Bollinger was not the only one to research the applicatio
FREE
High Low Open Close
Alexandre Borela
4.97 (37)
Если вам нравится этот проект, оставьте 5-звездочный обзор. Следуйте на instagram: borelatech Данный показатель рисует открытые, высокие, низкие и закрывающие цены на указанные период и его можно отрегулировать для специфического часового пояса. Это важные уровни, которые выглядят многие институциональные и профессиональные трейдеры и могут быть полезны для вас, чтобы знать места, где они могут быть больше активный. Доступные периоды: Предыдущий день. Предыдущая неделя. Предыдущий месяц.
FREE
Вы устали вручную рисовать уровни Фибоначчи на своих графиках? Вы ищете удобный и эффективный способ определения ключевых уровней поддержки и сопротивления в своей торговле? Не смотрите дальше!   Представляем DrawFib Pro, совершенный индикатор для MetaTrader 5, который выполняет автоматические   уровни   Фибоначчи.       рисование на ваших графиках и предоставление своевременных предупреждений при нарушении этих уровней. С DrawFib Pro вы можете улучшить свои торговые стратегии, сэкономить время
FREE
Добро пожаловать в HiperCube Renko Candles Этот индикатор предоставляет вам реальную информацию о рынке, преобразуя ее в стиль Renko Candle. Определение Графики Renko — это тип финансовых диаграмм, которые измеряют и отображают изменения цен, используя кирпичи (или бары) для представления движения цен. В отличие от традиционных графиков свечей, графики Renko не отображают информацию, основанную на времени, а фокусируются исключительно на колебаниях цен. Особенности: Индикатор в отдельных
FREE
Версия MT4   |   FAQ Индикатор Owl Smart Levels – это полноценная торговая система внутри одного индикатора, которая включает в себя такие популярные инструменты анализа рынка как усовершенствованные фракталы Билла Вильямса , Valable ZigZag, который строит правильную волновую структуру рынка, а также  уровни Фибоначчи, которые   отмечают точные уровни входа в рынок и места взятия прибыли. Подробное описание стратегии Инструкция по работе с индикатором Советник-помошник в торговле Owl Helper При
Вела Эспециал Вы бы хотели использовать один из лучших индикаторов валютного обмена, основанный на стратегии Ишимоку, которая является очень успешной? Вы можете использовать отличный индикатор, основанный на стратегии Ишимоку. Версия MT4 доступна здесь. Первая стратегия: Эта стратегия включает в себя выявление похожих и редких, но мощных пересечений. Самые подходящие временные интервалы для этой стратегии - 30 минут (30M) и 1 час (H1). Подходящие символы для графика 30 минут: • CAD/JPY
The Candle Countdown Timer for MetaTrader 4 (also available for MT5) is a vital indicator designed to help you manage your trading time effectively. It keeps you updated about market open and close times by displaying the remaining time before the current candle closes and a new one forms. This powerful tool enables you to make well-informed trading decisions. Key Features: Asia Range: Comes with an option to extend the range. Broker Time, New York, London Time: Displays the current broker time
FREE
Об индикаторе: DALA Forecast - универсальный инструмент предсказания динамики временных рядов любой природы. Для предсказания используется модифицированные методы анализа нелинейной динамики, на основе которых строится предсказательная модель с применением методов машинного обучения.  Для получения ознакомительной версии индикатора вы можете связаться со мной в личных сообщениях. Как пользоваться индикатором: Примените индикатор к выбранному вами финансовому интрументу или индикатору с нужным
FREE
Follow The Line MT5
Oliver Gideon Amofa Appiah
4.5 (28)
This indicator obeys the popular maxim that: "THE TREND IS YOUR FRIEND" It paints a GREEN line for BUY and also paints a RED line for SELL. (you can change the colors). It gives alarms and alerts of all kinds. IT DOES NOT REPAINT and can be used for all currency pairs and timeframes. Yes, as easy and simple as that. Even a newbie can use it to make great and reliable trades. NB: For best results, get my other premium indicators for more powerful and reliable signals. Get them here: https://www.m
FREE
Free automatic Fibonacci is an indicator that automatically plots a Fibonacci retracement based on the number of bars you select on the BarsToScan setting in the indicator. The Fibonacci is automatically updated in real time as new highest and lowest values appears amongst the selected bars. You can select which level values to be displayed in the indicator settings. You can also select the color of the levels thus enabling the trader to be able to attach the indicator several times with differe
FREE
С этим продуктом покупают
Attention: this is a multicurrency EA, which trades by several pairs from one chart!  Therefore, in order to avoid duplicate trades, it is necessary to attach EA only to one chart, ---> all trading in all pairs is conducted only from one chart! we can trade simultaneously in three different pairs, as by default (EURUSD + GBPUSD + AUDUSD), which take into account the correlation when entering the market for all three; we can trade only EURUSD (or any currency pair) and at the same time take into
Hedge Ninja
Robert Mathias Bernt Larsson
5 (1)
Не забудьте присоединиться к нашему сообществу Discord на сайте www.Robertsfx.com , вы также можете купить советник на сайте robertsfx.com. ВЫИГРЫВАЙТЕ НЕЗАВИСИМО ОТ КАКОГО НАПРАВЛЕНИЯ ДВИЖЕТСЯ ЦЕНА Этот робот выигрывает независимо от того, в каком направлении движется цена, следуя изменяющемуся направлению в зависимости от того, в каком направлении движется цена. Это самый бесплатный способ торговли на сегодняшний день. Таким образом, вы выигрываете независимо от того, в каком направлении она
Adam FTMO MT5
Vyacheslav Izvarin
5 (2)
ADAM EA Special Version for FTMO Please use ShowInfo= false for backtesting ! Our 1st EA created using ChatGPT technology Trade only GOOD and checked PROP FIRMS  Default parameters for Challenge $100,000 Tested on EURUSD and GBPUSD only  Use 15MIN Time Frame Close all deals and Auto-trading  before Weekend at 12:00 GMT+3  Friday For Prop Firms MUST use special Protector  https://www.mql5.com/en/market/product/94362 -------------------------------------------------------------------------------
Gold Pip Sniper MT5
Muhammed Sharookh Chittethukudiyil
Ограниченное по времени предложение: Текущая цена $119 доступна только для первых 5 покупок! После этого цена увеличится до $999. Не упустите эту эксклюзивную возможность — действуйте быстро, пока предложение не закончилось! Rich Market Minds Scalper EA: точный скальпинг для новых рыночных тенденций.   Rich Market Minds Scalper EA создан экспертами, чтобы быстро и точно использовать новые и развивающиеся рыночные тенденции. Этот автоматизированный торговый инструмент предназначен для о
Серия продуктов под маркой  FiboPlusWave Готовая торговая система на основе  волн Эллиотта и уровней Фибоначчи . Просто и доступно. Отображение разметки волн Эллиотта (основной или альтернативный вариант) на графике. Построение горизонтальных уровней, линий поддержек и сопротивления, канала. Наложение уровней Фибоначчи на волны 1, 3, 5, A Система алертов (на экран, E-Mail, Push уведомления).    Особенности: не вникая в волновую теорию Эллиотта, можно сразу открыть один из возможных вариантов вхо
Mt5BridgeBinary
Leandro Sanchez Marino
Я автоматизировал их бизнес-стратегии для использования бинарных MT5 в Интернете и Mt5BridgeBinary наши заказы на ваш счет в Binary, и вы готовы начать работать так просто! Опытные консультанты просты в настройке, оптимизации и тестировании на прочность; Кроме того, в тесте мы можем прогнозировать долгосрочную рентабельность, поэтому мы создали механизмы для Mt5BridgeBinary своих лучших стратегий к Binary. Характеристики: -Вы можете использовать как можно больше стратегий. (Expert Advisor).
Xrade EA
Yao Maxime Kayi
Xrade EA is an expert advisor as technical indicator. For short period trade it's the best for next previsions of the trend of the market. +--------------------------------------------------------------------------------------- Very Important Our robot(data anylizer) does'nt take a trade procedure. If using only our robot you must take positions by yoursels +--------------------------------------------------------------------------------------- The technical indiator provide for a give
Technical confluence zones is a very popular tool for traders. This EA detects such zones by studying chart patterns, naked price levels, fib levels, SMA/EMA over multiple timeframes and more. The source data is loaded from Mytradingpet.com. To find out what are factored in when determining such zones, visit https://mytradingpet.com - a free service for all traders. The zones are color coded. Purple indicates the highest level of confluence.
PROMOTION!! $499 until 1 Mar. After that, EA will be $1,050 Developed and tested for over 3 years, this is one of the safest EAs on the planet for trading the New York Open. Trading could never be easier.  Trade On NASDAQ US30 (Dow Jones Industrial Average) S&P 500  What Does The EA do? The EA will open a Buy Stop Order and a Sell Stop Order(With SL and TP) on either side of the market just a few seconds before the NY Open.  As soon as 1 of the 2 trades is triggered, the EA automatically delete
Сохранение данных с биржевого стакана. Утилита для воспроизведения данных: https://www.mql5.com/ru/market/product/71640 Библиотека для использования в тестере стратегий: https://www.mql5.com/ru/market/product/81409 Возможно, потом появится библиотека для использования сохранённых данных в тестере стратегий, зависит от интереса к этой разработке. Сейчас есть наработки такого рода с использованием разделяемой памяти, когда только одна копия данных находится в оперативной памяти. Это позволяет не
Gold instrument scanner is the chart pattern scanner to detect the triangle pattern, falling wedge pattern, rising wedge pattern, channel pattern and so on. Gold instrument scanner uses highly sophisticated pattern detection algorithm. However, we have designed it in the easy to use and intuitive manner. Advanced Price Pattern Scanner will show all the patterns in your chart in the most efficient format for your trading. You do not have to do tedious manual pattern detection any more. Plus you
Gold Wire Trader MT5 trades using the RSI Indicator. It offers many customizable RSI trading scenarios and flexible position management settings, plus many useful features like customizable trading sessions, a martingale and inverse martingale mode. The EA implements the following entry strategies, that can be enabled or disabled at will: Trade when the RSI Indicator is oversold or overbought Trade when the RSI comes back from an oversold or overbought condition Four different trading behav
Gold trend indicator MT5 This is a multi-timeframe indicator that detects and plots supports and resistance lines in the chart with the same precision as a human eye would. As price levels are tested over time and its importance increases, the lines become thicker and darker, making price leves easy to glance and evaluate. Boost your technical analysis Customizable timeframe selection Read price levels from the timeframe of your choosing Detect important price levels without browsing through
Gold trend scanner MT5 a multi symbol multi timeframe dashboard that monitors and analyzes Average True Range indicator value in up to 28 symbols and 9 timeframes  in 3 modes :  It shows the ATR indicator value in all pairs and timeframes and signals when the ATR value reaches a maximum or minimum in a given duration. Short term ATR/Long term ATR ratio: It shows ratio of 2 ATRs with different periods. It's useful in detecting short term volatility and explosive moves. ATR Value/Spread ratio:
A triangular arbitrage strategy exploits inefficiencies between three related currency pairs, placing offsetting transactions which cancel each other for a net profit when the inefficiency is resolved. A deal involves three trades, exchanging the initial currency for a second, the second currency for a third, and the third currency for the initial. With the third trade, the arbitrageur locks in a zero-risk profit from the discrepancy that exists when the market cross exchange rate is not aligned
Gold index expert MT5 Wizard uses Multi-timeframe analysis. In simpler terms, the indicator monitors 2 timeframes. A higher timeframe and a lower timeframe. The indicator determines the trend by analyzing order flow and structure on the higher timeframe(4 hour for instance). Once the trend and order flow have been determined the indicator then uses previous market structure and price action to accurately determine high probability reversal zones. Once the high probability reversal zone has be

Golden Route home MT5 calculates the average prices of BUY (LONG) and SELL (SHORT) open positions, taking into account the size of open positions, commissions and swaps. The indicator builds the average line of LONG open positions, after crossing which, from the bottom up, the total profit for all LONG positions for the current instrument becomes greater than 0. The indicator builds the average line of SHORT open positions, after crossing which, from top to bottom, the total profit for all
Do you want an EA with small stoploss? Do you want an EA that is just in and out of market? Gold looks at several MT5 It is ONLY buying when the market opens and with a window of 10 minutes or less. It uses pre-market price so be sure your broker has that.   This strategies (yes, it is 2 different strategies that can be used with 3 different charts) have tight stoplosses and a takeprofit that often will be reached within seconds! The strategies are well proven. I have used them manually
Bekenet Signal Generator
Joseph Adgekawe Bekedemor
Генератор сигналов Bekenet. Это программное обеспечение является экспертным советником, но оно не осуществляет торговлю, оно только отправляет прибыльный сигнал пользователю мобильного приложения mt5 после активации идентификатора метакота. Это программное обеспечение дает сигнал на покупку и продажу с заданным стоп-лоссом. Программное обеспечение работает с MT5 и 15-минутным таймфреймом. Генератор сигналов Bekenet разработан с использованием только ценового действия. Он рассчитывает ключевой ур
一款实时显示点差的工具.非常好用. 是日常看价格的好帮手. 一款实时显示点差的工具.非常好用. 是日常看价格的好帮手. 一款实时显示点差的工具.非常好用. 是日常看价格的好帮手.   一款实时显示点差的工具.非常好用. 是日常看价格的好帮手. 一款实时显示点差的工具.非常好用. 是日常看价格的好帮手. 一款实时显示点差的工具.非常好用. 是日常看价格的好帮手. 一款实时显示点差的工具.非常好用. 是日常看价格的好帮手. 一款实时显示点差的工具.非常好用. 是日常看价格的好帮手. 一款实时显示点差的工具.非常好用. 是日常看价格的好帮手. 一款实时显示点差的工具.非常好用. 是日常看价格的好帮手. 一款实时显示点差的工具.非常好用. 是日常看价格的好帮手.
Key levels are psychological price levels on the forex chart where many traders base their technical analyses on. These traders are likely to place their bullish or bearish entries, and exit points around these levels. And as a result, key levels tend to be crowded with a high trading volume. Key levels also attract so much trading volume because that is where institutional traders make their trades as well. And thanks to their big-money moves, key levels are often resilient and lasting. How

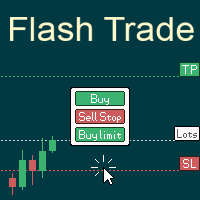
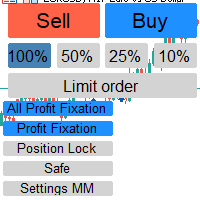
# If you have any other requirements or are interested in collaboration, please contact  dev.quantech.london@gmail.com . Flash Trade (FT) Most friendly manual trading tool. Easy operation to secure your funds. Features of FT Click the chart to trade fast FT supports market orders and pending orders Click twice to complete the order and set SL and TP Click trice to complete the pending order and set SL and TP Automatically set the stop-loss amount of each order to a fixed percentage of the bal
Отличный помощник для тех кто грамотно распоряжается своими рисками. Данный помощник просто не заменим если у вас всегда должен быть фиксированный риск на сделку. Помогает автоматически высчитывать лот в зависимости от вашего риска. Теперь можно не беспокоиться о том каким будет ваш Stoploss, риск всегда будет одинаковый. Считает объем сделок как для рыночных ордеров так и для отложенных. Удобный и интуитивно понятный интерфейс, так же есть некоторые дополнительные функции для упрощения вашей то
FTMO Sniper 7
Vyacheslav Izvarin
Dedicated for FTMO and other Prop Firms Challenges 2020-2024 Trade only GOOD and checked PROP FIRMS  Default parameters for Challenge $100,000 Best results on GOLD and US100  Use any Time Frame Close all deals and Auto-trading  before  US HIGH NEWS, reopen 2 minutes after Close all deals and Auto-trading  before Weekend at 12:00 GMT+3  Friday Recommended time to trade 09:00-21:00 GMT+3 For Prop Firms MUST use special  Protector  https://www.mql5.com/en/market/product/94362 ------------------
Introducing TEAB Builder - The Ultimate MT5 Expert Advisor for Profoundly Profitable and Customizable Trading!     Are you ready to take your trading to the next level? Meet TEAB Builder, an advanced MT5 Expert Advisor designed to provide unparalleled flexibility, high-profit potential, and an array of powerful features to enhance your trading experience. With TEAB Builder, you can effortlessly trade with any indicator signal, allowing you to capitalize on a wide range of trading strategies.  
The Wall Street Player (Master version). This EA tailored as a Discipline, Money and Risk Management tool is a powerful Trade Station utility designed for Forex, Cryptos, Commodities, Shares, Deriv synthetic pairs and any CFDs Market. It is designed to fit your strategy as a winner, and take your Edge of the market to the NEXT-LEVEL. The only thing to do is to get It on your chart and appreciate the possibilities and chart management abilities it has to offer for realizing that discipline and a
Cheers, traders! In today's video, dive into the world of advanced trading with our exclusive Trade Panel. This Cyber Monday, we're offering a special deal – get access for only $27 instead of the usual $60! In this tutorial, we explore a semi-automated trading system that empowers manual traders to seize opportunities effectively. Watch as we demonstrate using real market scenarios, showing you how to set up trades, manage risk, and maximize profits. Key Features of the Trade P
The Wall Street Player (Ultimatum version). This EA tailored as a Discipline, Money and Risk Management tool is a powerful Trade Station utility designed for Forex, Cryptos, Commodities, Shares, Deriv synthetic pairs and any CFDs Market. It is designed to fit your strategy as a winner, and take your Edge of the market to the NEXT-LEVEL. The only thing to do is to get It on your chart and appreciate the possibilities and chart management abilities it has to offer for realizing that discipline and
Откройте для себя новую стратегию волновой торговли - Подходит для валютных пар, таких как AUDUSD.s Особенности стратегии : Специально разработанные графики индикаторов тренда : Наша стратегия предлагает уникальный графический интерфейс, который помогает трейдерам определять и использовать рыночные колебания. Проверка на исторических данных : Трейдерам рекомендуется тестировать валютные пары, такие как AUDUSD.s, для подтверждения эффективности нашей стратегии. Гибкие временные рамки : П
Sabira Reactive
Gounteni Dambe Tchimbiandja
IMPORTANT NOTE THIS EA IS NOT FULLY AUTOMATED, IT ONLY TAKES POSITIONS IN ZONES YOU DEFINE IT ASSISTS YOU. SO YOU NEED TO WATCH THE CHART CLOSELY THE MAIN POINT OF THIS EA IS TO FORCE THE TRADER TO RESPECT ENTRY RULES <<CONFIRMATION IS THE KEY>>. SO THE TRADER WILL ONLY LOOK FOR ZONES THE EA WILL LOOK FOR CONFIRMATION CANDLES AND ENTER IF A CONFIRMATION IS FOUND FOR EXAMPLE: If price is in a Bullish zone. Rule, look for buys. If Bullish Candlestick Pattern  or any other bullish candle pattern s
Другие продукты этого автора
Export Intraday Data
Diego Andres Unigarro Andrade
S ystem that allows traders to bulk download closing prices for many listed instruments. Generally, access to this type of information is only possible through financial APIs, which are often very expensive to license. The trader can download his own databases directly from his MT5 terminal, which can then be used as input for quantitative trading models. Input parameters 1. Comma-separated symbols:   the trader must enter the ticker symbol of the instruments, each of them separated by a comm
FREE
Фильтр:
Нет отзывов
Ответ на отзыв