Смотри обучающее видео по маркету на YouTube
Как купить торгового робота или индикатор
Запусти робота на
виртуальном хостинге
виртуальном хостинге
Протестируй индикатор/робота перед покупкой
Хочешь зарабатывать в Маркете?
Как подать продукт, чтобы его покупали
Новые торговые роботы и индикаторы для MetaTrader 5 - 119
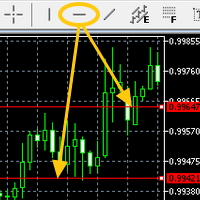
Attach the indicator on the chart and draw the red line from the button on MT5's built-in menu bar then the alert will be sent to you(push,email,popup and sound)
Hi You all know the red line (the MT5 built-in red line) drawn from the menu bar on MT5. It is often used to check the resistance etc.....It is very useful but it is little troublesome to get an alert(sound, push, email and popup) when the red line is touched by the price. Here is Price Touch Alert indication, just use the button t

Yggdrasil is a fully automated hedging system . The EA opens orders in both direction on the chosen pairs by the user. Currency pairs aren't traded individually, all trades opened are part of the system. The algorithm will close the unprofitable orders with the available profit. It prevents drawdown to increase if a big trend occurs on a currency pair.
The EA is designed to be efficient with minimal settings . No need fine tuning parameters, it's a long term "set & forget" expert advisor.
A

Do you like Meta Trader? Nice, me too. Have you missed one or more features that could exist in it? Me too. Annoyed by this, I decided to create the Trade Panel. This tool has two versions: Lite and Pro. It is literally magical! It expands, and a lot, the possibilities of your Meta Trader! It ceases to be a good program and becomes excellent! Do you doubt? It is okay. Buy and see for yourself ;) One warning: you will love it! Lite version (free): https://www.mql5.com/en/market/product/40410 A

Создать своего торгового эксперта без навыков программирования! Это легко и просто. Данная панель - это конструктор Торговых Роботов
Данный конструктор содержит в себе: 57 сигналов (количество регулярно увеличивается) несколько систем Trailing Stop (в том числе Trailing по Bollinger Bands)
Формируй легко новые торговые эксперты: Выбираешь 1 сигнал Выбираешь не более 3-х фильтров для него Выбираешь вариант Trailing одной кнопкой сохраняешь настройки в ".set" файл все готово. Запускай данно
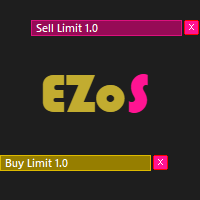
Easy Order Send help you to put your order on the chart using shortcuts keys like (SHIFT or CTRL). To send a order, hold CTRL or SHIFT and press left click mouse. It's a Beta version with features below: 1 - Send Buy and Sell order with SHIFT AND CTRL
2 - Cancel Button to your order
3 - Cancel Button to your position
4 - Move your order
5 - Monitor your Profit after trade on.
FREE

This indicator draws regular bullish and bearish divergences in real-time onto the charts. The algorithm to detect those divergences is based on my 10+ years experience of detecting divergences visually. The divergences are drawn as green and red rectangles on the charts. You can even do forward testing in the visual mode of the strategy tester. This FREE Version is restricted to EURUSD and GBPUSD. The full version without restrictions is here: https://www.mql5.com/en/market/product/42758
Par
FREE
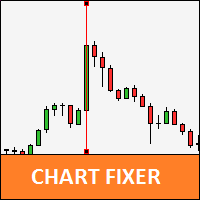
Utility that allows you to set a specific date on the chart. You set a reference point through a vertical line and it is done! When changing timeframes, the reference point is always positioned at the center of the chart. That way you can analyze a specific date at different timeframes easily, without losing the reference point or scrolling the chart to it.
This is a product developed by Renato Fiche Junior and available to all MetaTrader 5 users!
Partners: "Águia Traders" team ( Eagle Trad
FREE
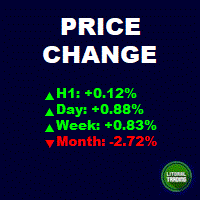
This is an informant indicator, very simple. It shows how much the price has chanded in percentage in certain period (month, week, day and actual period). It is discreet and small, does not visually posslute the chart. If your MT is not on portuguese idiom the indicator will automatically change to english. Check out our most complete tool for the market, the Trade Panel: https://www.mql5.com/en/market/product/42658 If you have any suggestion or find any bug, please, contact us. Enjoy!
This i
FREE
С помощью данного индикатора вы сможете предвидеть поведение цены в будущем определенное количество баров. Индикатор рисует линию отображающую смоделированные будущие значения цен. Данную информацию вы сможете использовать как для входа / выхода с рынка. Так и для установки / коррекции стопов, сопровождающих позицию.
Индикатор имеет несколько параметров. HistoricBars - Количество исторических баров для анализа. FutureBars - Количество баров для прогнозирования цены. Prediction - коэффициент г
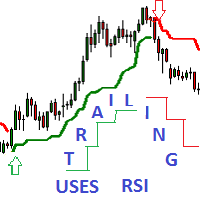
Adaptive Trailing uses RSI Indicator - это индикатор направленного движения, позволяющий определять тренд в момент его зарождения и задавать уровни защитного стопа. Трейлинг может осуществляться как снизу, когда уровень стопа ниже текущей цены и подтягивается за ценой, если она возрастает, так и сверху, когда уровни стопа выше текущей цены. Предусмотрено два режима расчета стоп уровня . Простой трейлинг производится с постоянной дистанцией Npoints к текущей цене. Адаптивный трейлинг учитыв

Представляем вам очень надежную экспертную систему. Экспертная система основана на индикаторе AC. данный индикатор генерирует очень надежные сигналы! Индикатор АС измеряет скорость движущей силы рынка путем вычитания медленного скользящего среднего из быстрого и последующего вычитания быстрого скользящего среднего от этой разности. Этот индикатор, несмотря на присутствующую модель усреднения, можно отнести к опережающим, так как он измеряет именно движущую силу, которая сперва замедляется, а по

KT MA Crossover draws the buy and sell arrows based on the crossover of chosen moving averages. Moreover, it also generates the appropriate alerts and displays the MFE (Most Favorable Excursion) for each successive signal. The moving average crossover is one of the primary strategies followed by traders around the world. Usually, it consists of a fast and slow moving average to find a buy and sell entry signal according to the crossover direction. Buy signal - when fast MA crosses above the slo

This indicator draws regular bullish and bearish divergences in real-time onto the charts. The algorithm to detect those divergences is based on my 10+ years experience of detecting divergences visually. The divergences are drawn as green and red rectangles on the charts. You can even do forward testing in the visual mode of the strategy tester.
Parameters Fast EMA Period: The period of the fast EMA of the MACD. Default value is 12.
Slow EMA Period: The period of the slow EMA of the MACD. Def

Вертикальная гистограмма объема - отображает распределение объема по уровням. Гистограмма рассчитывается от объема ( реального или тикового), при этом объем соответствующий бару переносится на уровень H-L бара.
Таким образом, при распределении объема за сутки по вертикали - формируются максимумы гистограммы показывающие области проторговки. Настройки индикатора: Timeframe Set - период в пределах которого производится расчет. (рекомендуется D1) Step's - количество отображаемых периодов. Amplit

KT Heiken Ashi Smoothed is a smoothed version of the standard Heiken Ashi. Moreover, it also plots buy/sell arrows on a trend change. A buy arrow is plotted when it change to a bullish state from bearish state. A sell arrow is plotted when it change to a bearish state from bullish state. Mobile notifications, Email, Sound and Pop-up alerts included.
What exactly is Heiken Ashi Smoothed? It filters out the false signals and noise in the standard Heiken Ashi. It applies the set of two moving a

KT Round Numbers plots the round number levels which are also commonly known as psychological levels in the Forex world. In the context of Forex trading, round number levels are those levels in which there are two or more zeroes at the end. They are named as 00 levels on the chart.
Some traders also consider the halfway points as a valid round number level. They are named as 50 levels on the chart.
Use of round number levels in trading Round number levels work as strong support and resistan

Statistic Candles. Утилита для получения статистики с графика "Японские свечи".
Статистика собирается нижеописанными методами.
Выполняет следующие функции: Подсчёт свечей на 19-ти таймфреймах (внутридневные свечи): Количества бычьих и медвежьих свечей в указанном промежутке дат. Количества бычьих и медвежьих свечей в указанном промежутке дат в обозначенное время. Подсчёт количества нестандартных свечей (прим.: Custom _ time = 14:56, Period _ time = 1 H ). Данные средних значений open - cl

Индикатор MTF Qristalium Arrows - это полуавтоматическая готовая торговая система, создана вместе с программистом - Александром Гаврилиным. ( https://www.mql5.com/ru/users/dken ) Индикатор работает на всех валютных парах. В индикаторе задействованы три правила: 1)торгуем только по тренду, 2)"покупай, когда все продают и продавай, когда все покупают", 3) Цена всегда идет против толпы. Индикатор MTF Qristalium Arrows фильтрует данные правила по нескольким таймфреймам с помощью встроенных индик

Best Scalper Oscillator - индикатор для MetaTrader 5 , работающий на основе математических расчетов по ценовому графику. Это один из наиболее распространенных и полезных индикаторов для нахождения точек разворота тренда. Best Scalper Oscillator оснащен несколькими типами уведомлений (на телефон, почта, алерт), что позволит своевременно открыть сделку.
Отличительные особенности Дает минимум ложных сигналов; Отлично находит развороты трендов; Прекрасно подходит для скальпинга; Прекрасно подх

Indicator designed to give investors the advantage of identifying strong candlestick patterns in real time by staining candlesticks representing these patterns, using possible buy or sell performance. The color for each pattern identified by the parameter indicator according to your taste. The candlestick patterns identified by this indicator are: Inside Bar Closing Price Reverse Top (PFRA)
Closing Price Reverse Bottom (PFRB) Dave Landry Bullish Engulf Bearish Engulf Advantages: Real Time At ea

Это мультивалютный и мультитаймфреймовый индикатор, который рассчитывает угол между двумя точками. Точки, для измерения угла, могут браться из индикатора ЗигЗаг (две последние точки), или из индикатора Moving Average (между двумя указанными барами), или это могут быть цены закрытия баров.
Измерение угла возможно в градусах или в радианах. Можно выбрать масштаб для расчета. Для лучшего понимания работы индикатора, вы можете изучить бесплатный индикатор Angle High Low . В параметрах вы можете

Apollo 3 route 66 It is an advanced trading system. This is a fully automatic Expert Advisor, which allows you to presize the trade according to the preferences of the trader. Apollo 3 route 66 have more customization options for your trade. Different options for different styles of trade. Apollo 3 route 66 is a break system of trade with different algorithm of trade mode. This EA using signals to place orders. Is a revolution in the customization of the trading. The algorithms develo
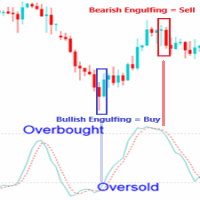
EXPERT ADVISOR DESCRIPTION
- Expert Advisor Engulfing in OBOS (Overbought Oversold) is an expert advisor consisting of a combined candle engulfing pattern and Stochastic Oscillator indicators. A Buy position occurs when engulfing are formed when the signal stochastic indicator is in the oversold area, A sell position occurs when engulfing are formed when the signal stochastic indicator is in the overbought area. - You can combine engulfing that form in certain timeframes with a signal stochas

Данный бот основан на анализе адаптивных скользящих средних. Эксперт отличается стабильными сигналами, Которые можно использовать как точные кратковременные сигналы. Это полускальперская система, которая анализирует рынок при помощи надежных индикаторов. Скальперская это система или нет, зависит от параметров TakeProfit и StopLoss . Пользуясь данным советником, нужно понимать что данный бот требует оптимизации. Бот работает как на счетах неттнг так и на счетах хееджинг. Но настройки необходимо

The Relative Strength Index (RSI), developed by J. Welles Wilder, is a momentum oscillator that measures the speed and change of price movements. The RSI oscillates between zero and 100. We have added to the reputable RSI indicator several types of alerts and a signal interval filter to be incorporated in your Expert Advisors. It works in ALL Timeframes ans instruments.
Product Features Email Alert Sound alert Push Notification (Alerts can be sent to your mobile phone) Signs on chart Aler
Данный бот может классифицировать тики на классы от 0 до 64, после чего проанализировав тиковый микро-сигналы он определяет в какую сторону открыть позицию. С экспертом можно работать только на рельних тиках как оптимизировать, и и тестировать!
Эксперт при работе употребляет учет позиций в любом режиме как неттинг (по одному символу может быть только одна позиция) так и с независимого учетом позиций или хеджинг (для одного символа может быть множество позиций).
Настраиваемые параметры бота

Trailing Uses Standard Deviation. Adaptive_Trailing_uses_StdDev_Indicator - это индикатор направленного движения, позволяющий определять тренд в момент его зарождения и задавать уровни защитного стопа. В отличие от трейлинга с постоянной дистанцией индикатор использует дистанцию к цене, пропорциональную текущему стандартному отклонению StdDev. Дистанция равна произведению стандартного отклонения на постоянный коэффициент, задаваемый пользователем. Таким образом, метод трейлинга адаптируется

Navigators - отличный инструмент для обнаружения пиков и впадин на графике. Данный индикатор использует модифицированный алгоритм обнаружения пиков и впадин. Этот алгоритм включают в себя индикатор Fractals и индикатор ZigZag.
Этот инструмент нужно использовать для анализа пиков и впадин, а также для обнаружения паттернов, или для других целей.Вы можете использовать этот мощный инструмент в своих целях на свой страх и риск.

Появилось желание торговать движение, пробой на самой высокой волатильности, или запустить советника-усреднителя торговать боковик в тихой низковолатильной гавани тогда этот продукт для Вас! Индикатор анализирует 28 валютных пар (основные и кроссы) и в зависимости от выбранных настроек покажет самые высоковолатильные (max) или наоборот (min). Как измерить волатильность? Существует 2 способа. Первый это измерить рендж заданного количества последних баров (bar). Второй замерить
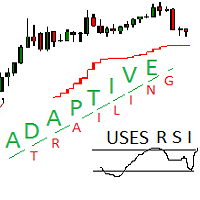
Adaptive trailing uses rsi
Adaptive trailing uses rsi - это скрипт, который реализует трейлинг, а именно: вычисляет уровень защитного стопа, отображает уровни на графике, исполняет заданные пользователем торговые операции при достижении ценой стоп уровня. Режимы работы. Трейлинг может осуществляться как снизу, когда уровень стопа ниже текущей цены и подтягивается за ценой, если она возрастает, так и сверху, когда уровни стопа выше текущей цены. Предусмотрено два режима расчета стоп уровня

KT CCI Divergence shows the regular and hidden divergence created between the price and CCI oscillator. Divergence is one of the vital signals that depicts the upcoming price reversal in the market. Manually spotting the divergence between price and CCI can be a hectic and ambiguous task.
Limitations of KT CCI Divergence
Using the CCI divergence as a standalone entry signal can be risky. Every divergence can't be interpreted as a strong reversal signal. For better results, try to combine it

Индикатор Trend Line PRO является самостоятельной торговой стратегией. Он показывает смену тренда, точку входа в сделку, а так же автоматически рассчитывает три уровня Take Profit и защиту от потери Stop Loss
Trend Line PRO идеально подходит для всех символов Meta Trader: валют, металлов, криптовалют, акций и индексов
Преимущества Trend Line PRO: Никогда не перерисовывает свои сигналы Возможность использования как самостоятельную стратегию Имеет три автоматических уровня Take Profi
FREE
Gridingale - это новый сложный советник, сочетающий в себе сетку и мартингейл. Он создает сетку ордеров в соответствии с настройками, но также добавляет к ней мартингейл. Таким образом, он будет фиксировать прибыль на малых и больших движениях. Встроена система покрытия убытков, позволяющая восстанавливать ордера, которые слишком удалены от текущей цены. Есть возможность фильтровать открытие нового цикла с помощью индикатора. Он может работать на обеих сторонах одновременно, но интересно, чтоб

При принятии решений торговых решений полезно опираться не только на исторические данные, но и на текущую рыночную ситуацию. Для того, чтобы было удобнее отслеживать актуальные тенденции в движении рынка можно воспользоваться индикатором « AIS Current Price Filter ». Этот индикатор учитывает только наиболее сильные изменения цены в ту или иную сторону. Благодаря этому можно прогнозировать краткосрочные тенденции в ближайшем будущем – как бы не развивалась текущая рыночная ситуация, рано или поз

Советник MTF Qristalium Average создан вместе с программистом Александром Гаврилиным ( https://www.mql5.com/ru/users/dken ) . Данная система полностью автоматизированная. Это не мартингейл. Здесь работает усреднение. Работает на всех валютных парах. В советнике задействованы три правила: 1)торгуем только по тренду, 2)"покупай, когда все продают и продавай, когда все покупают", 3) Цена всегда идет против толпы. MTF Qristalium Average фильтрует данные правила по нескольким таймфреймам с пом

Устойчивые распределения можно использовать для сглаживания финансовых рядов. Так как для расчета параметров распределения можно использовать довольно глубокую предысторию, то такое сглаживание, в некоторых случаях, может оказаться даже более эффективным по сравнению с другими способами. На рисунке представлен пример распределения цен открытия валютной пары « EUR-USD » на тайм-фрейме H1 за десять лет (Рисунок 1). Выглядит завораживающе, не правда ли?
Основная идея, лежащая в основе данного

CAP Moving Average EA MT5 trades using the Moving Averages Indicator. It offers many customizable Moving Averages trading scenarios and flexible position management settings, plus many useful features like customizable trading sessions, a martingale and inverse martingale mode. [ Installation Guide | Update Guide | Submit Your Problem | FAQ | All Products ]
Functions Easy to use and customizable Moving Average setting. Customizable indicator settings Built-in money management Grid
FREE

This indicator will show a vertical representation of the volume distribution within a selected user range.
This is a free version of the full product. It is limited to use on a week old data or older. Find the full product at https://www.mql5.com/en/market/product/42234 .
Main features: This Indicator will create an image that will allow viewing the tick volume per price level in a graphical form. The indicator will work on any range size in any time-frame, limited only by your computer m
FREE

Expert Advisor Raikow FX EA operates using the Vegas Tunel strategy, which consists of fibonacci levels above and below the 169 period moving average. It can operate on trend and counter trend.
It has margin control, open order limit, positive swap control and filter indicators like RSI and ADX. It also has dynamic and fixed take profit in the fibonacci levels and trailling stop levels. For more information visit our Telegram group https://t.me/RaikowFXEAEN

Indicator SR levels true in small time frames is very useful for scalping while in bigger ones it is good for day or position trading.
SR levels true can draw 4 support/resistance levels based on defined maximum rebouds from price level. Indicator scans defined number of bars in time axis and defined number of pips in price axis (both sides - up and down) and calculates how much times price was rejected from scanned price levels. At the price levels where maximum rebounds are counted, support
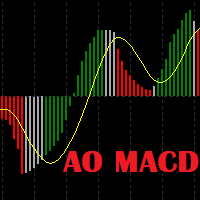
Awesome Oscillator Moving Average Convergence/Divergence Indicator. Не опаздывает как AO и не шумит как MACD. Представлена базовая версия индикатора. В разработке версия "PRO" с такими возможностями как отправка сигналов на e-mail и построение на графике линий дивергенций и конвергенций. Входные параметры: Fast: короткая EMA Slow: длинная EMA Signal: сигнальная линия Цвета: Красный: MACD < Signal Зеленый: MACD > Signal Серый: MACD выше Signal, но ниже предыдущего MACD MACD ниже Signal, но выше п

Простой индикатор, показывающий цены Bid и Ask. Есть настройки отображения информации и возможность перетаскивать панель. Индикатор используется для наглядного отображения цен покупки и продажи актива.
Входные параметры : Support - Ссылка, на помощь проекту heigth - Высота формы width - Ширина формы size - Размер текста bidcol - Цвет текста bid askcol - Цвет текста
FREE

Basket trading /Basket SL TP/Portfolio SL TP/ Group Trade SL TP
This is very good utility when you want set SL TP for many open trades or portfolio
As soon your account equity reach SL or TP , This EA will close all trades . you are allowed to change SL and TP any time.
Also you need not to monitor group trades all the time you just set SL and TP in utility and relax once SL / TP situation will come all trades will be closed automatically.
SL and TP are in $Amount like 100$ SL and 500

Basket trading /Basket SL TP Automatic SL TP Calculation
This utility will calculate SL and TP based on 2 input parameters
PerUnitTP -This means what is per .01 TP like 1 $ per .01 Lot. SLToTP_Ratio-This what is ration SL to TP if this parameter is 3 that means if TP is 1 $ then SL will be 2$ (per .01 Lot)
so if total portfolio summing to .05 lot that that means TP will be automatically become 5 $ and SL become 10 $.
This is very good utility when you want set SL TP for many open t
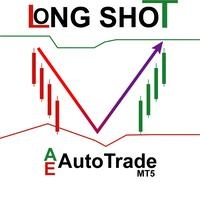
Expert Advisor de la conocida estrategia LongShot. La estrategia combina los movimientos del precios con el canal de Donchian y usa dos medias móviles para la toma de posiciones así como la magnitud en los cambios en los precios usando un oscilador. El EA está diseñado para hacer tanto swing como scalping. Antes de usarlo es necesario tener en cuenta que los parámetros que vienen por defecto corresponden a una optimización determinada, para una operativa tendencial en gráficos de 1h, pero puede

Индикатор теней.
Отображает размер теней свечей, в пунктах, в виде гистограммы. Работает в двух режимах, на выбор пользователя. Описание настроек индикатора Mode - режимы работы индикатора, два режима: первый height - режим отображения верхних и нижних теней свечей; второй difference - режим отображения разницы теней свечей, разница между верхней и нижней тенью свечи.
FREE

Moon 3 is a Trend indicator. I s a powerful indicator of TREND for any par and any timeframe. It doesn't requires any additional indicators for the trading setup.The indicator gives clear signals about opening and closing trades.This Indicator is a unique, high quality and affordable trading tool.
Perfect For New Traders And Expert Traders Low risk entries. Never repaints signal. Never backpaints signal. Never recalculates signal. For MT5 Only Great For Scalping Great For Swing Trading Arro
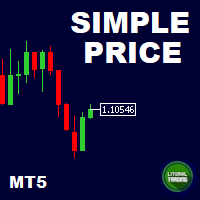
This is our simplest tool! With it you hide the Bid and Ask lines from chart and have only a small rectangle showing what current price is. This tool is useful for those who want the cleanest chart possible. You can also show the Ask price only, instead of the Bid (most common). To further assist you in cleaning the chart check out our other tool: https://www.mql5.com/en/market/product/41835 Any questions or suggestions, please contact us. Enjoy!
FREE
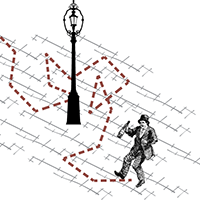
Скрипт моделирует случайное блуждание цены и сохраняет его в CSV файл. Этот файл можно использовать для создания графиков случайного блуждания цен. Как создать и настроить пользовательский символ можно прочитать здесь .
Настройки скрипта: SymName - Имя CSV файла, который будет сохранён в MQL5/Files. HistoryDepth - Количество минут для моделирования случайного блуждания. StartFrom - Цена с которой начнётся моделирование. VolaCycle - Режим симулирует внутридневную волатильность.
На картинках п
FREE

Several assets in several markets have the behavior of using specific numbers as Force Numbers, where support, resistance and price thrust is created. Let this indicator draw those levels of support and resistance for you. You can also stack it to show different level of Prices! This technique is being used by Tape Readers and Order Flow traders all over the world for a long time. Give it a try. Challenge yourself to study new ways of Price Action!
SETTINGS
What Price reference to use in th
FREE

KT Bollinger Bands Trader is a 100% automated expert advisor that's incorporated a mean reversion trading strategy using the Bollinger bands during the period of low volatility. Price often reacts at the upper or lower line of Bollinger bands, but a reversal not always occurs. However, there is more chance of price reversal during the time of low volatility.
Entries A buy trade is activated when price correctly aligns below the bottom line of Bollinger bands. A sell trade is activated when pri

Trailing Stop Fast Trailing Stop Fast EA locks trade profit once trade moves in profit by certain points(eg 100 points) by moving the Stop Loss in direction of trade.
There are three inputs in EA to be provided by user to EA TrailingStart this input used as activator when trade moved 100 points towards profit, this EA will start shifting your stop loss towards profit.
TrailingStop input defines what should be the distance of stop loss from current market price once TrailingStart activat
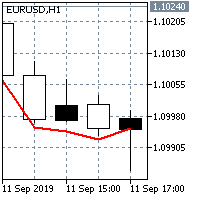
SEMA is the Sextuple Exponential Moving Average:
SEMA = PEMA + QEMA(y - PEMA)
The principle of its calculation is similar to Double Exponential Moving Average (DEMA). The name "Sextuple Exponential Moving Average" does not very correctly reflect its algorithm. This is a unique blend of the single, double, triple, quadruple and pentuple exponential smoothing average providing the smaller lag than each of them separately. SEMA can be used instead of traditional moving averages. It can be use

Индикатор индекс относительной силы (RSI - Relative Strength Index) с динамическими уровнями зон перекупленности и перепроданности.
Динамические уровни изменяются и подстраиваются под текущие изменения индикатора и цены, и представляют собой своеобразный канал.
Настройки индикатора period_RSI - Период усреднения для вычисления индекса RSI. applied_RSI - Используемая цена.Может быть любой из ценовых констант: PRICE_CLOSE - Цена закрытия, PRICE_OPEN - Цена открытия, PRICE_HIGH - Максимальная за
FREE

Signal: https://www.mql5.com/en/signals/2021117 Set file JJ_NZDJPY_H1_E01V01 for 1k account (adjust risk setting and backtest for other accounts) Legacy Update (7.0) Simplified Use : Set to default settings. Change trading mode to "use JJ_NZDJPY_H1_E01V01 strategies". Retired Features : "Use barcode files" and "create barcode files" options are retired. Single barcode scanning is still available and can be manually added in "compatibility mode". Multi Strategist (MS) Overview ( Manual ) Functio

Этот индикатор позволяет определить вероятность того, что цена достигнет того или иного уровня. Его алгоритм достаточно прост и базируется на использовании статистических данных по ценовым уровням той или иной валютной пары. Благодаря собранным историческим данным можно определить в каких пределах будет изменяться цена в течение текущего бара. Несмотря на простоту, этот индикатор может оказать неоценимую помощь в торговле. Так, с его помощью можно определять уровни TakeProfit и StopLoss для

The 3 Automatic Vwap (Midas) Indicator can be used for Price and Volume studyers to map the movement of market drivers. It automatically plots 3 Vwaps, two of which are dynamic and will be updated throughout the day if new highs or new lows emerge. The third Vwap is daily and can help if the trend is up or down. Also, an auxiliary indicator that plots (also dynamic) points of interest with OHLC prices (Open, High and Low of the current day and Close of the previous day) was inserted. Success and

Easily get all relevant economic events of the current day right into your chart, as markers. Filter what kind of markers do you want: by country (selected individually) and by Importance (High relevance, Medium, Low or any combination of these). Configure the visual cues to your liking. If there is more than one event set to the very same time, their Names will be stacked and you will see the messages merged with the plus (+) sign on the marker. Obviously that long or too much events on the sam
FREE

For those who like trend the Force will be a very useful indicator. This is because it is based on the famouse ADX, which measure the strenght of a trend, but without its 3 confusing lines. Force has its very simple interpretation: if the histogram is above zero level the trend is up, otherwise it is down. You can use it to find divergences too, which is very profitable. Thanks to Andre Sens for the version 1.1 idea. If you have any doubt or suggestion, please, contact me. Enjoy!
This is a fre
FREE

Apollo 2 The wall It is an advanced trading system. This is a fully automatic Expert Advisor, which allows you to presize the trade according to the preferences of the trader. Apollo 2 have more customization options for your trade. Different options for different styles of trade. Apollo 2 the wall is a break system of trade with different algorithm of trade mode. This EA using signals to place orders. Is a revolution in the customization of the trading. The algorithms developed for the id

TickChart Indicator plots tick line on the main window of MetaTrader.
In the Lite version, the number of ticks is limited to 20 and the alert function described below is omitted. The tick-line shows the most detailed, fastest and real-time activities of the market, which are usually hidden in bars or candles longer than 1 minute. Usually, several new tick-line segments appear while a bar of M1 time frame is completed. After the release of an important economic indicator, the number of ticks pe
FREE
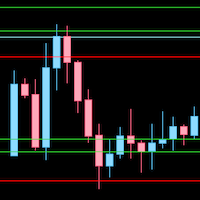
Draw levels of support and resistance based on highs/lows or closes from daily, weekly or monthly. This indicator uses the highs, lows or closes to draw horizontal lines on the graph. By observing those lines you can identify trend (gaining or losing levels of resistence/support) and find good levels where price can bounce. For those who trade price action, this is a very useful indicator.

Easy Market makes the market easier to trade. It allows you to see an "eternally" side (no trend) market, making it extremely easy to see when the price is overbought or oversold. Both trend and consolidation traders will like Easy Market. You can use it as an auxiliary window (below chart) or in full screen mode. See the screenshots and note how it gives you accurate entries! If you have any doubt or suggestion, please, contact us! Ejoy!

This is a conventional volume indicator, which displays the ticks or real volume (if available from your broker). But it has others features like: 5 color schemes: single, when crossing with moving average, when crossing a specific level, when having different volume between bars and when candle change color. Being hable to have a customizable moving average. Being hable to have a value indicator line. Many thanks to Diego Silvestrin for the ideas to version 1.1 and Konstantin Demidov for
FREE

As it name implies, this is an exaustion oscillator. However, you may wonder: what differs you from others oscillators like RSI, Stochastic, CCI etc? The difference is that ours is more powerful and accurate ! Your oscillator filters the nois e made by other oscillators, and shows you only the exact moment to enter the trade. Of course, using it alone, like any other indicator, has its risks. Ideally, reconcile it with technical analysis and/or others indicators. If you have any doubt or suggest

MOON 2 THE WALL is a Oscilator indicator. I s a powerful indicator of TREND for any par and any timeframe. It doesn't requires any additional indicators for the trading setup.The indicator gives clear signals about opening and closing trades.This Indicator is a unique, high quality and affordable trading tool.
Perfect For New Traders And Expert Traders Low risk entries. Never repaints signal. Never backpaints signal. Never recalculates signal. For MT5 Only Great For Scalping Great For Swi

Imagine VWAP, MVWAP and MIDAS in one place... Well, you found it! Now you can track the movement of Big Players in various ways, as they in general pursue the benchmarks related to this measuring, gauging if they had good execution or poor execution on their orders. Traders and analysts use the VWAP to eliminate the noise that occurs throughout the day, so they can measure what prices buyers and sellers are really trading. VWAP gives traders insight into how a stock trades for that day and deter
FREE

Описание Данный индикатор строит (альтернативные, математически рассчитанные) уровни поддержки и сопротивления, а так же уровни, к которым с большой вероятностью придет цена в ближайшее время. Следует обратить внимание на то, что расчет уровней производится на исторических данных, и качество котировок играет важную роль при построении индикатором линий. Замечу, что отрисованные Magneto и Magneto Weekly линии не изменяют свои значения на всем расчетном периоде. Важное изменение! Добавлена функция

Are you tired of erasing the objects on chart and then having to put them back in? What if you had a tool that would allow you to hide and show all objects any time? Cool, huh? That is why I developed this tool as an indicator. With it you hide all objects using a shortcut button on chart or the keyboard (customizable). If you have any suggestions or find a bug, please, contact us. Enjoy!
FREE

Pivot levels indicator shows 7(9 for Camarilla) pivot levels. It is adjusted for major use, including: all standard time frames
choice of periods to show four popular calculation formulas (typical, median, weighted and Camarilla)
pivot day shift choice of properties for lines and labels choice of showing alerts when crossing pivot lines Parameters: ----------Main parameters----------- Timeframe - time frame for pivot levels
Number of periods to show - displays pivot levels for number of perio
MetaTrader Маркет - уникальная площадка по продаже роботов и технических индикаторов, не имеющая аналогов.
Памятка пользователя MQL5.community расскажет вам и о других возможностях, доступных трейдерам только у нас: копирование торговых сигналов, заказ программ для фрилансеров, автоматические расчеты через платежную систему, аренда вычислительных мощностей в MQL5 Cloud Network.
Вы упускаете торговые возможности:
- Бесплатные приложения для трейдинга
- 8 000+ сигналов для копирования
- Экономические новости для анализа финансовых рынков
Регистрация
Вход
Если у вас нет учетной записи, зарегистрируйтесь
Для авторизации и пользования сайтом MQL5.com необходимо разрешить использование файлов Сookie.
Пожалуйста, включите в вашем браузере данную настройку, иначе вы не сможете авторизоваться.